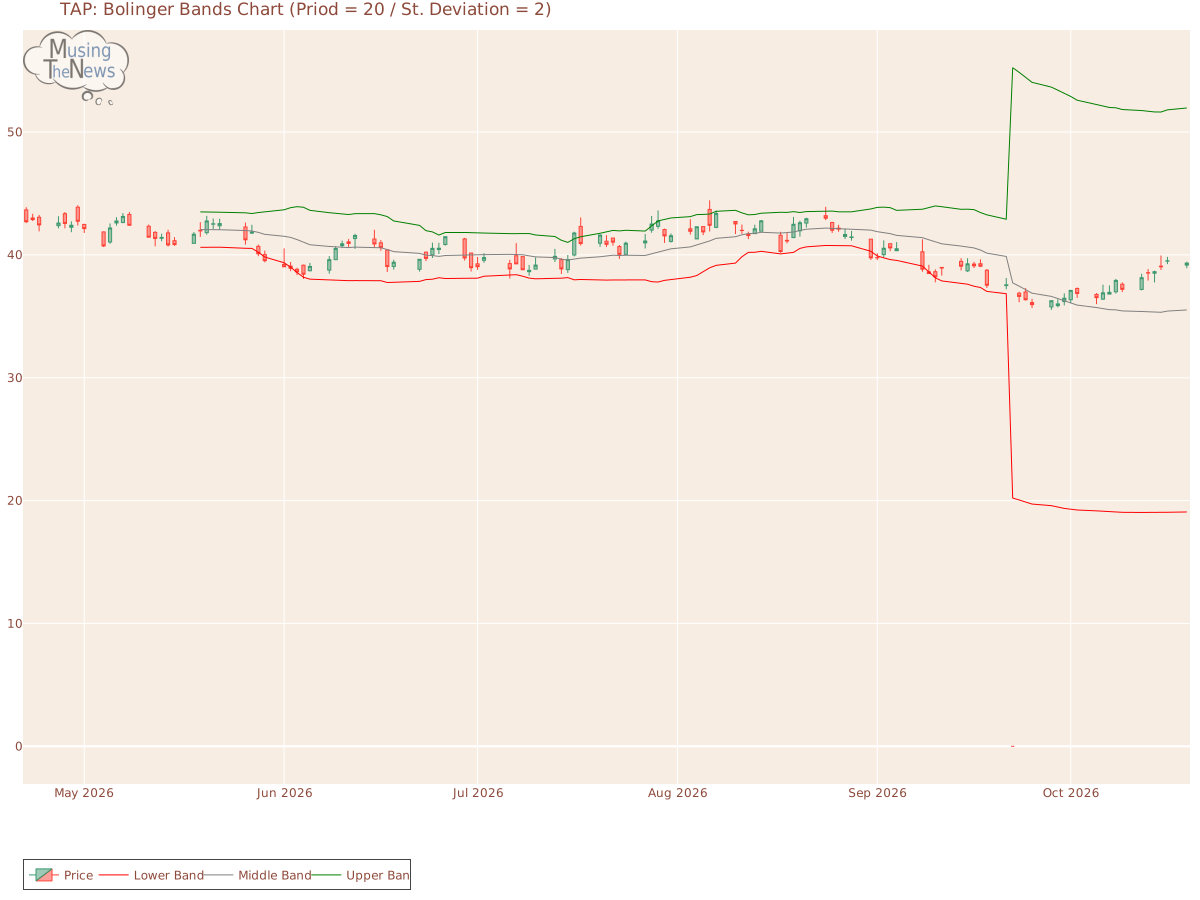
The current reading of the BOLL BANDS is neutral for TAP, with no clear signals for an upward or downward trend. This indicates that the market may be in a state of uncerta...
By MusingTheNews
Updated 2026-10-20 23:25:35
Overall Technical outlook
Price Summary
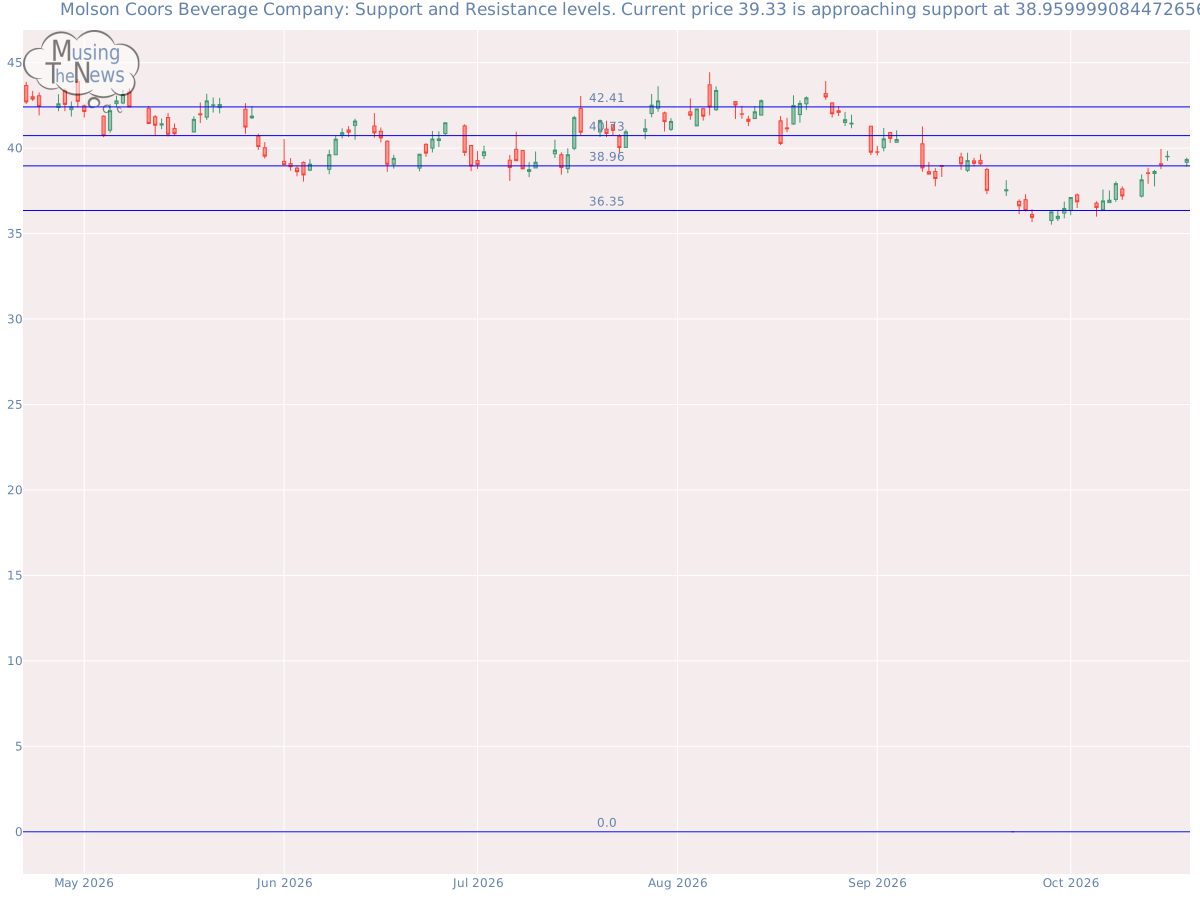
On 2026-10-19, Molson Coors Beverage Company's stock started at 39.17, soared to 39.44, dropped to 38.91, and finished the day 0.41% up at 39.33, with a trading volume of 2626900 shares. The stock's peak price over the last 52 weeks is 54.38, with the lowest being 0.0.
Technicals
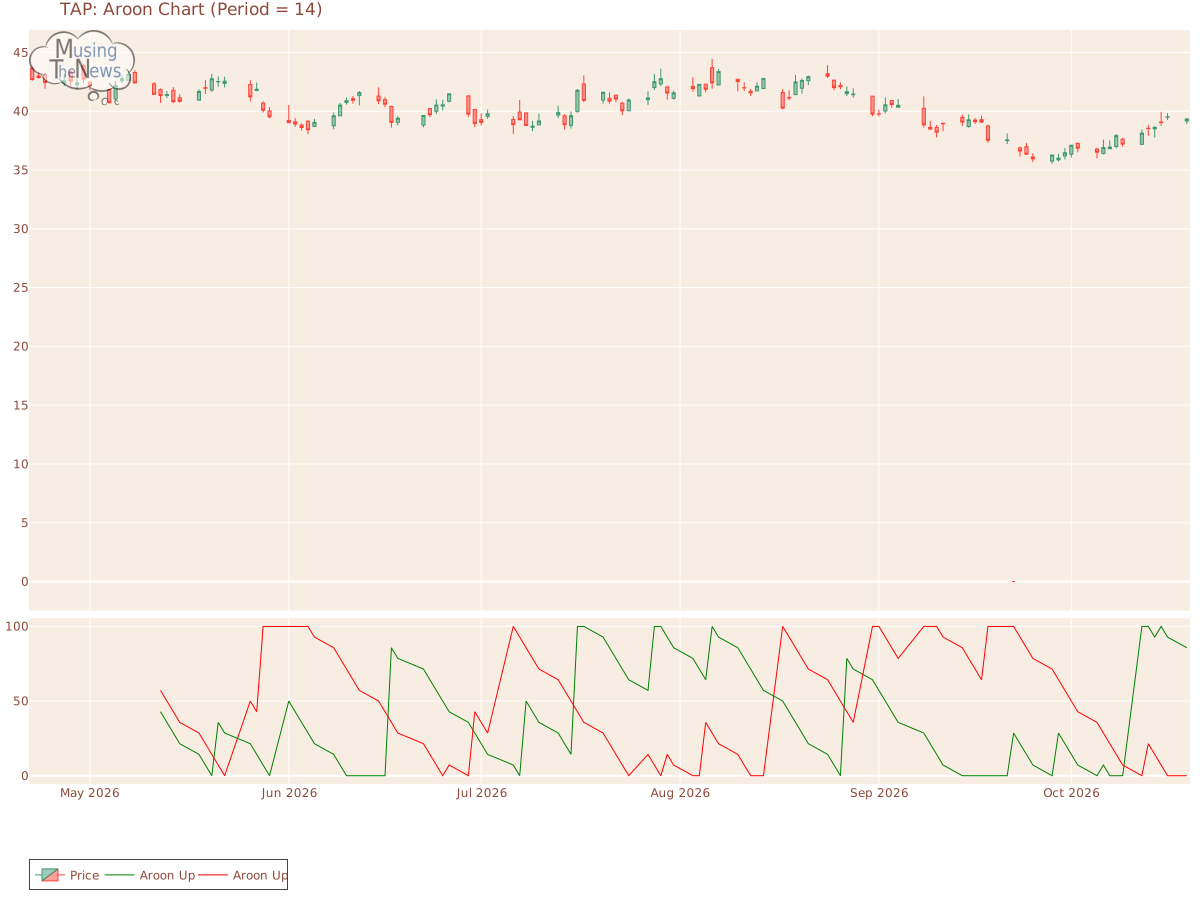
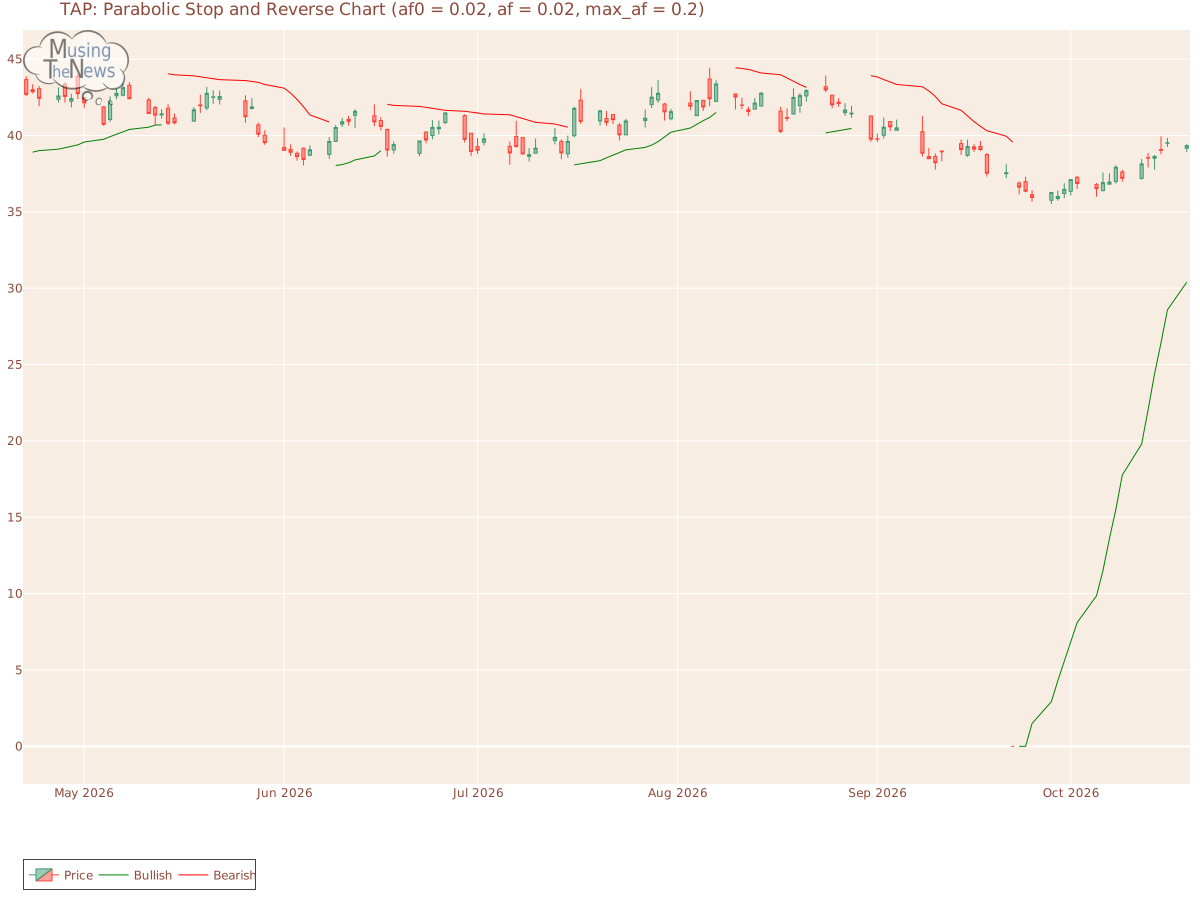
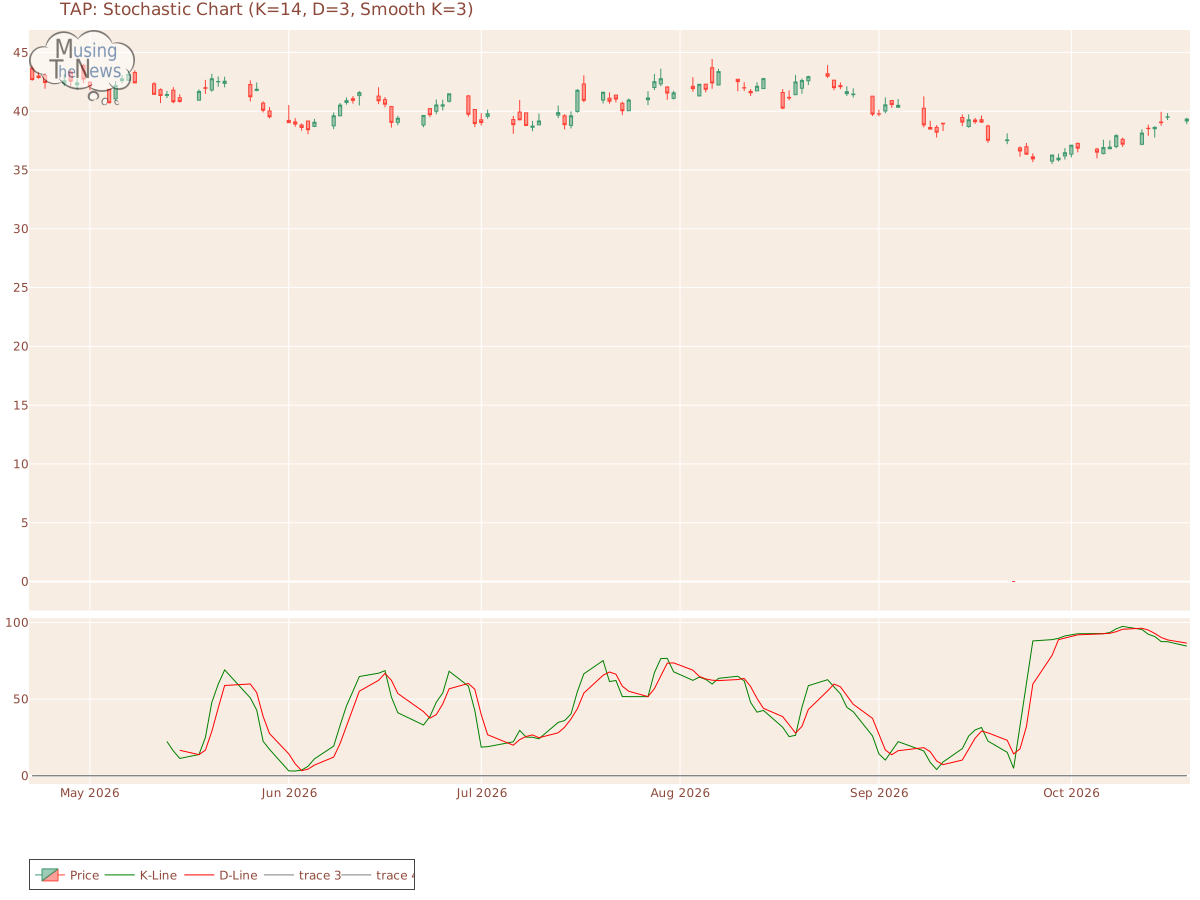
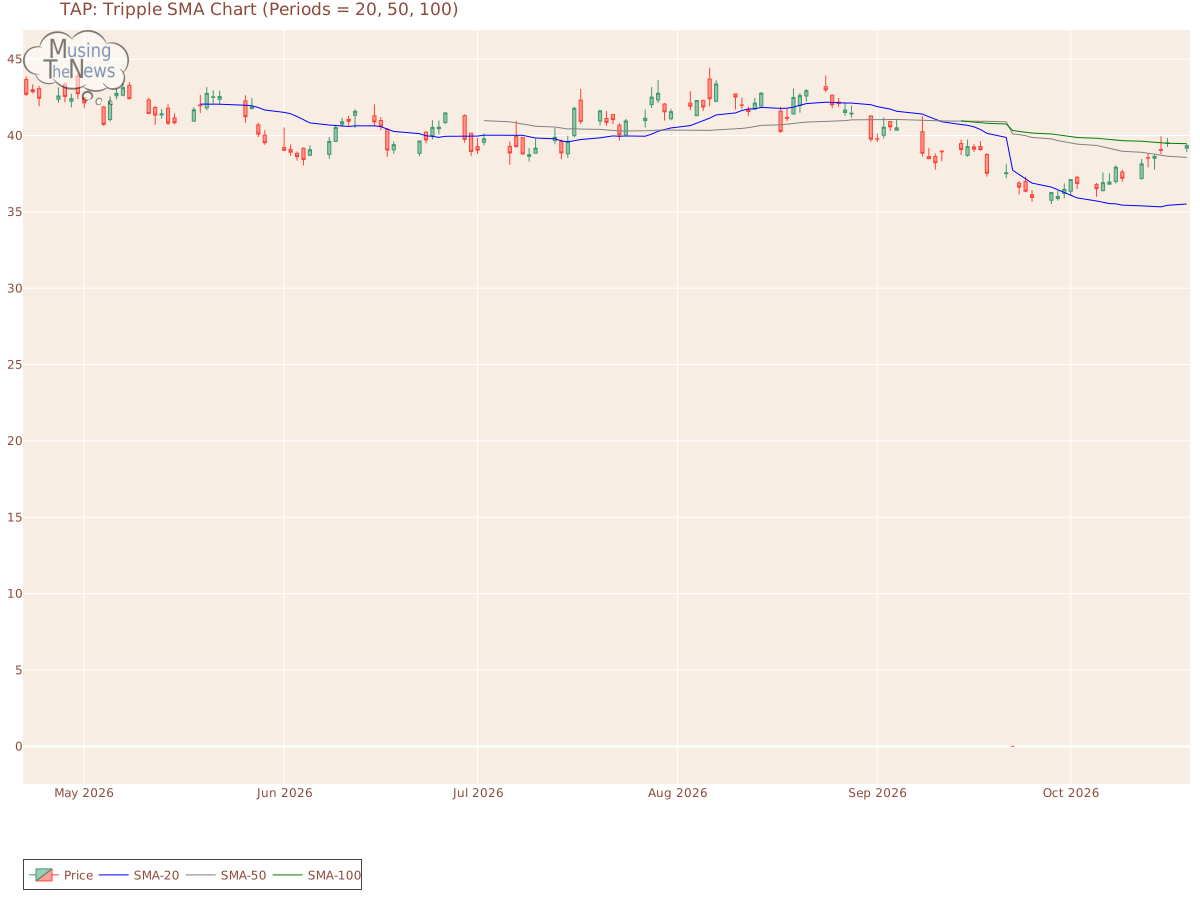
Support and Resistance: At 39.33, the price is supported by 38.96 and resisted by 40.73. This indicates that the price for Molson Coors Beverage Company might fluctuate between these levels, with 38.96 acting as a support and 40.73 limiting further upward movement.Support/Resistance for TAPAroon: The AROON is currently neutral, showing no clear bias toward a rising or falling trend. This lack of directional clarity suggests that the market may be in a holding pattern, awaiting further developments.Aroon chart for Molson Coors Beverage CompanyBol. Bands: The current reading of the BOLL BANDS is neutral for TAP, with no clear signals for an upward or downward trend. This indicates that the market may be in a state of uncertainty, with no dominant force driving the direction.Bolinger Bands chart for Molson Coors Beverage CompanyParabolic SAR: The PSAR continues to indicate a bullish outlook, setting a crucial support level. This strong support could bolster the ongoing upward trend, suggesting that the market may remain in a positive trajectory. Investors may view this as a sign of sustained bullish momentum.Parabolic Stop and Reverse chart for Molson Coors Beverage CompanyStochastic: The stochastic indicator shows the K-line below the D-line and above 80, hinting at the potential beginning of a bearish price move for TAP. This setup could signal that the market's recent strength is weakening, possibly leading to a downturn. Traders should watch for further evidence of a bearish trend.Stochastic chart for Molson Coors Beverage CompanyTripple Moving Agerage: The Tripple MOVING AVG is in a neutral stance for TAP, not indicating a clear upward or downward trend. This suggests a period of market indecision, where neither bulls nor bears have the upper hand.Tripple SMA chart for Molson Coors Beverage Company When analyzing a company, its fundamentals—such as earnings, management efficiency, and strategic initiatives—must be considered alongside technical data. The context of the industry in which the company operates also plays a key role, as market trends and competitive dynamics can significantly impact performance. By taking a comprehensive approach, combining both fundamental and technical analysis, one can gain a deeper understanding of the company's potential for growth or risk.