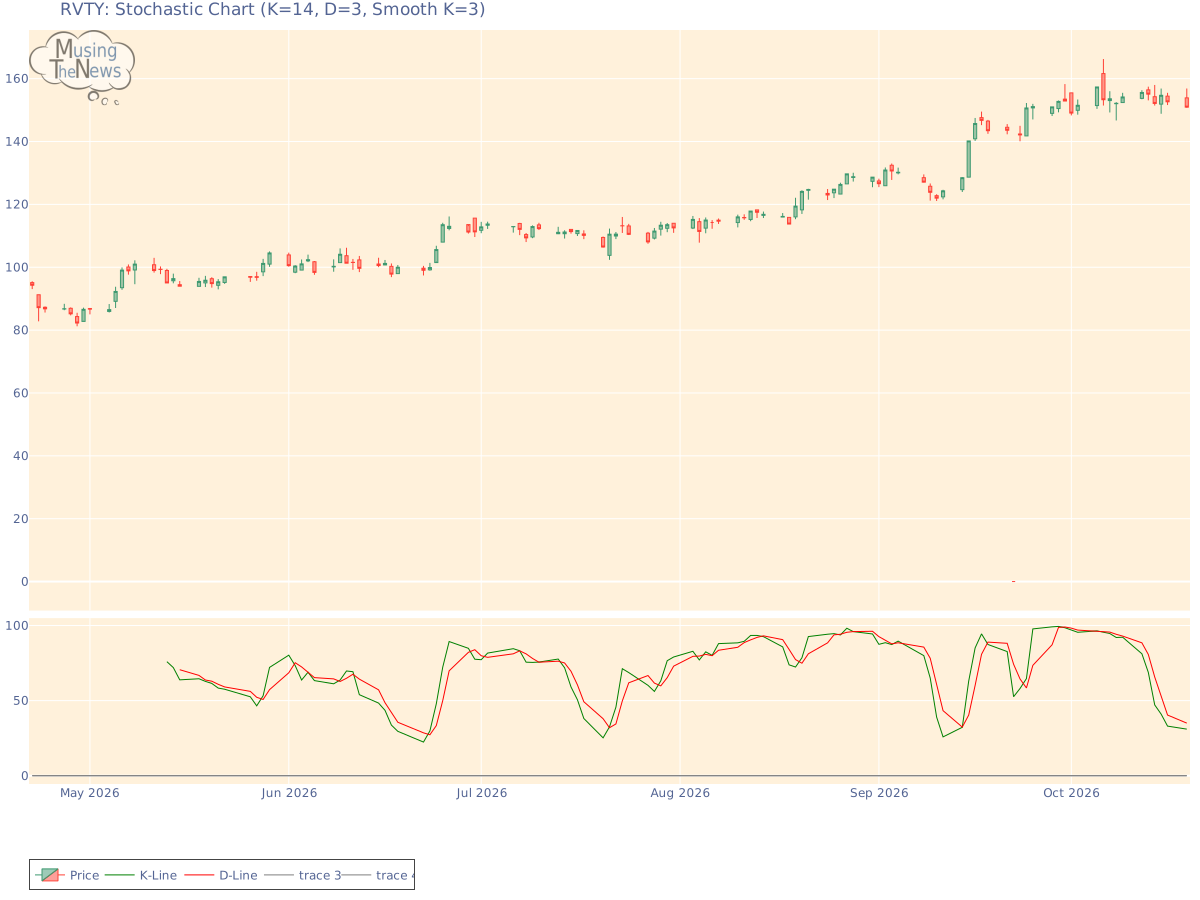
The current state of the STOCHASTIC is neutral, providing no clear signals for either an upward or downward movement. This indicates that the market may be in a state of eq...
By MusingTheNews
Updated 2026-10-20 23:25:48
Overall Technical outlook
Price Summary
On 2026-10-19, Revvity, Inc.'s shares started at 153.89, peaked at 156.87, bottomed out at 150.71, and ended -1.92% down at 150.94, with 1259500 shares traded. During the past 52 weeks, the highest stock price was 157.36, and the lowest was 0.0.
Technicals
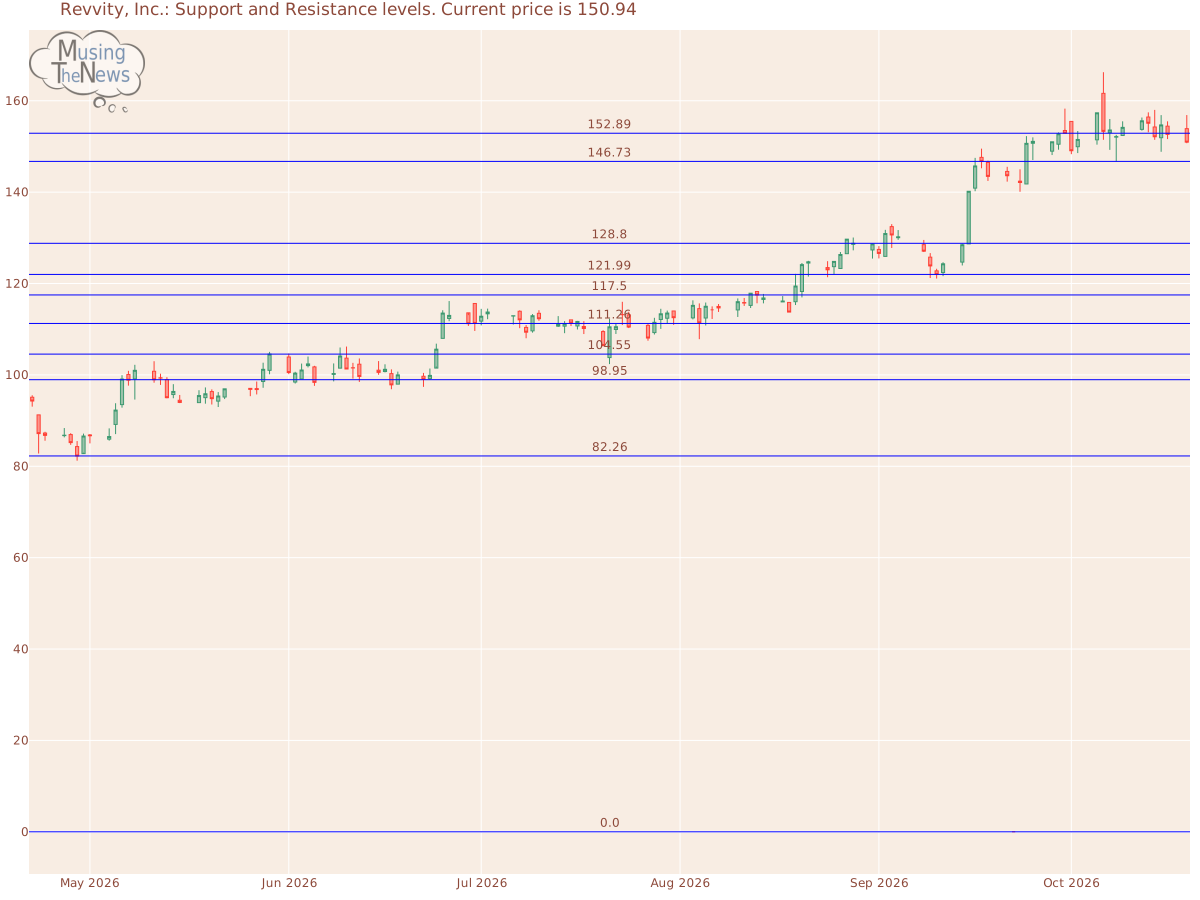
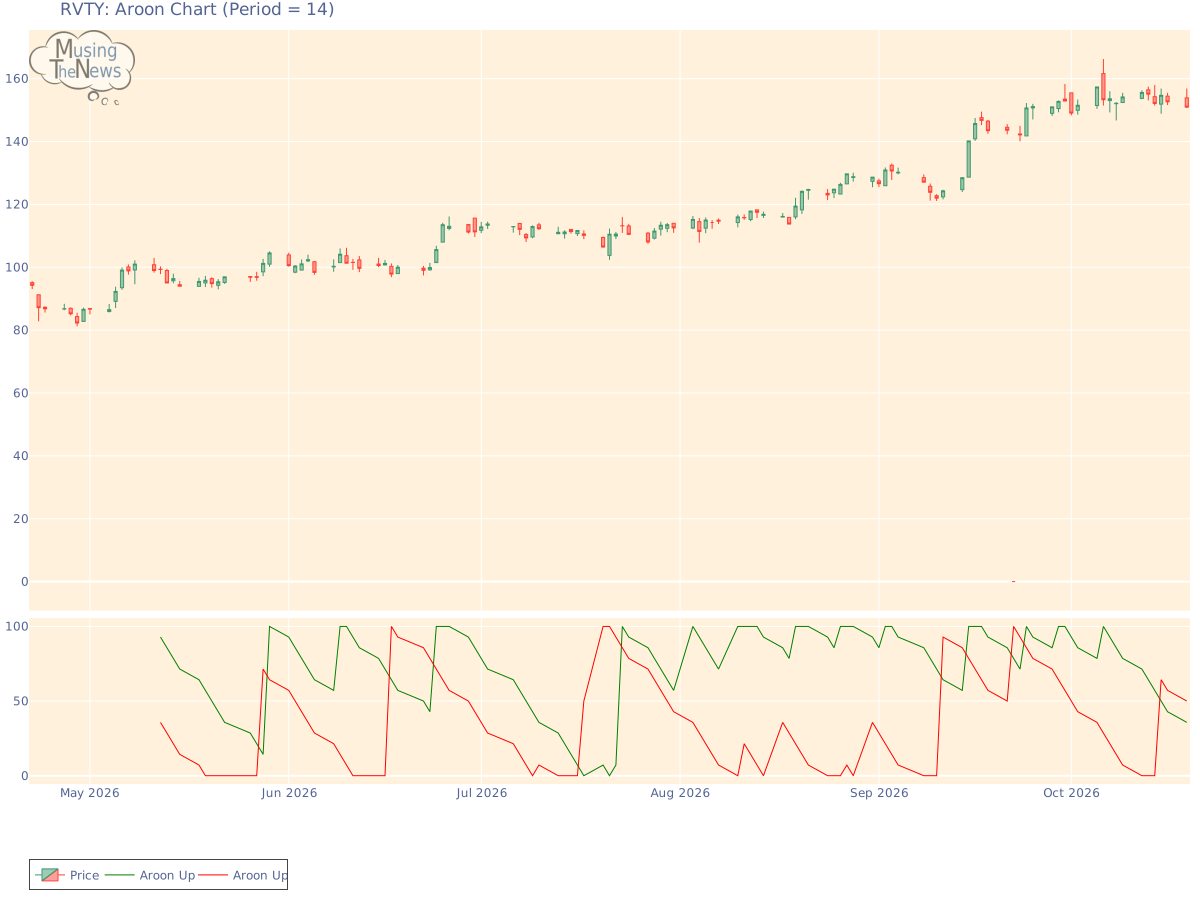
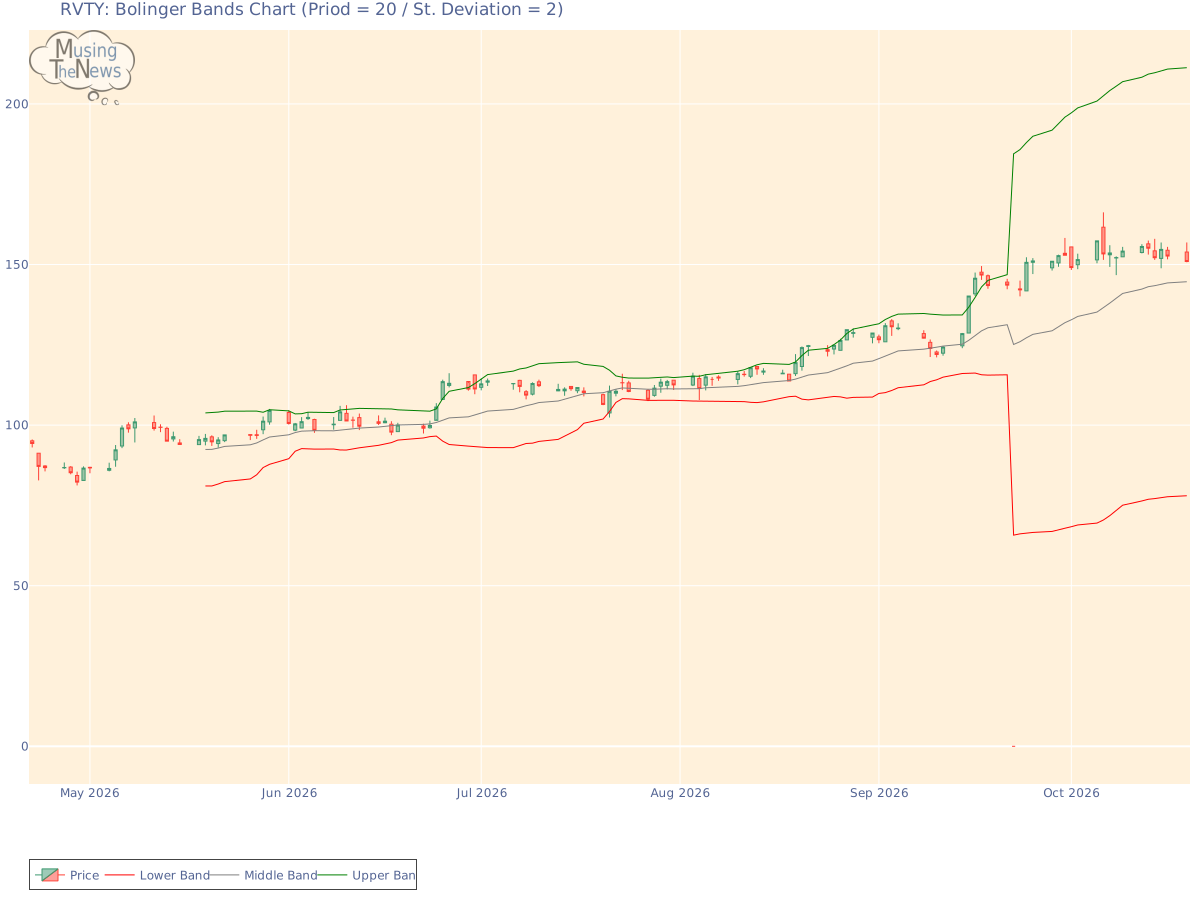
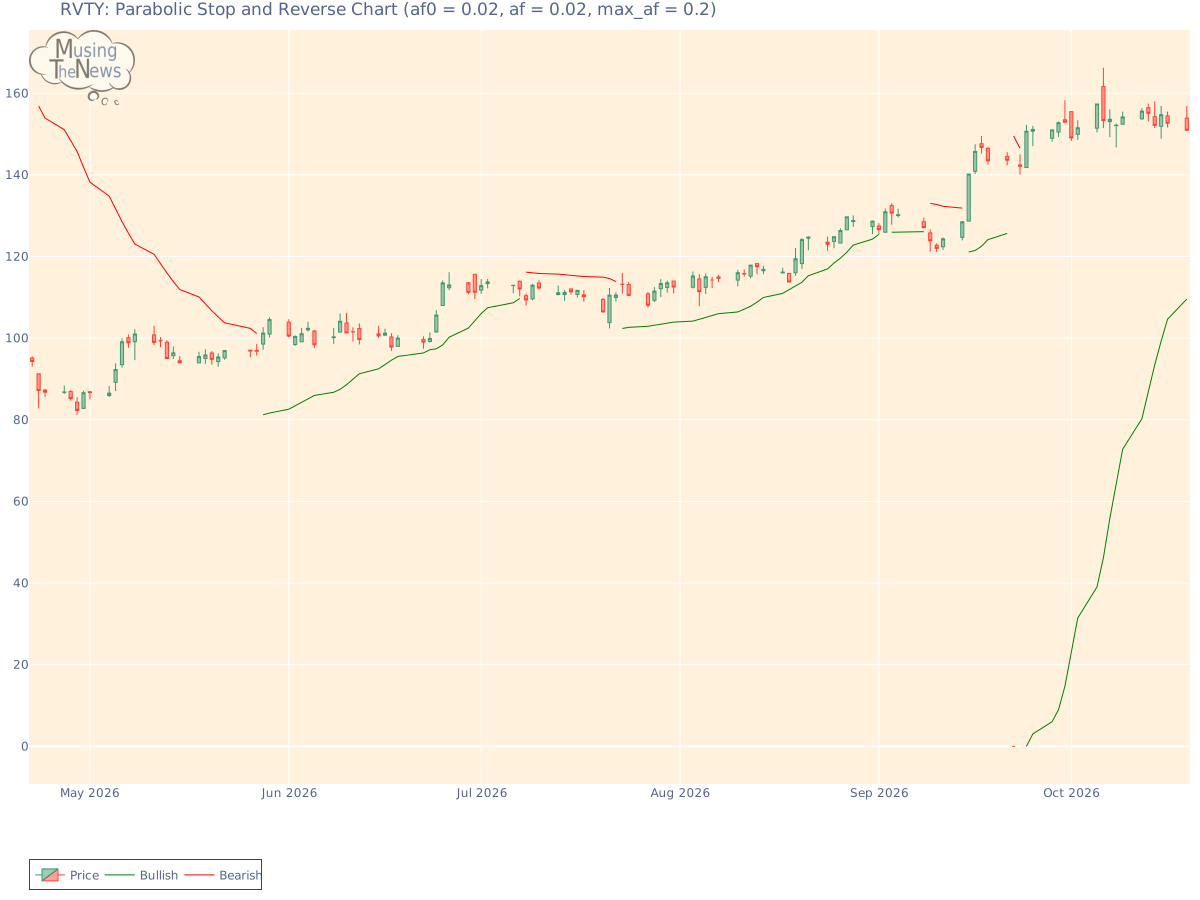
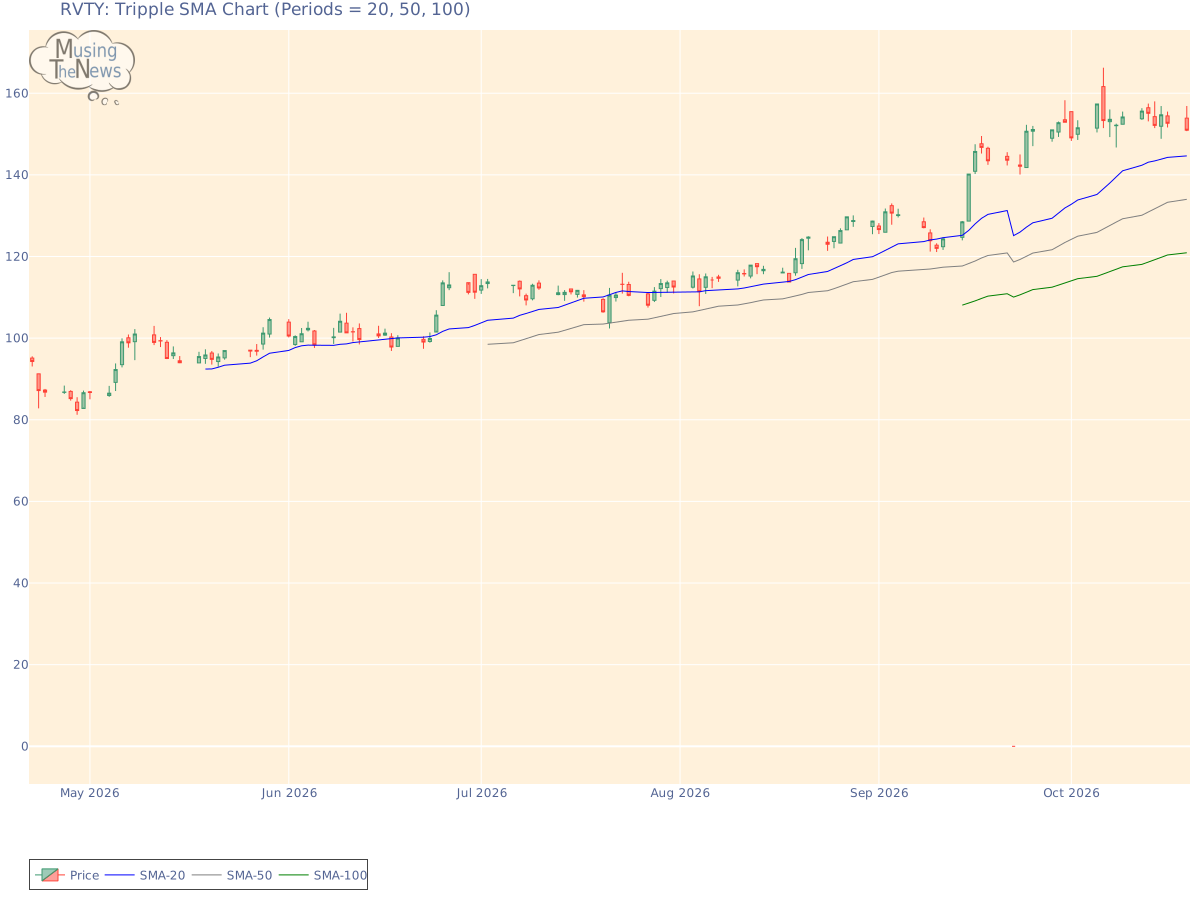
Support and Resistance: At 150.94, the price is held up by support at 146.73 and faces resistance at 152.89 for RVTY. This suggests a trading range where 146.73 provides a base and 152.89 limits upward movement.Support/Resistance for RVTYAroon: The current state of the AROON is neutral for RVTY, providing no clear indication of a trend in either direction. This suggests that the market may be lacking momentum, making it difficult to predict future movements.Aroon chart for Revvity, Inc.Bol. Bands: The current reading of the BOLL BANDS indicator suggests a neutral stance, with no clear signals indicating an upward or downward direction. This lack of directional bias suggests the market may be in a period of consolidation or uncertainty.Bolinger Bands chart for Revvity, Inc.Parabolic SAR: The PSAR continues to indicate a bullish outlook, setting a crucial support level. This strong support could bolster the ongoing upward trend, suggesting that the market may remain in a positive trajectory. Investors may view this as a sign of sustained bullish momentum.Parabolic Stop and Reverse chart for Revvity, Inc.Stochastic: The current state of the STOCHASTIC is neutral, providing no clear signals for either an upward or downward movement. This indicates that the market may be in a state of equilibrium, with no strong momentum in either direction.Stochastic chart for Revvity, Inc.Tripple Moving Agerage: The 20, 50, and 100 moving averages are currently aligned bearishly, signaling a downtrend. However, the slopes of the 20 and 50 SMAs are beginning to waver, indicating that this bearish momentum might be fading. This could suggest an upcoming shift towards bullish price action, as the market's current downward trend may be approaching a reversal, potentially leading to a new upward move.Tripple SMA chart for Revvity, Inc. When evaluating a company's technical data, such as stock price charts or volume, it is essential to first consider its fundamentals. These fundamentals include financial stability, growth potential, and competitive advantages. Additionally, understanding the broader industry in which the company operates offers context that helps to make sense of technical patterns. By examining both the company's internal strengths and external environment, one can make more accurate and meaningful conclusions about its stock performance.