Fundamentals for Newmont Corporation
With Newmont Corporation's Forward PE in a favorable range, the stock appears reasonably priced compared to its earnings. This suggests that it's not overpriced and there i...






Business Operations:
Sector: Basic MaterialsIndustry: Gold
Newmont Corporation operates as a gold producer. It also explores for copper, silver, lead, zinc, and other metals. It has operations and/or assets in the United States, Papua New Guinea, Australia, Ghana, Suriname, Argentina, Dominican Republic, Chile, Peru, Ecuador, Mexico, and Canada. The company was founded in 1916 and is headquartered in Denver, Colorado.
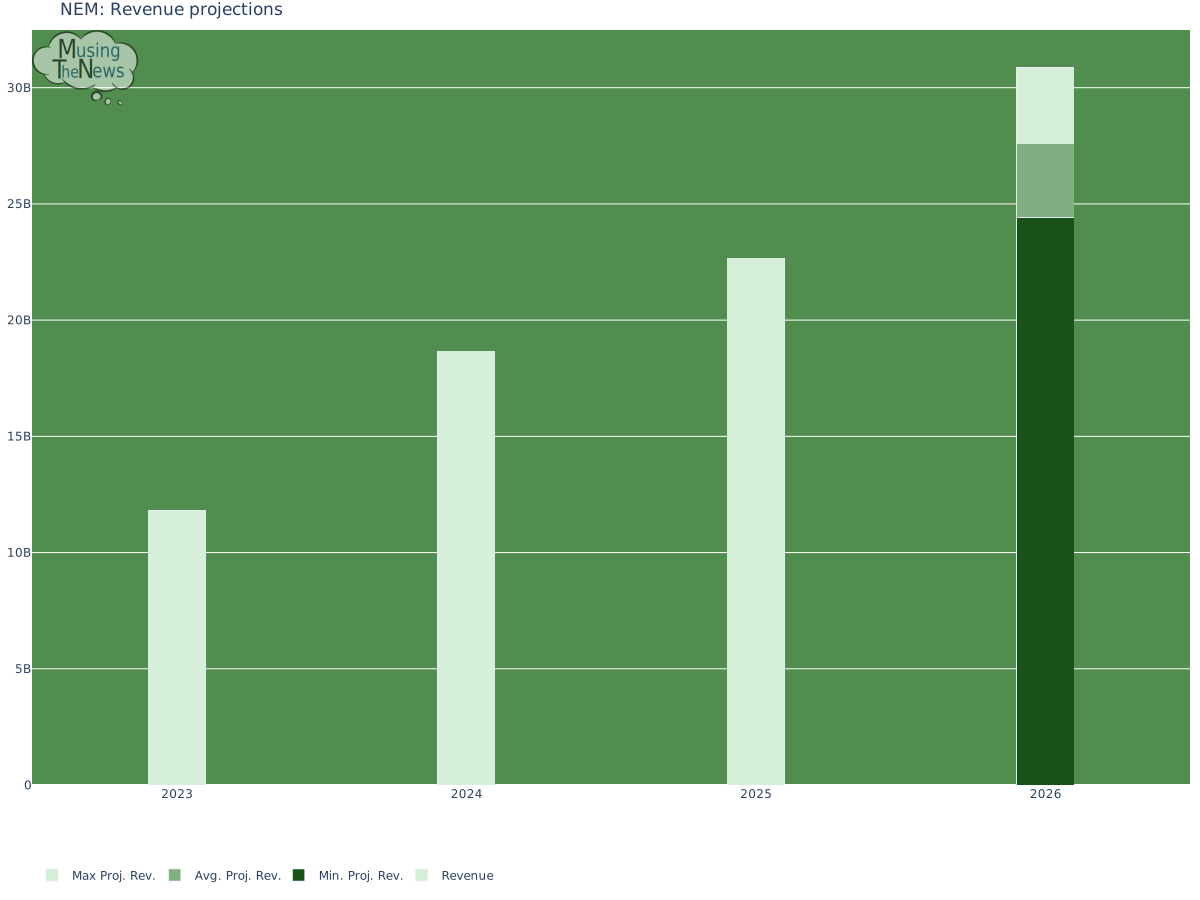
Revenue projections:
Financial Ratios:
| currentRatio | 2.546000 |
|---|---|
| forwardPE | 11.155209 |
| debtToEquity | 15.807000 |
| earningsGrowth | 0.114000 |
| revenueGrowth | 0.151000 |
| grossMargins | 0.680410 |
| operatingMargins | 0.515690 |
| trailingEps | 7.650000 |
| forwardEps | 10.000710 |
The current ratio for NEM is 2.546, indicating that the company can service its short-term debt using available cash and assets. This suggests NEM has strong liquidity, with more than enough resources to meet its immediate financial commitments.
With Newmont Corporation's Forward PE in a favorable range, the stock appears reasonably priced compared to its earnings. This suggests that it's not overpriced and there is room for growth, providing an encouraging opportunity for investors seeking future value increases.
Newmont Corporation's low Debt-to-Equity ratio demonstrates that the company maintains a healthy balance between equity and debt, avoiding over-leverage. This suggests a low-risk financial profile, giving investors confidence in the company's stability and ability to manage its financial commitments.
NEM's positive earnings and revenue growth signal the company's business is on track for further expansion. These strong financial trends suggest that NEM will continue to grow its operations, driven by increasing profits and revenue.
NEM's positive gross and operating margins suggest the company is performing profitably. These margins reflect efficient cost management and strong revenue generation, signaling healthy financial performance and operational effectiveness.
Newmont Corporation's forward EPS is higher than its trailing EPS, which signals that the company is expected to achieve greater profitability this financial year. This suggests improved earnings performance, indicating a positive outlook for Newmont Corporation's financial growth.
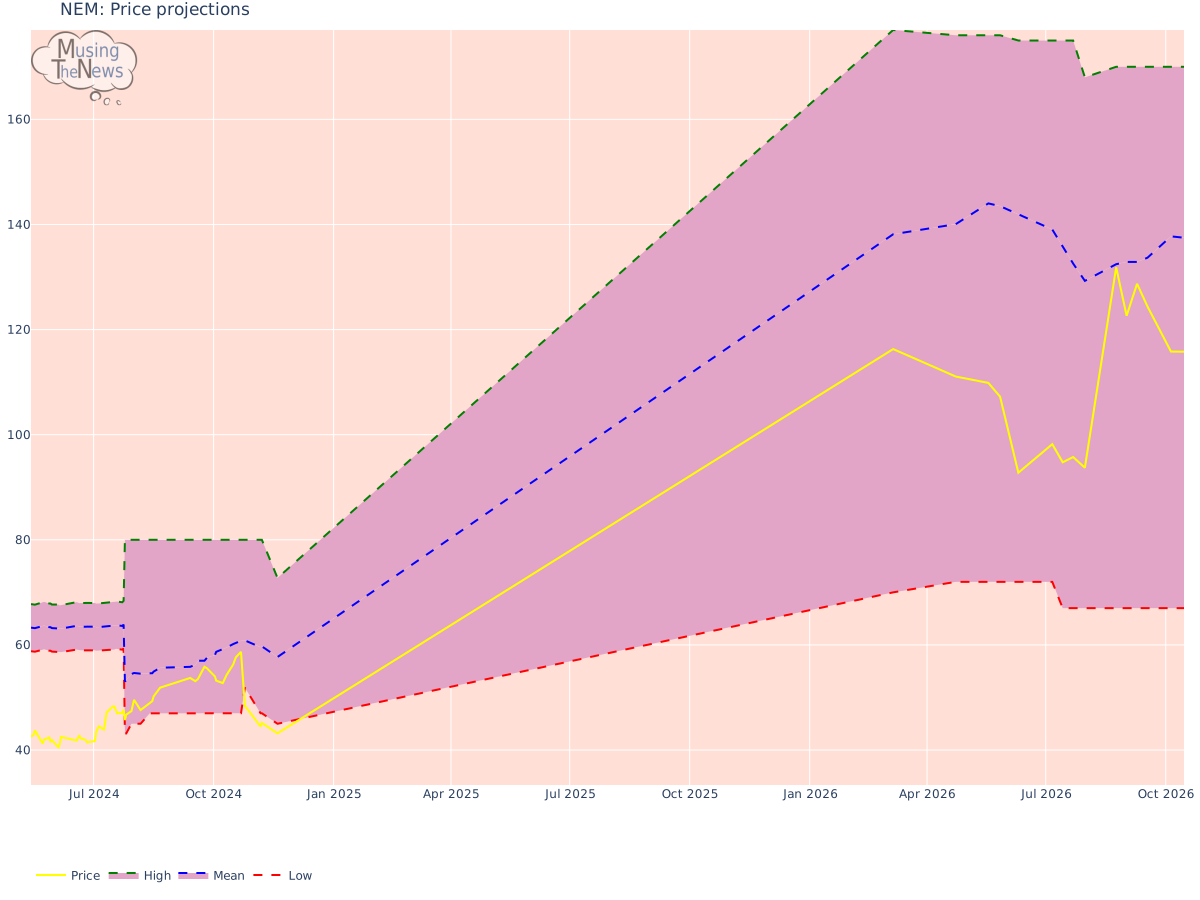
Price projections:
Insider Transactions:
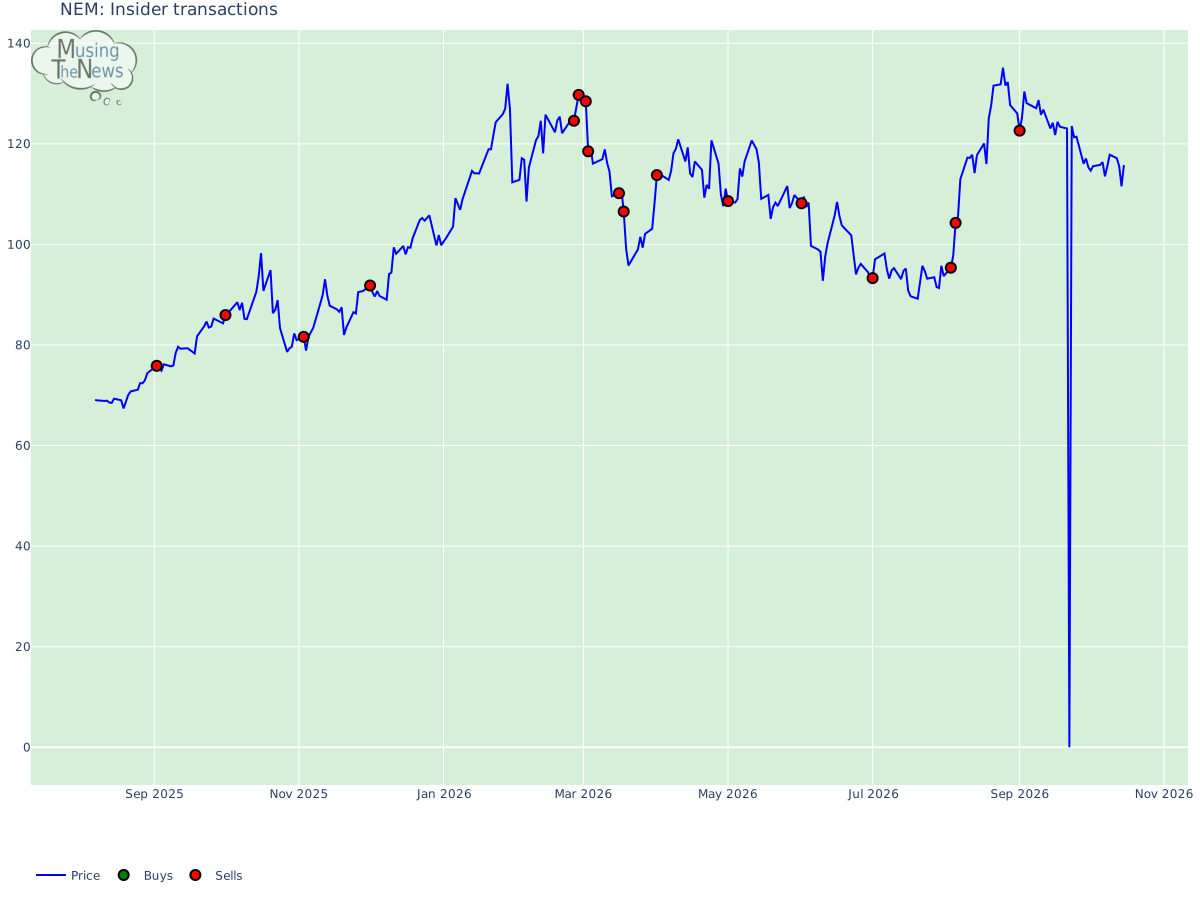
Recent trading of NEM stock saw 17 sales, with market price at 105.85325263528263 per share.Throughout the period under consideration, no sell transactions were recorded.Newmont Corporation has seen more buys than sells at its current price levels, which may suggest optimism among investors. This buying trend could indicate that the market expects a favorable performance for the stock in the near future.
Recommendation changes over time:
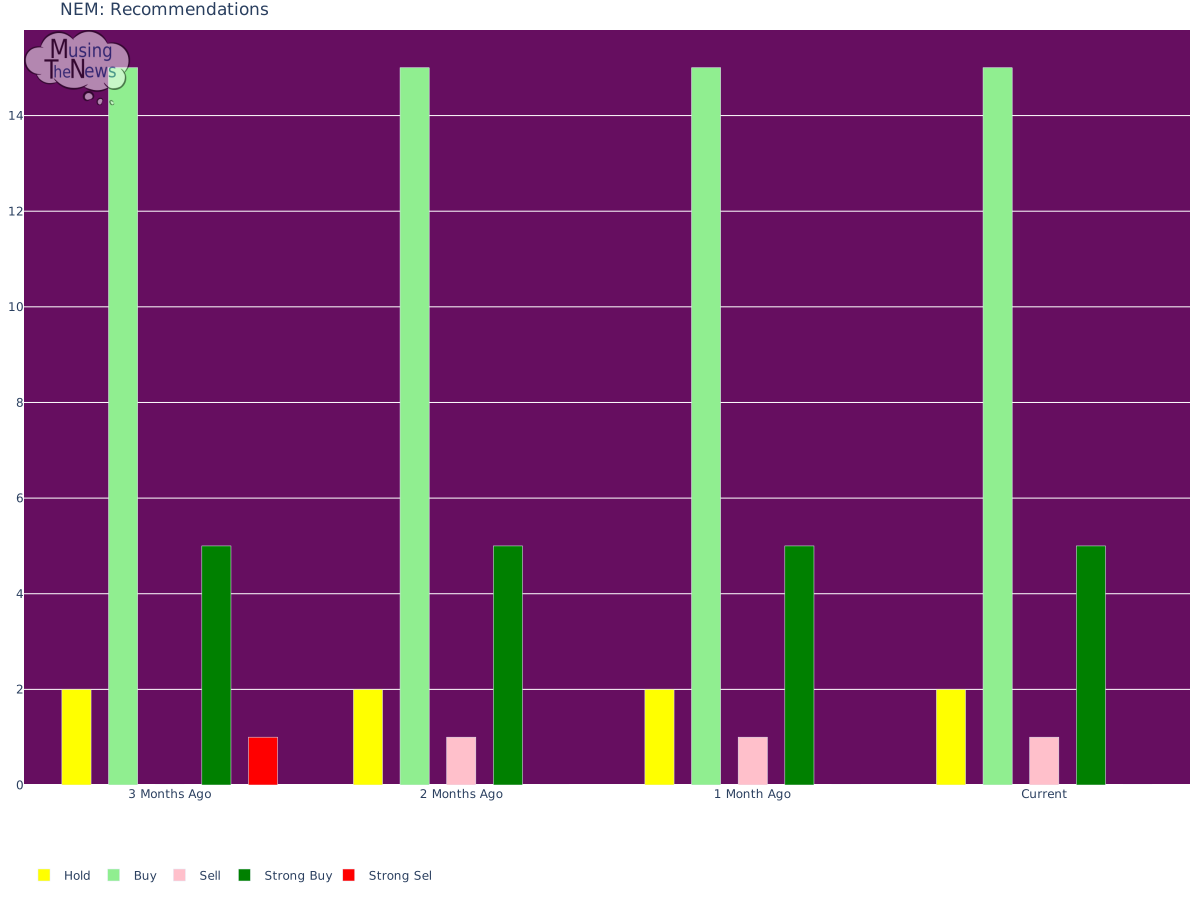
Analysts have shown a buy bias for NEM, signaling it as a strong investment choice. This positive outlook could motivate investors to allocate funds to NEM, seeing it as a reliable and potentially profitable option, especially in an environment where the stock market is highly scrutinized.