The AROON is currently neutral, showing no clear bias toward a rising or falling trend. This lack of directional clarity suggests that the market may be in a holding patter...
By MusingTheNews
Updated 2026-10-20 23:24:45
Overall Technical outlook
Price Summary
Alliant Energy Corporation's stock opened at 68.18 on 2026-10-19, surged to a high of 68.23, hit a low of 66.57, and closed up -1.95% at 66.85, with 2531800 shares traded. The highest price the stock achieved in the past 52 weeks is 78.03, while the lowest price it saw is 0.0.
Technicals
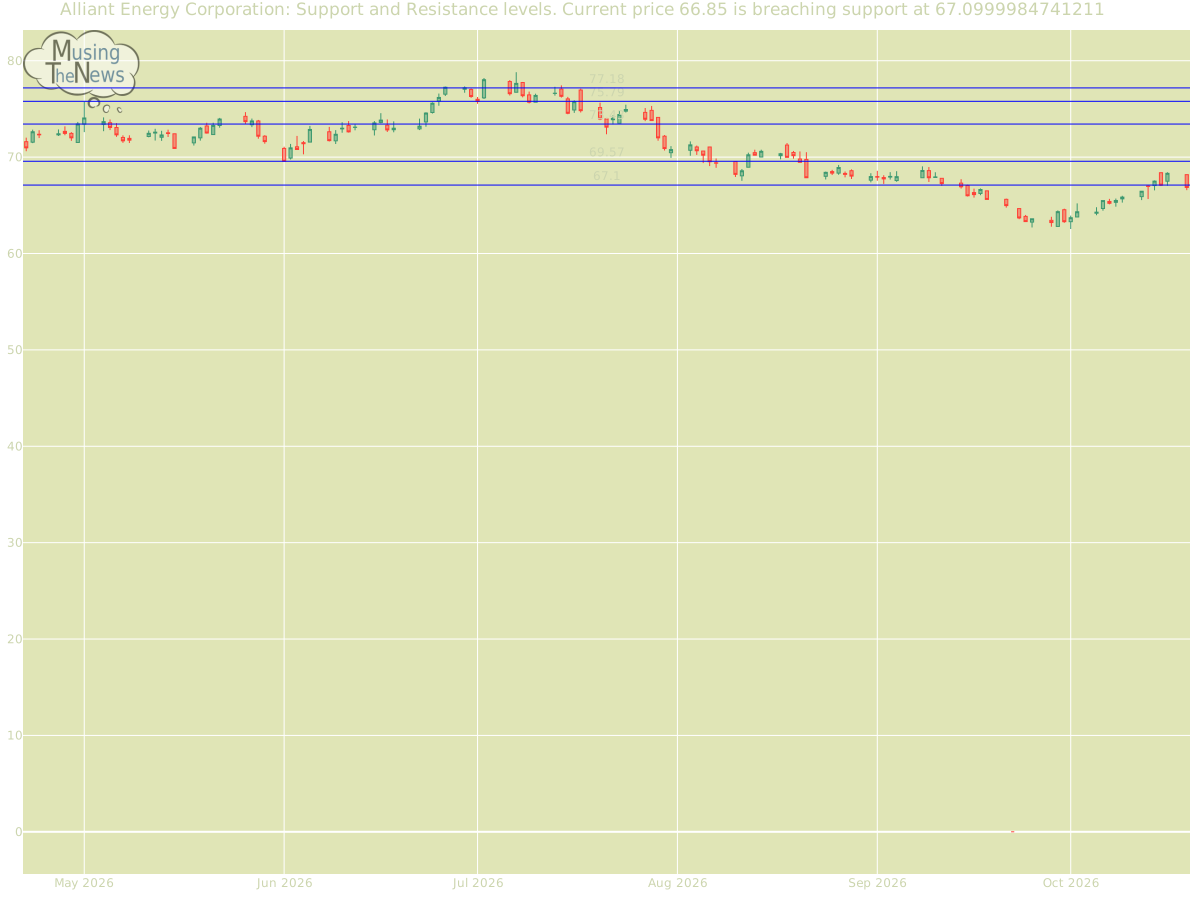
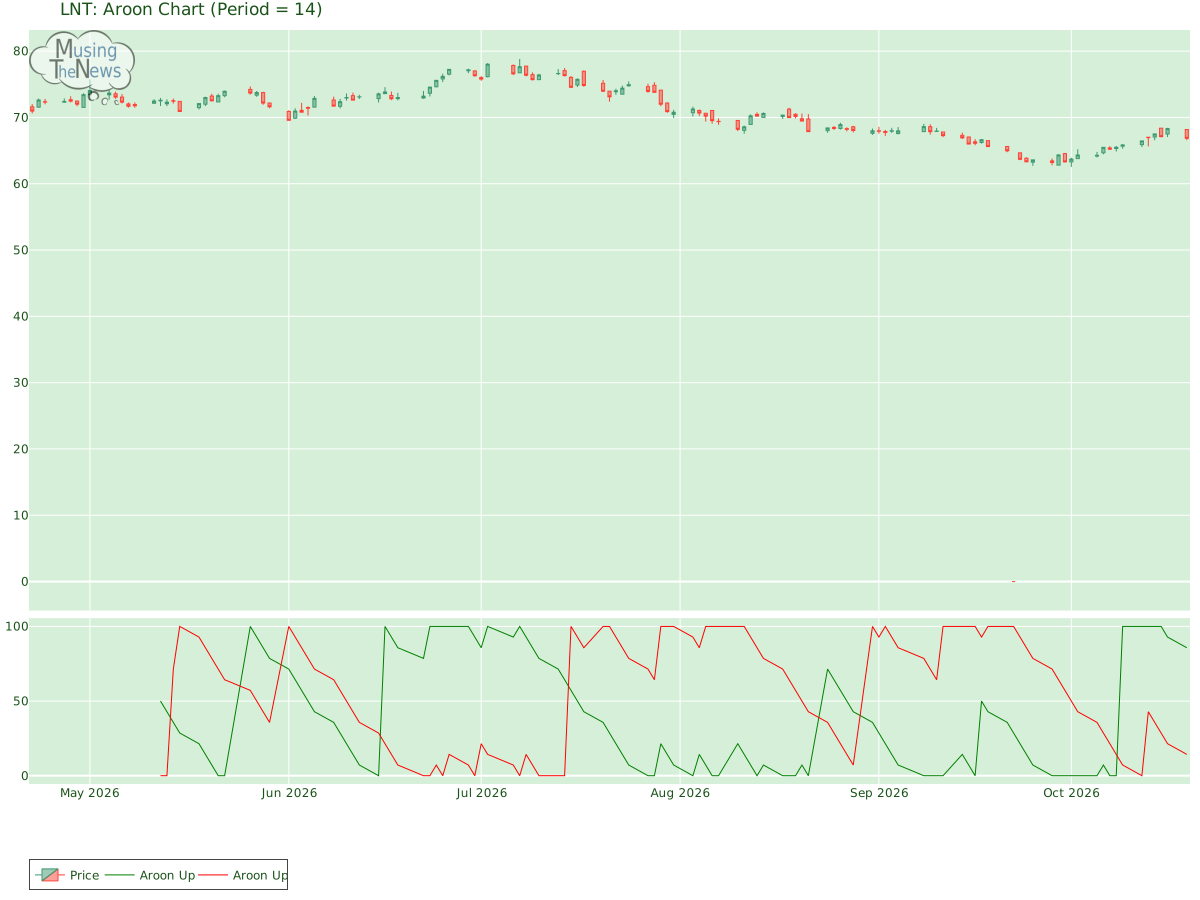
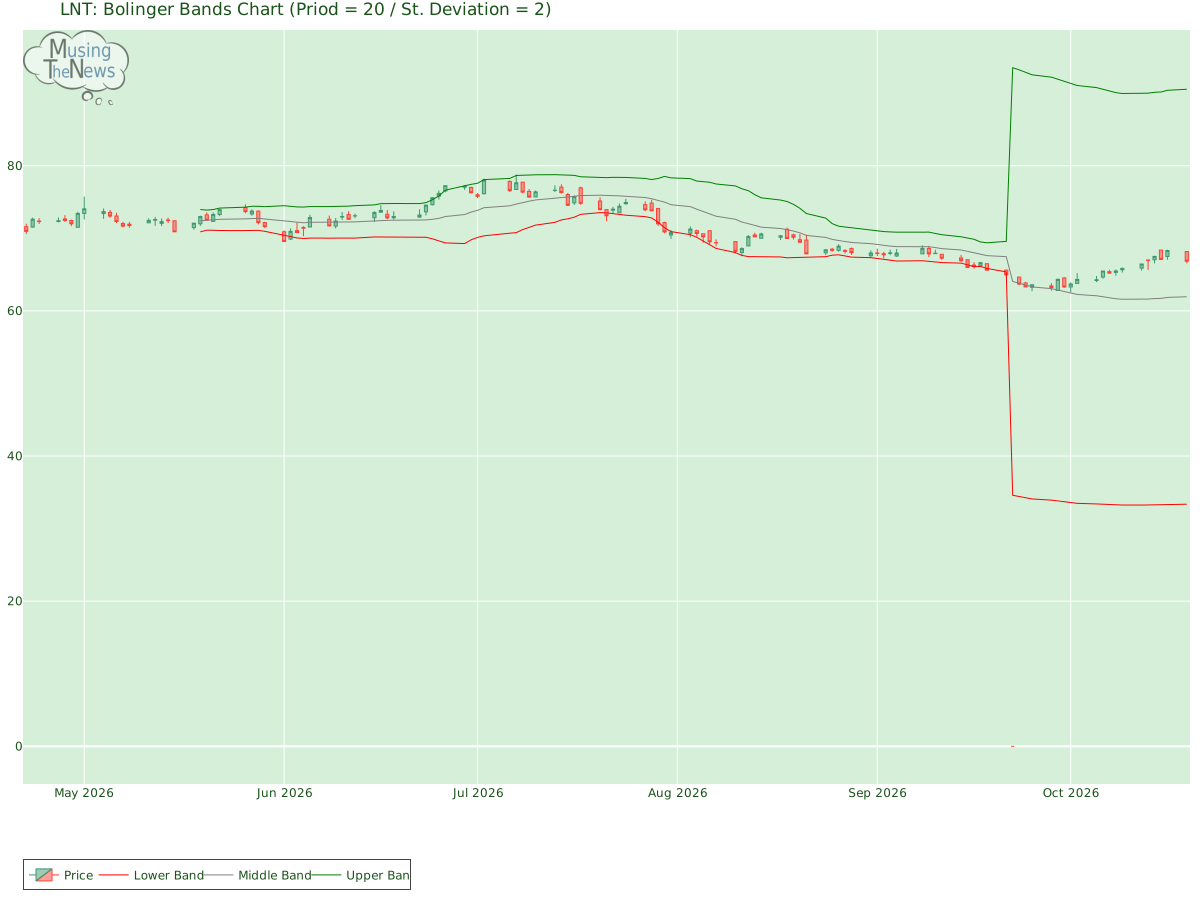
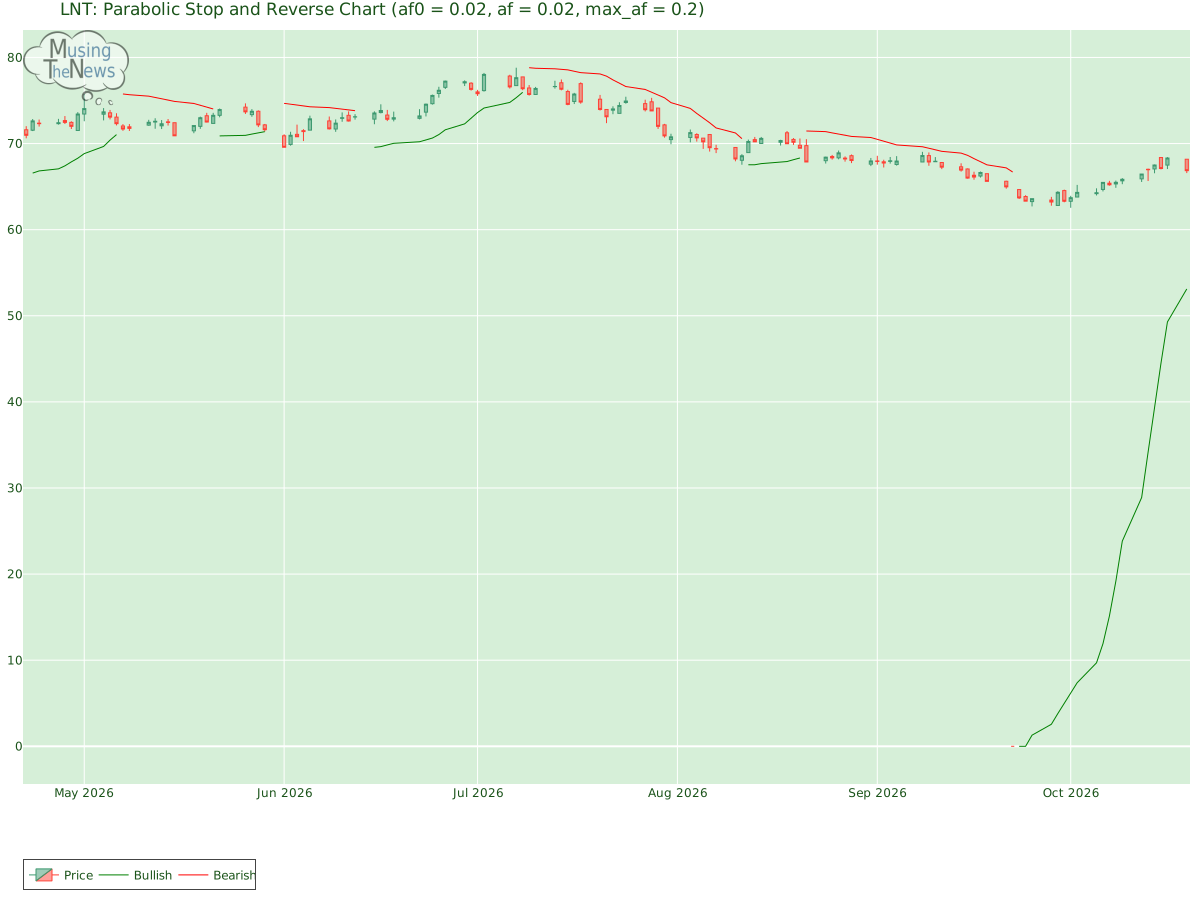
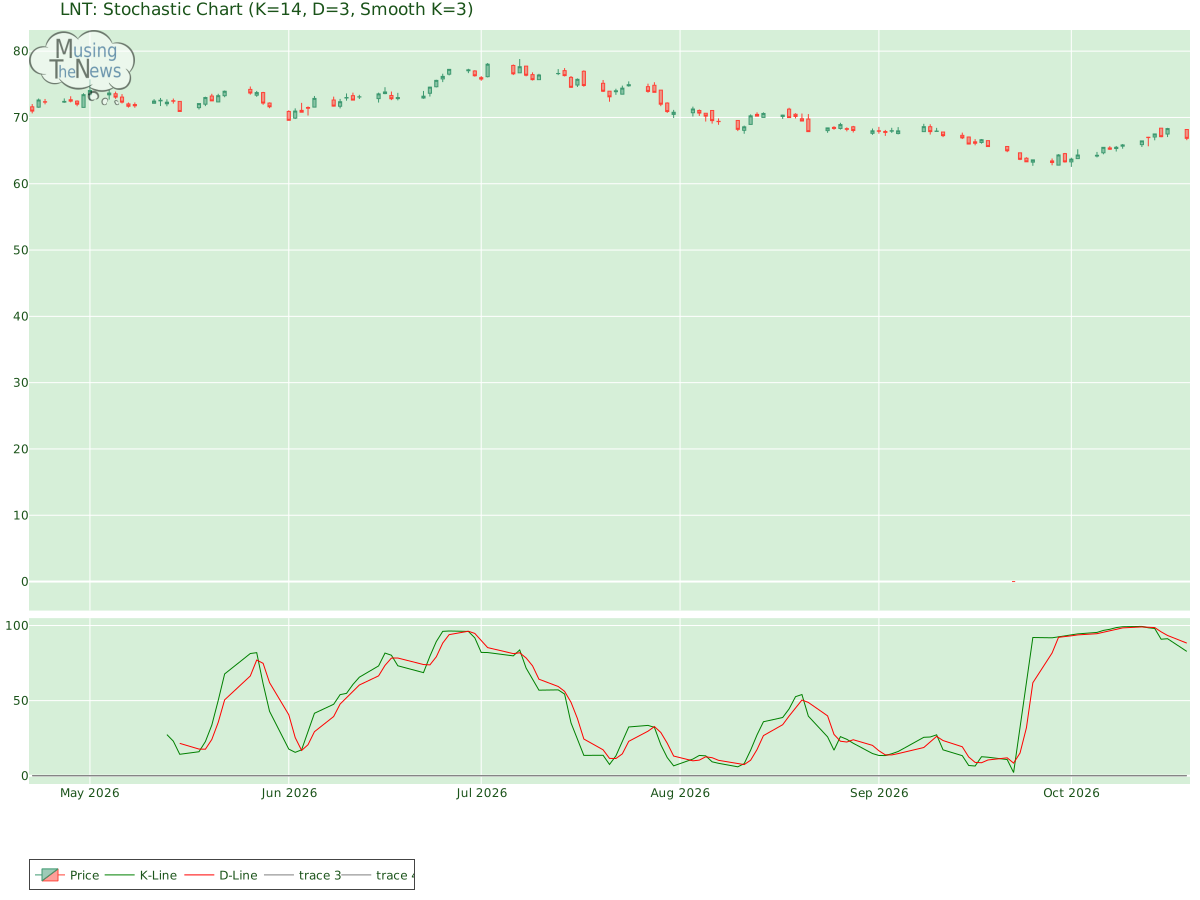
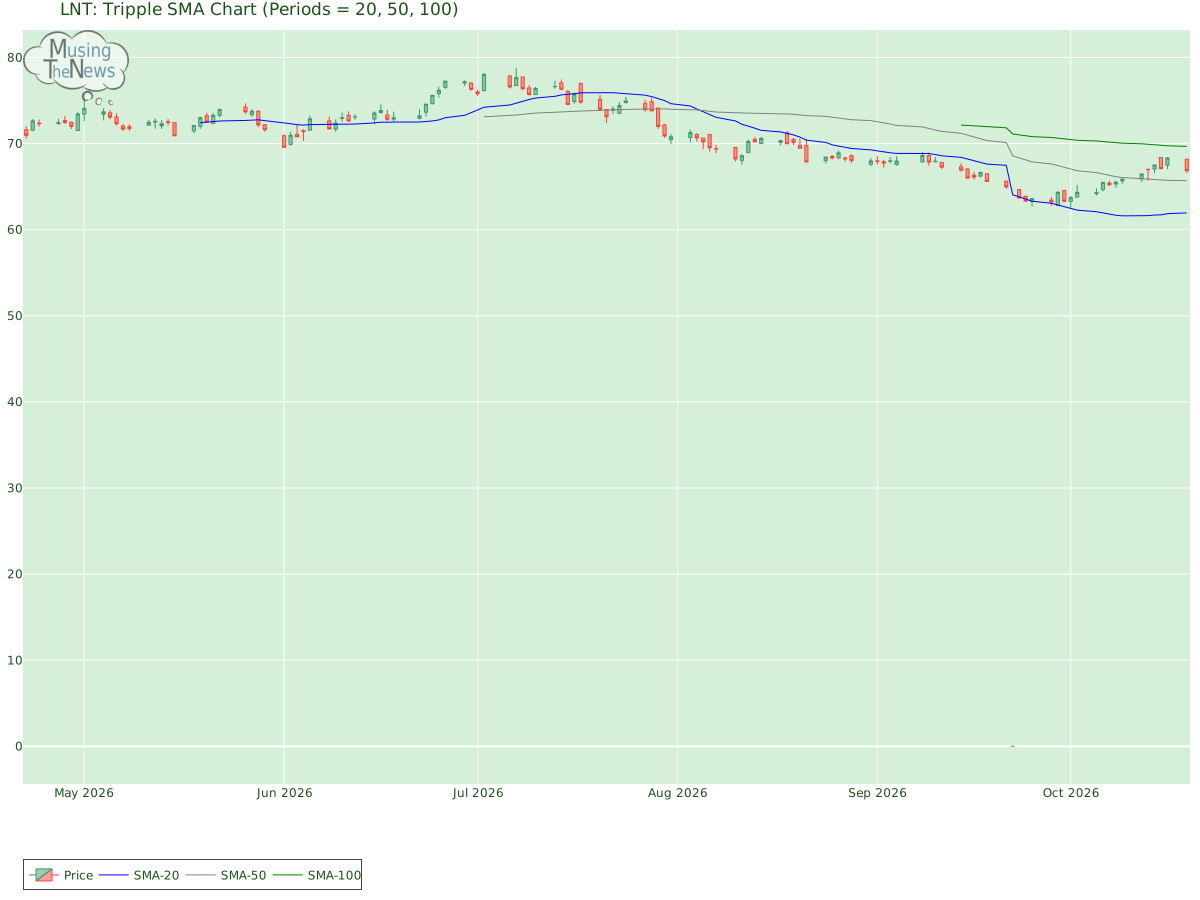
Support and Resistance: The current price sits at 66.85, supported at 67.1 and capped by resistance at 67.1. These levels define a range for LNT where the price might stabilize, with 67.1 as a floor and 67.1 as a ceiling.Support/Resistance for LNTAroon: The AROON is currently neutral, showing no clear bias toward a rising or falling trend. This lack of directional clarity suggests that the market may be in a holding pattern, awaiting further developments.Aroon chart for Alliant Energy CorporationBol. Bands: The BOLL BANDS is in a neutral stance, with no clear direction indicated for the market. This lack of clarity suggests that the market may be in a state of equilibrium for LNT, with no strong trend emerging.Bolinger Bands chart for Alliant Energy CorporationParabolic SAR: The PSAR for LNT continues to signal a bullish outlook, establishing a crucial support level that may help sustain the current upward momentum. This level of support suggests that the market is likely to continue trending higher, providing a foundation for ongoing bullish movement.Parabolic Stop and Reverse chart for Alliant Energy CorporationStochastic: The stochastic indicator shows the K-line below the D-line and above 80, pointing to the potential onset of a bearish price move. This setup could indicate that the market's recent gains are starting to reverse, possibly leading to a downturn. Traders should monitor this closely for further bearish signals.Stochastic chart for Alliant Energy CorporationTripple Moving Agerage: The Tripple MOVING AVG is showing a neutral reading, with no clear direction indicated for upward or downward movement. This neutral position suggests a possible period of consolidation.Tripple SMA chart for Alliant Energy Corporation Understanding a company's fundamentals—such as revenue, earnings, and debt levels—provides a solid foundation for analyzing its technical performance. Similarly, knowledge of the industry, including key competitors and market trends, is critical. Combining this fundamental analysis with technical indicators like stock charts, moving averages, and trading volume enables a more comprehensive approach to evaluating the company's overall health and potential future performance.