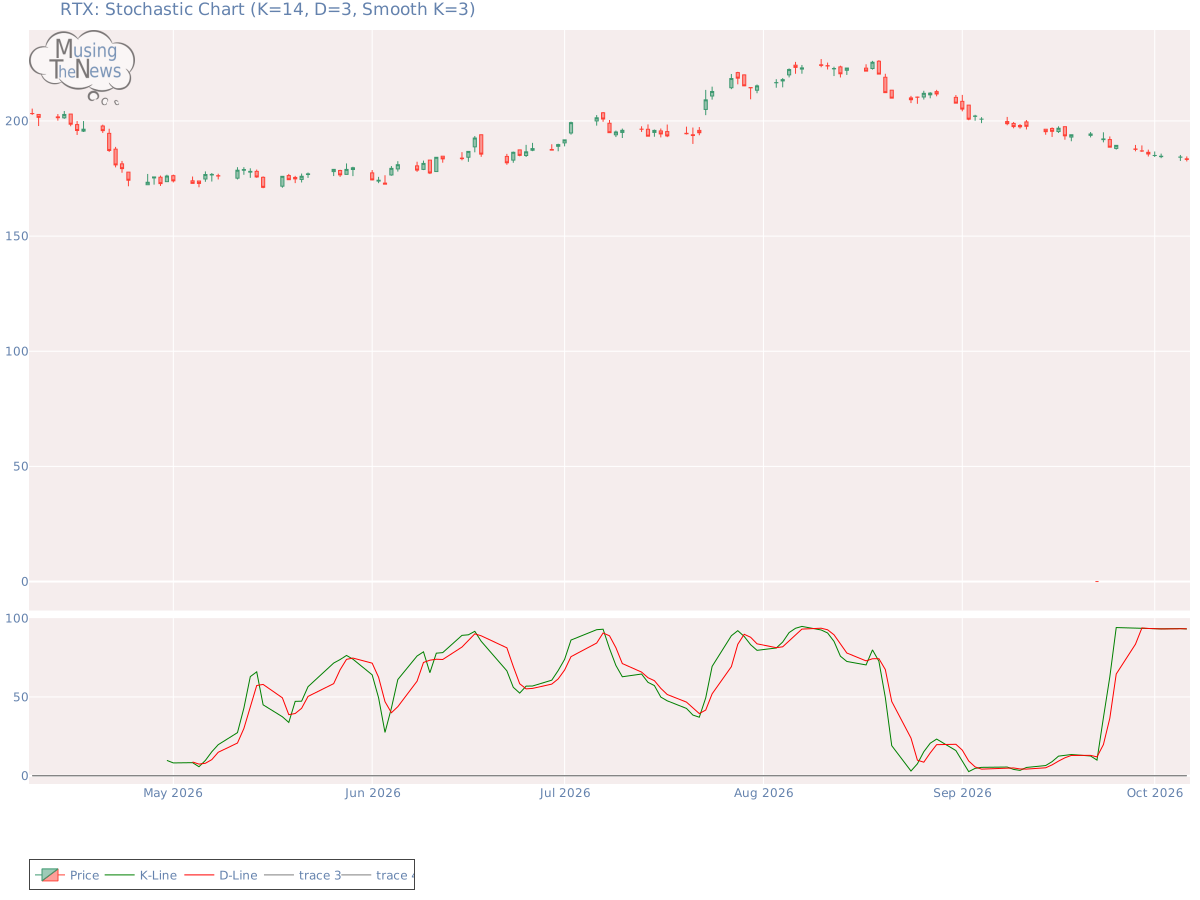
The K-line has moved below the D-line on the stochastic indicator, yet it remains above 80, signaling the potential beginning of a bearish price move for RTX. This pattern ...
By MusingTheNews
Updated 2026-10-07 23:26:49
Overall Technical outlook
Price Summary
RTX Corporation's stock opened at 183.55 on 2026-10-06, surged to a high of 184.6, hit a low of 182.41, and closed up -0.14% at 183.29, with 4250000 shares traded. Over the past 52 weeks, the stock reached a maximum price of 225.49 and a minimum price of 0.0.
Technicals
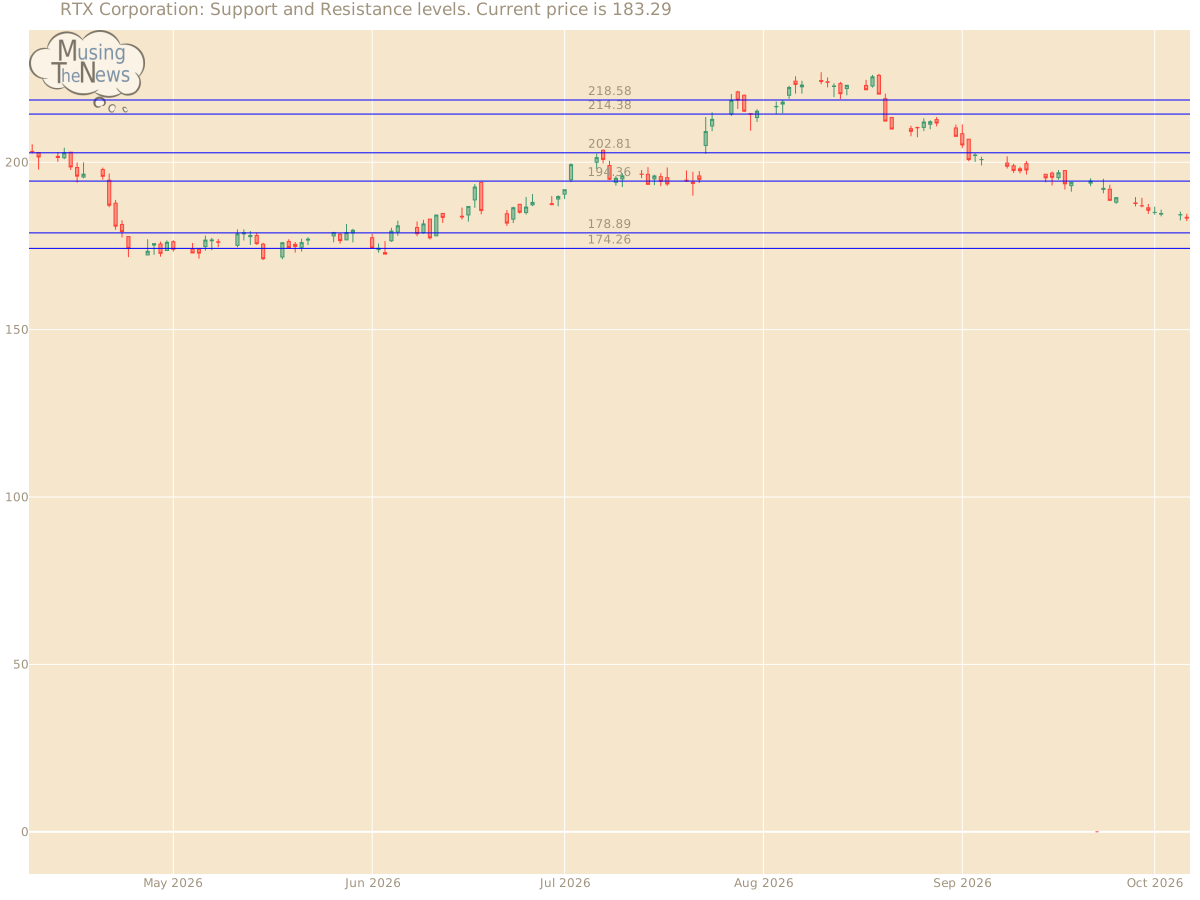
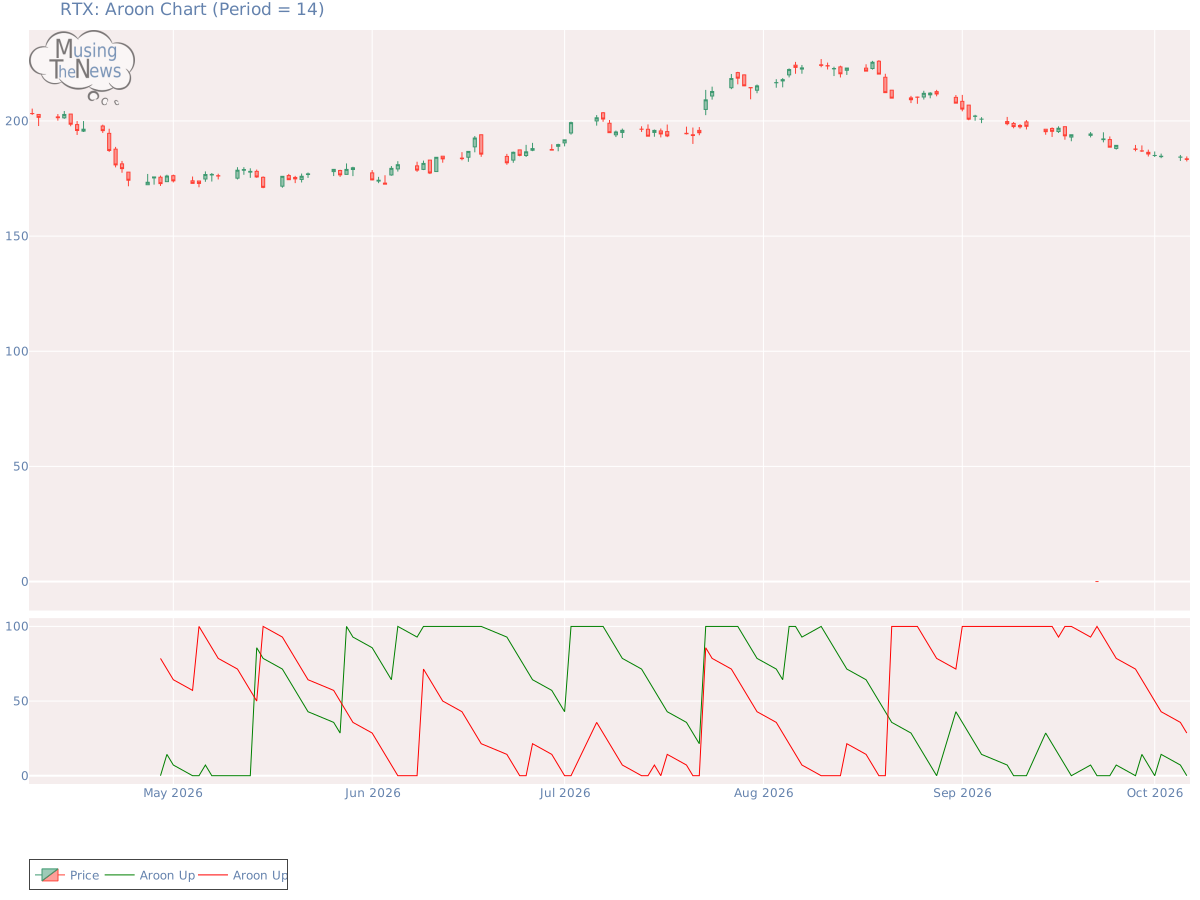
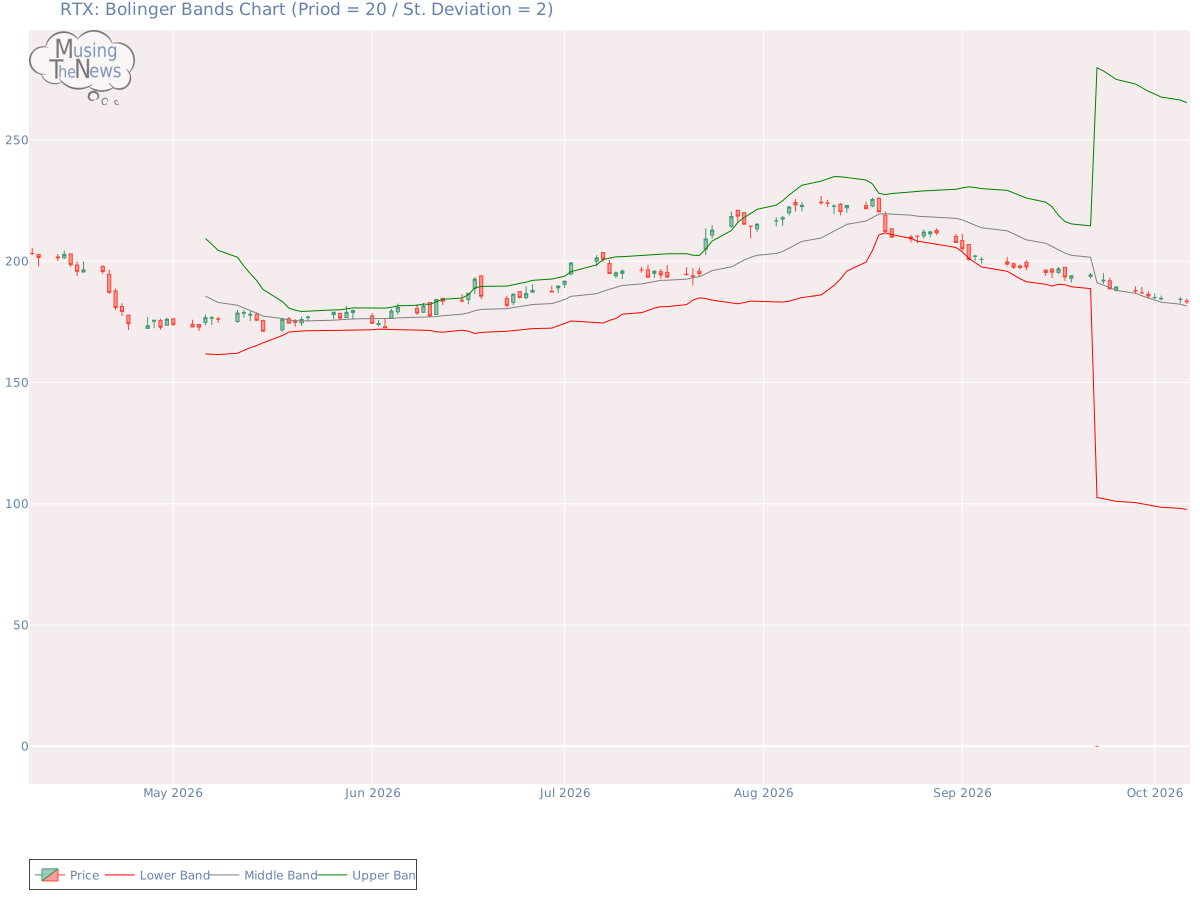
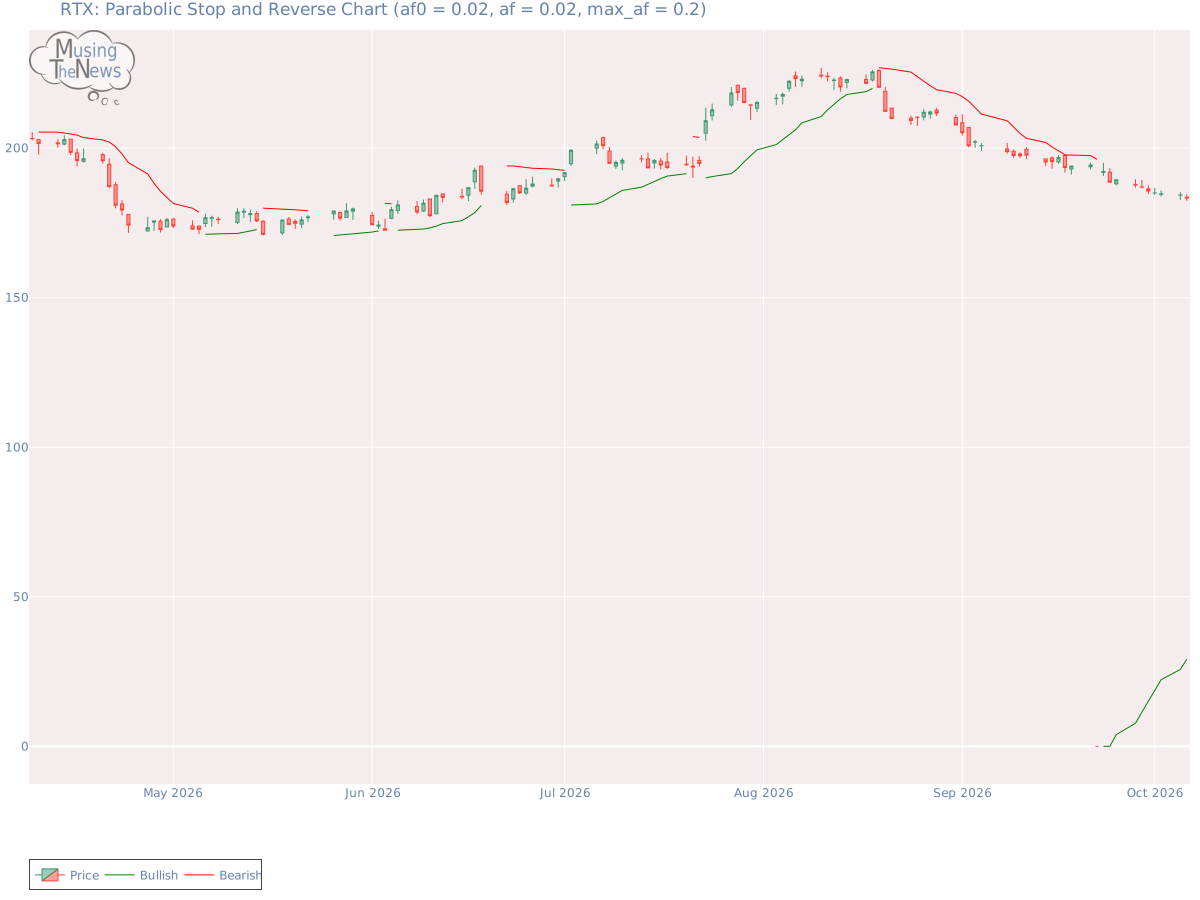
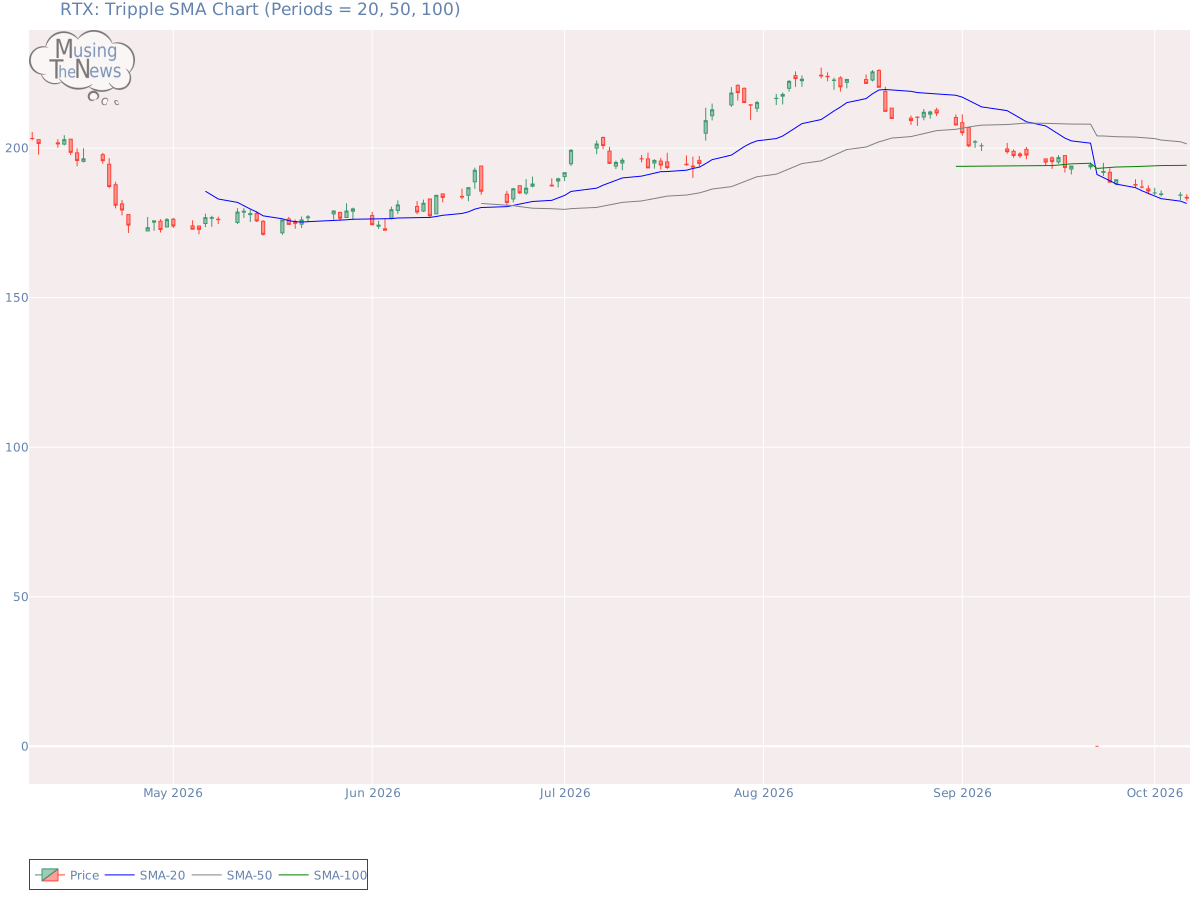
Support and Resistance: The price of 183.29 is supported at 178.89 and encounters resistance at 194.36. This suggests key levels where the price might find stability, with 178.89 providing a base and 194.36 acting as an upper boundary for RTX.Support/Resistance for RTXAroon: The AROON is showing a neutral stance, with no definitive indication of an upward or downward trend for RTX. This neutral position suggests a period of indecision in the market, making it difficult to predict the next move.Aroon chart for RTX CorporationBol. Bands: The BOLL BANDS is currently neutral, showing no clear bias toward a rising or falling trend. This lack of directional clarity suggests that the market may be in a holding pattern, awaiting further developments.Bolinger Bands chart for RTX CorporationParabolic SAR: The PSAR remains bullish in its outlook, establishing a key support level that could serve as a foundation for further upward movement. This persistent bullish stance suggests that the market may continue to trend higher, with the established support providing a potential safety net for investors.Parabolic Stop and Reverse chart for RTX CorporationStochastic: The K-line has moved below the D-line on the stochastic indicator, yet it remains above 80, signaling the potential beginning of a bearish price move for RTX. This pattern may indicate that the market's upward momentum is starting to wane, possibly leading to a downturn. Investors should watch for further confirmation.Stochastic chart for RTX CorporationTripple Moving Agerage: The Tripple MOVING AVG is currently neutral, showing no clear bias toward an upward or downward trend. This suggests that the market may be in a phase of indecision or consolidation.Tripple SMA chart for RTX Corporation In order to draw meaningful inferences from a company's technical data, it is essential to first consider its fundamentals. This includes reviewing financial metrics like revenue, profit margins, and debt-to-equity ratios. Additionally, understanding the broader industry landscape, including market trends and competitive pressures, is crucial. By integrating these insights with the company's technical performance, such as stock price fluctuations and trading volume, one can make more informed investment decisions.