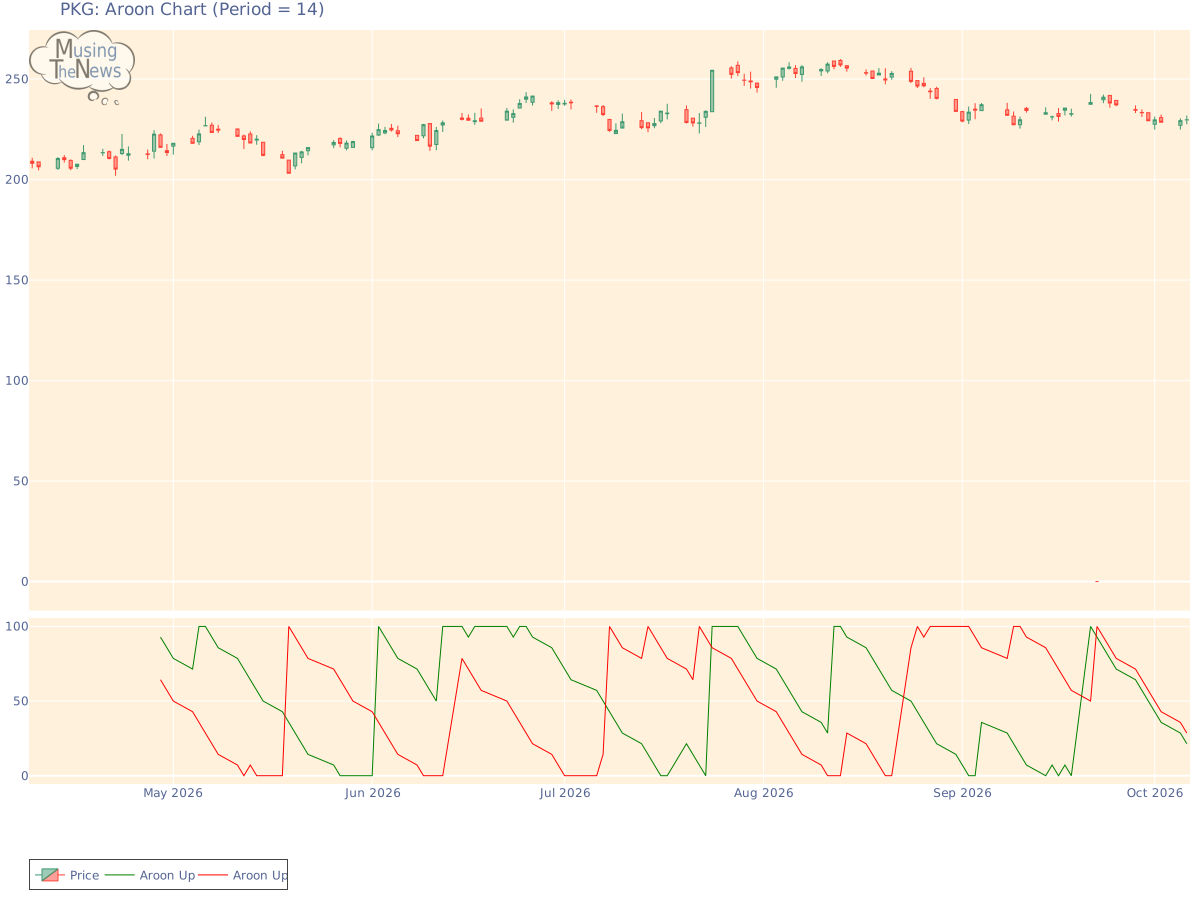
The AROON is showing a neutral reading, with no clear direction indicated for upward or downward movement. This neutral position suggests a possible period of consolidation...
By MusingTheNews
Updated 2026-10-07 23:26:44
Overall Technical outlook
Price Summary
On 2026-10-06, Packaging Corporation of America's shares started at 229.71, peaked at 231.9, bottomed out at 227.52, and ended 0.01% higher at 229.74, with 397400 shares traded. The top price for the stock in the last 52 weeks is 257.43, with the bottom price being 0.0.
Technicals
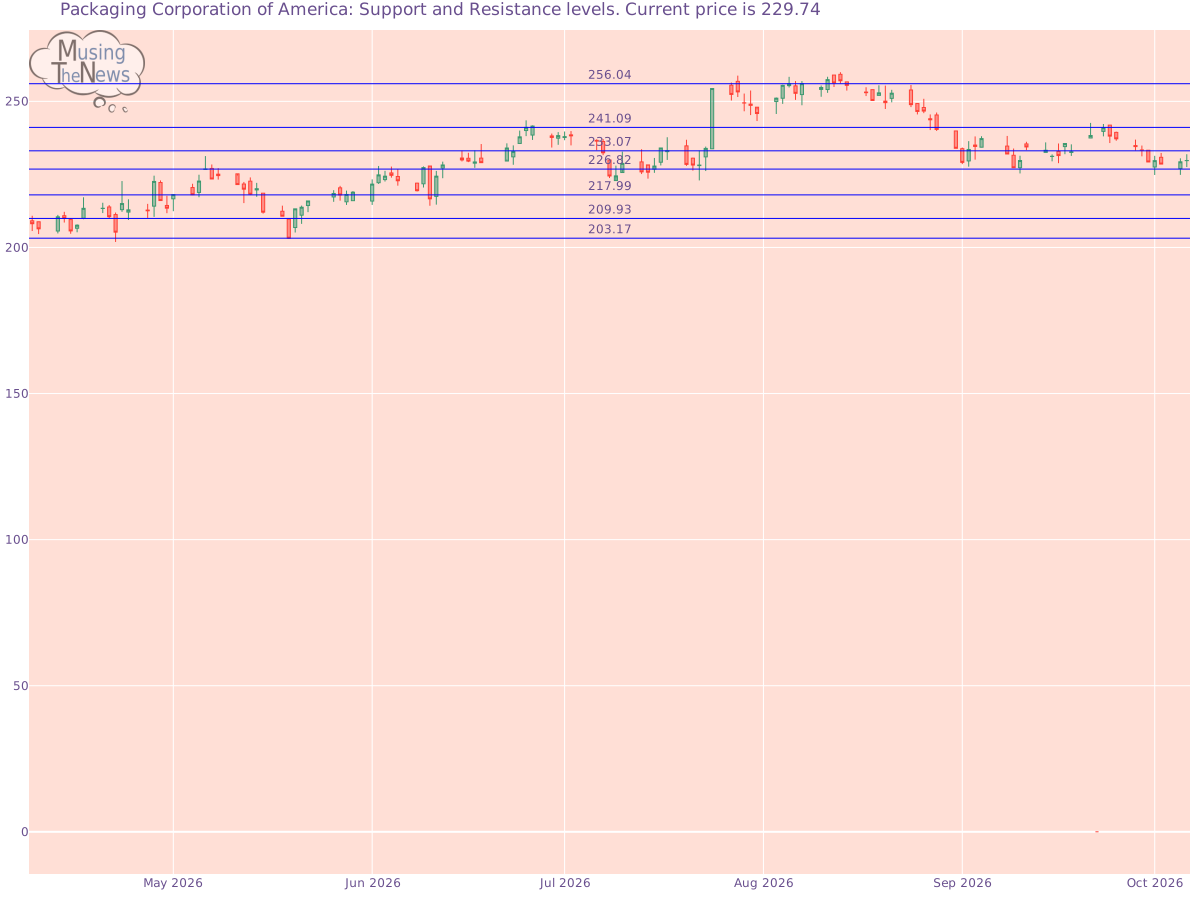
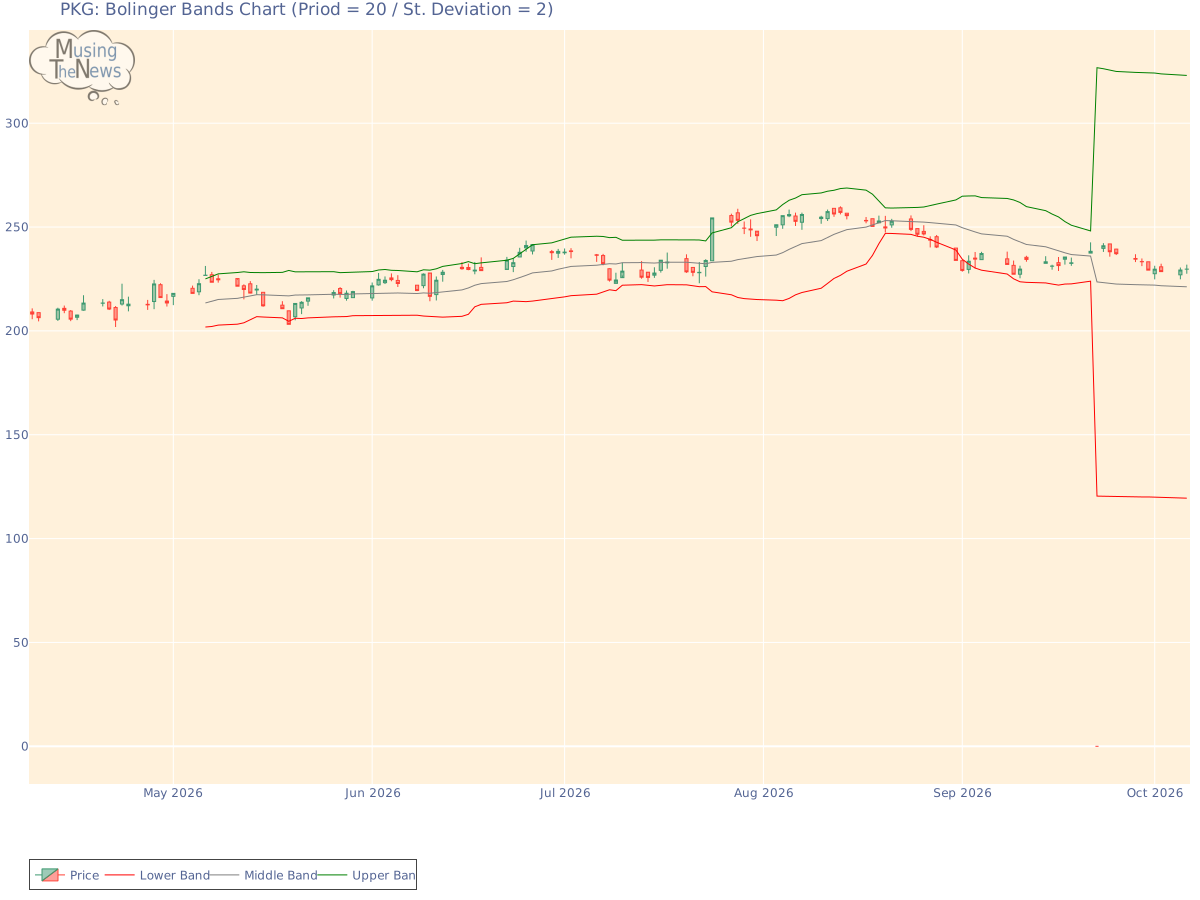
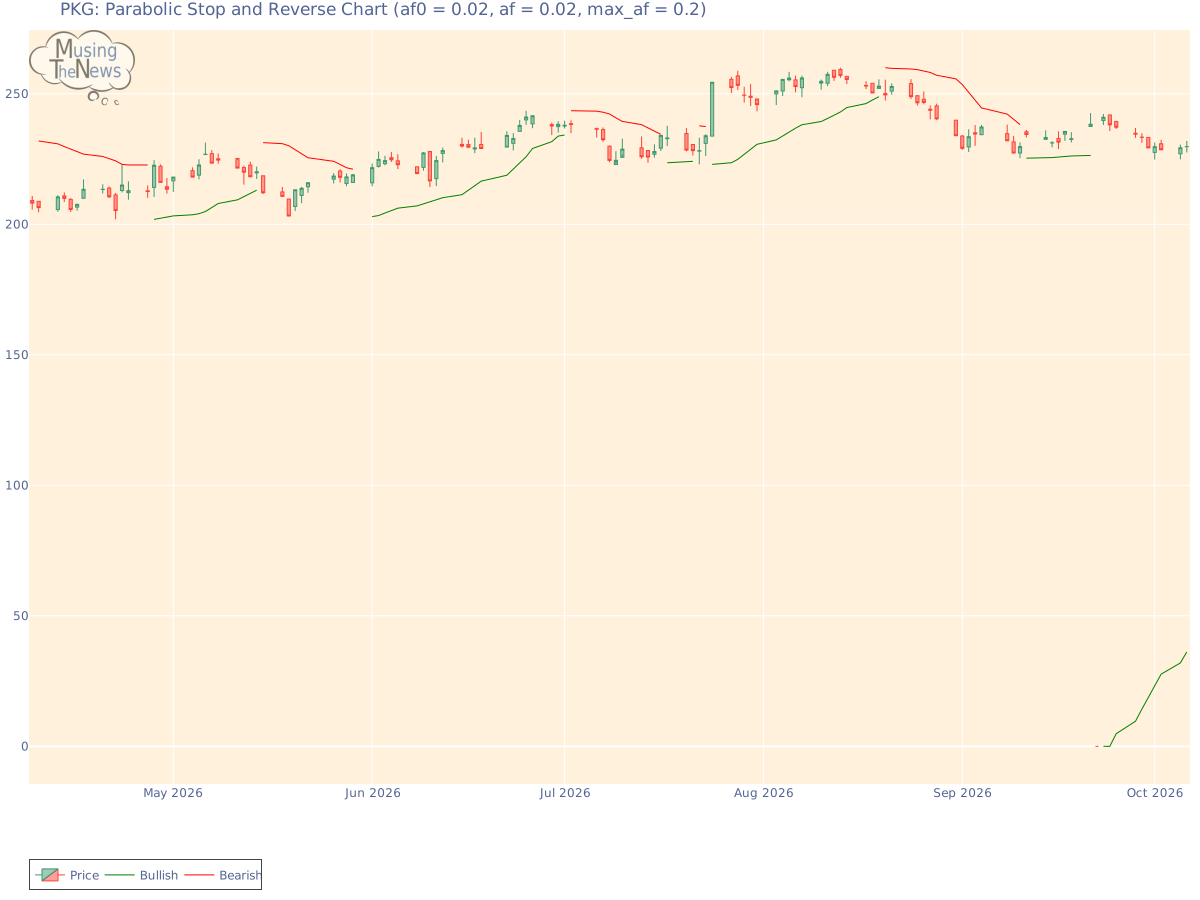
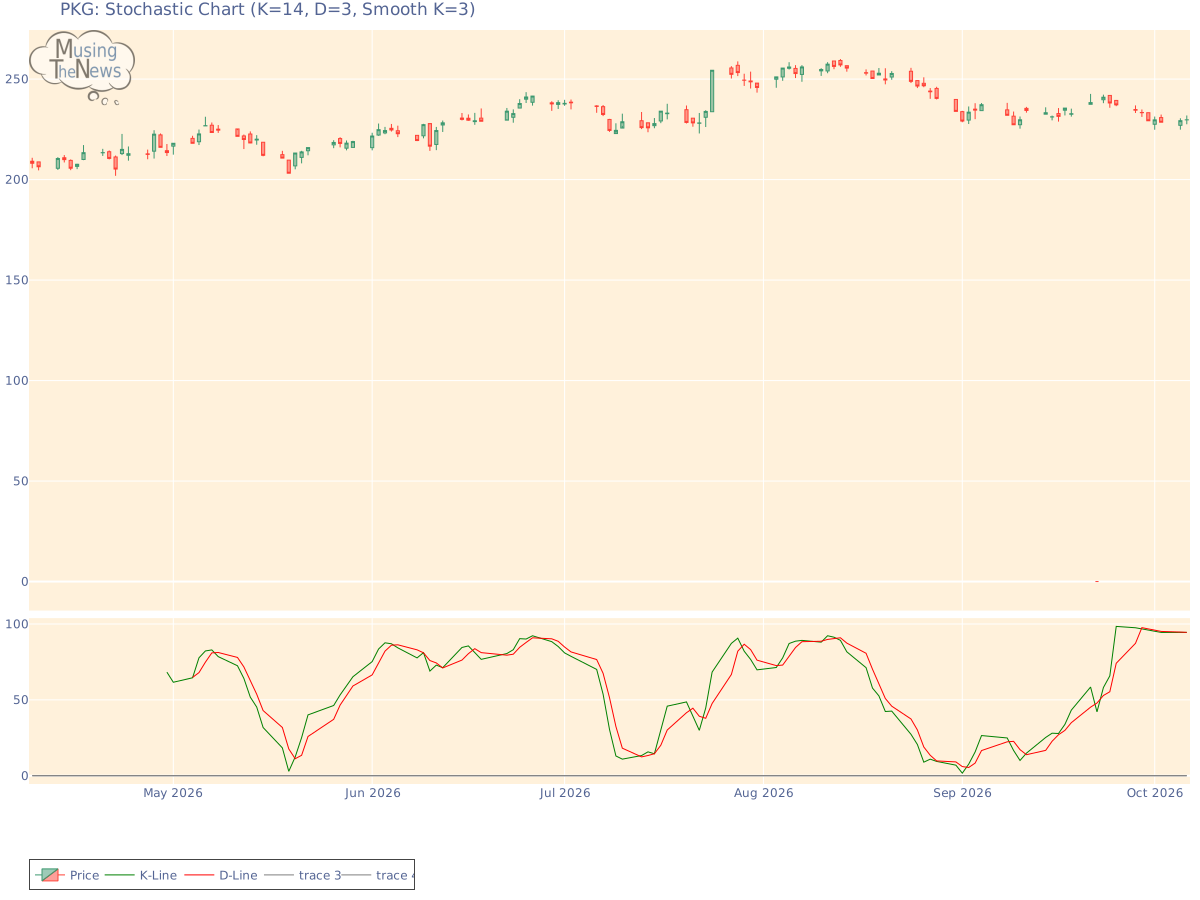
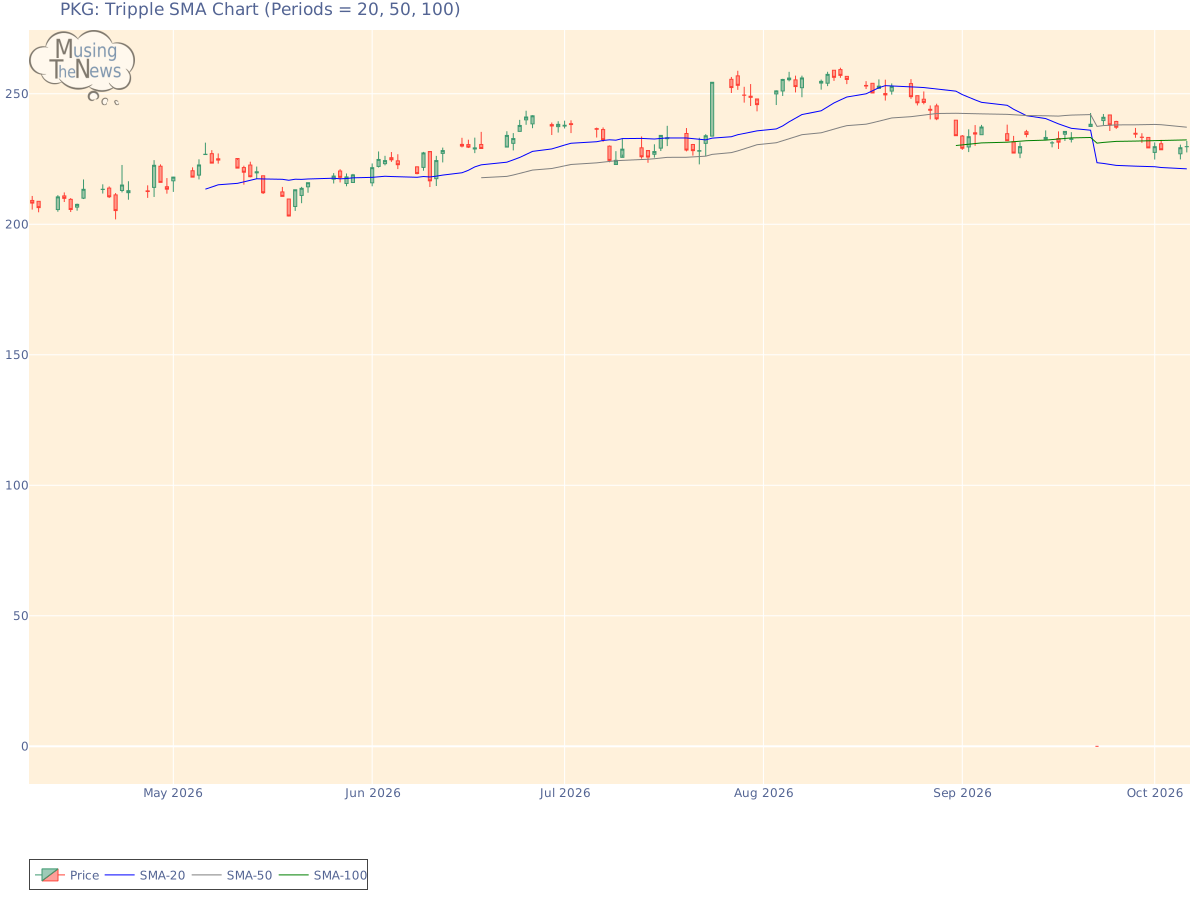
Support and Resistance: At 229.74, the price is supported by 226.82 and resisted by 233.07. This indicates that the price for Packaging Corporation of America might fluctuate between these levels, with 226.82 acting as a support and 233.07 limiting further upward movement.Support/Resistance for PKGAroon: The AROON is showing a neutral reading, with no clear direction indicated for upward or downward movement. This neutral position suggests a possible period of consolidation.Aroon chart for Packaging Corporation of AmericaBol. Bands: The BOLL BANDS is in a neutral stance for PKG, not indicating a clear upward or downward trend. This suggests a period of market indecision, where neither bulls nor bears have the upper hand.Bolinger Bands chart for Packaging Corporation of AmericaParabolic SAR: The PSAR remains bullish in its outlook, reinforcing a key support level that could help sustain the market's upward movement for PKG. This support suggests that the bullish momentum is likely to persist, offering a foundation for further growth.Parabolic Stop and Reverse chart for Packaging Corporation of AmericaStochastic: The stochastic indicator is in a bullish mode, with the K-line crossing above the D-line and the 80 level for PKG. This alignment suggests strong upward momentum, indicating that the market may continue to trend higher. Investors could interpret this as a positive sign of sustained market growth.Stochastic chart for Packaging Corporation of AmericaTripple Moving Agerage: The current reading of the Tripple MOVING AVG is neutral, offering no clear signals for a movement in either direction. This suggests that the market may be in a holding pattern, with no dominant trend in place.Tripple SMA chart for Packaging Corporation of America When analyzing a company, its fundamentals—such as earnings, management efficiency, and strategic initiatives—must be considered alongside technical data. The context of the industry in which the company operates also plays a key role, as market trends and competitive dynamics can significantly impact performance. By taking a comprehensive approach, combining both fundamental and technical analysis, one can gain a deeper understanding of the company's potential for growth or risk.