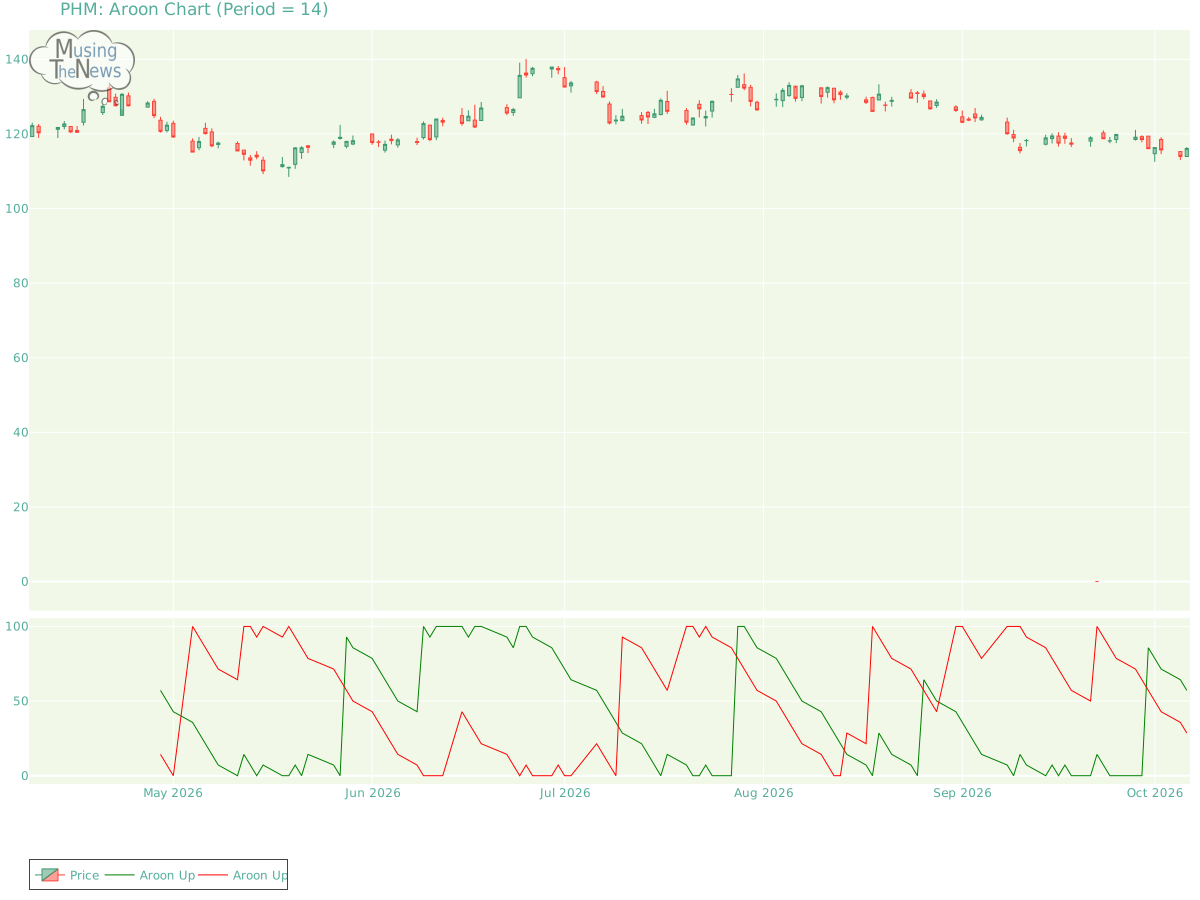
The current state of the AROON is neutral, offering no clear signals of movement in either direction. This suggests a potential pause in market activity, with no strong tre...
By MusingTheNews
Updated 2026-10-07 23:26:48
Overall Technical outlook
Price Summary
On 2026-10-06, PulteGroup, Inc.'s stock began at 113.97, peaked at 116.49, bottomed at 113.97, and closed 1.87% higher at 116.1, with a volume of 1504700 shares. During the 52-week span, the stock hit a high of 142.56 and a low of 0.0.
Technicals
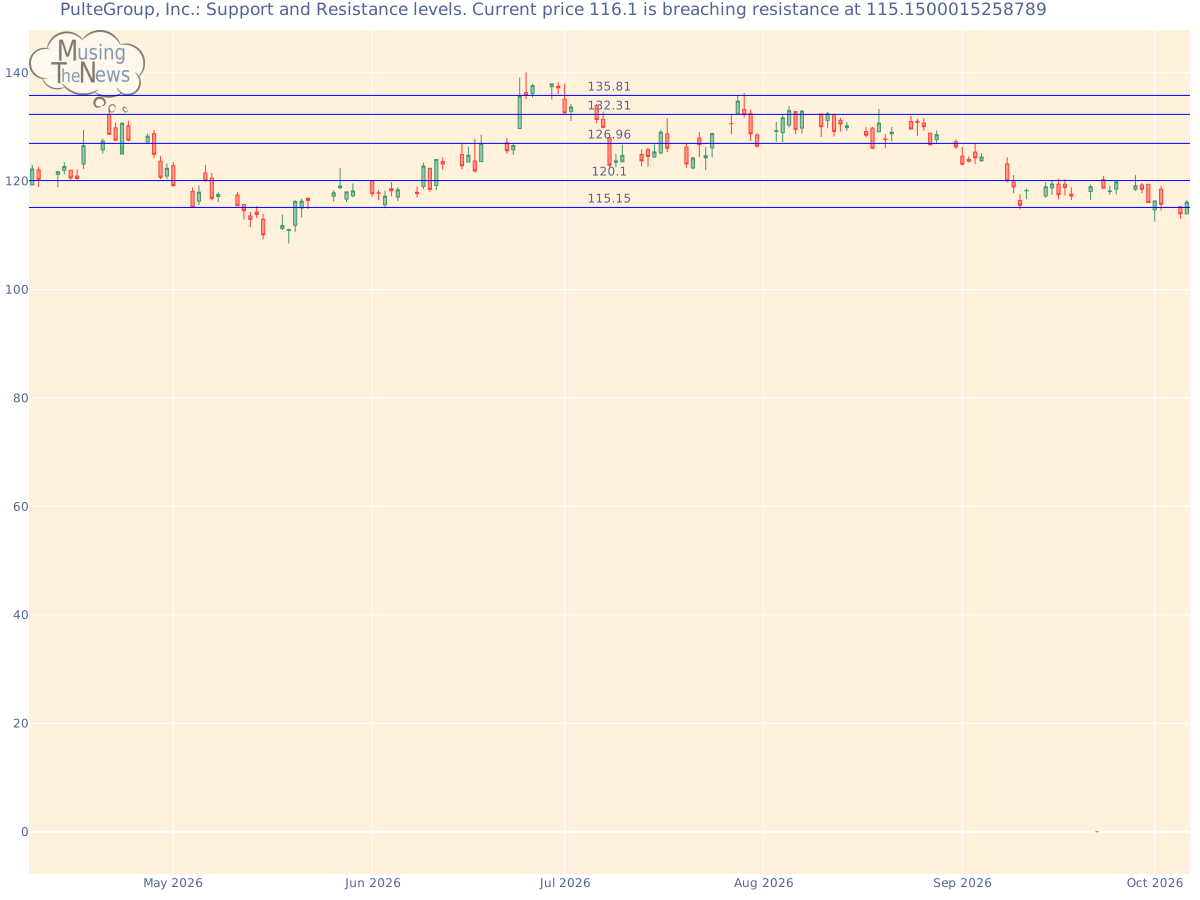
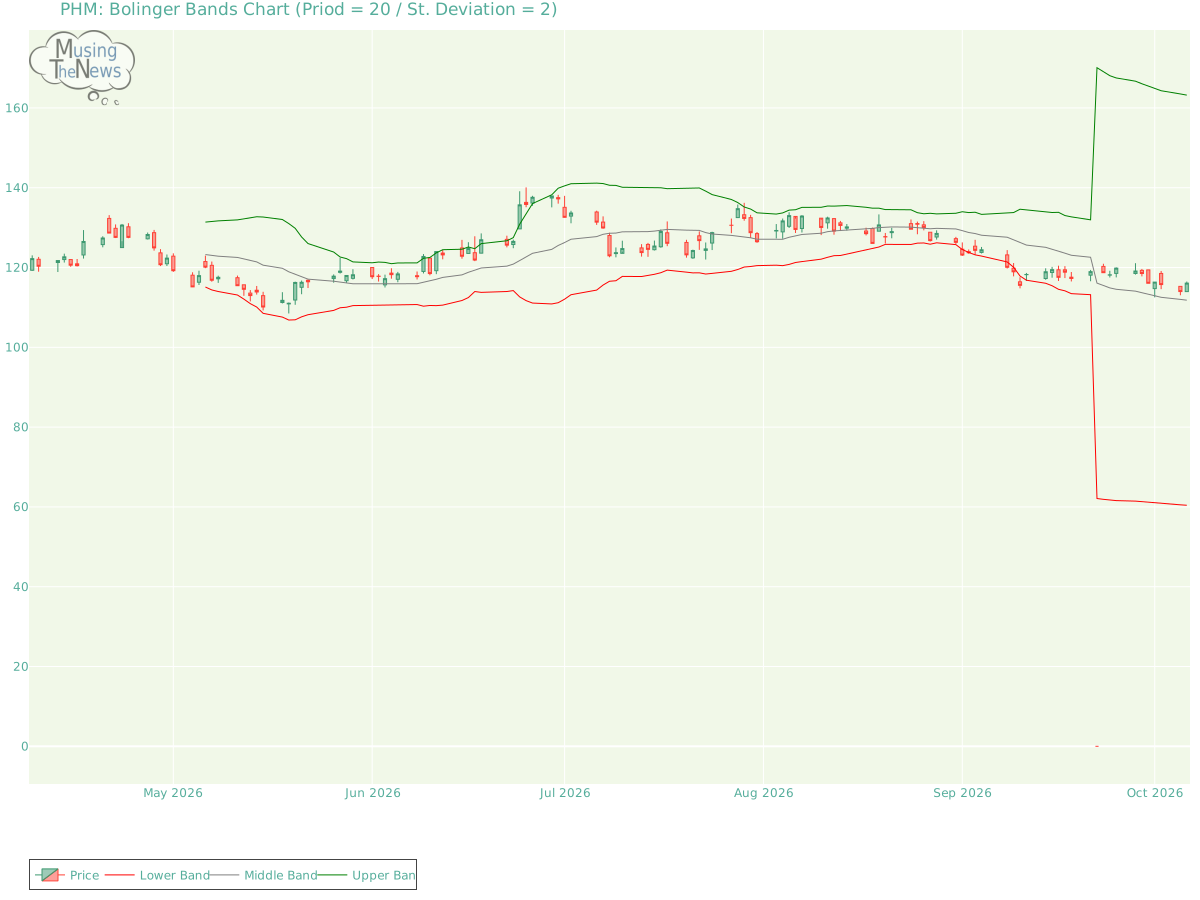
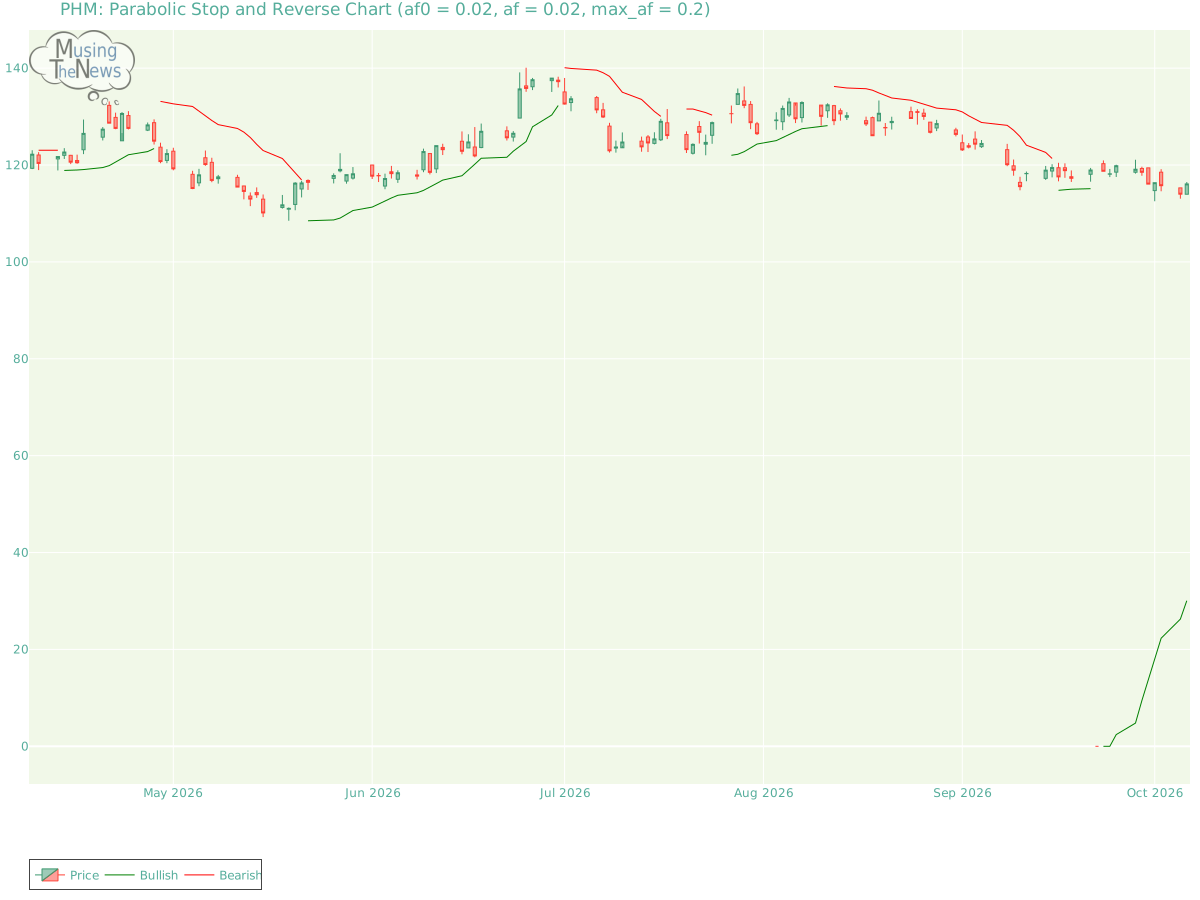
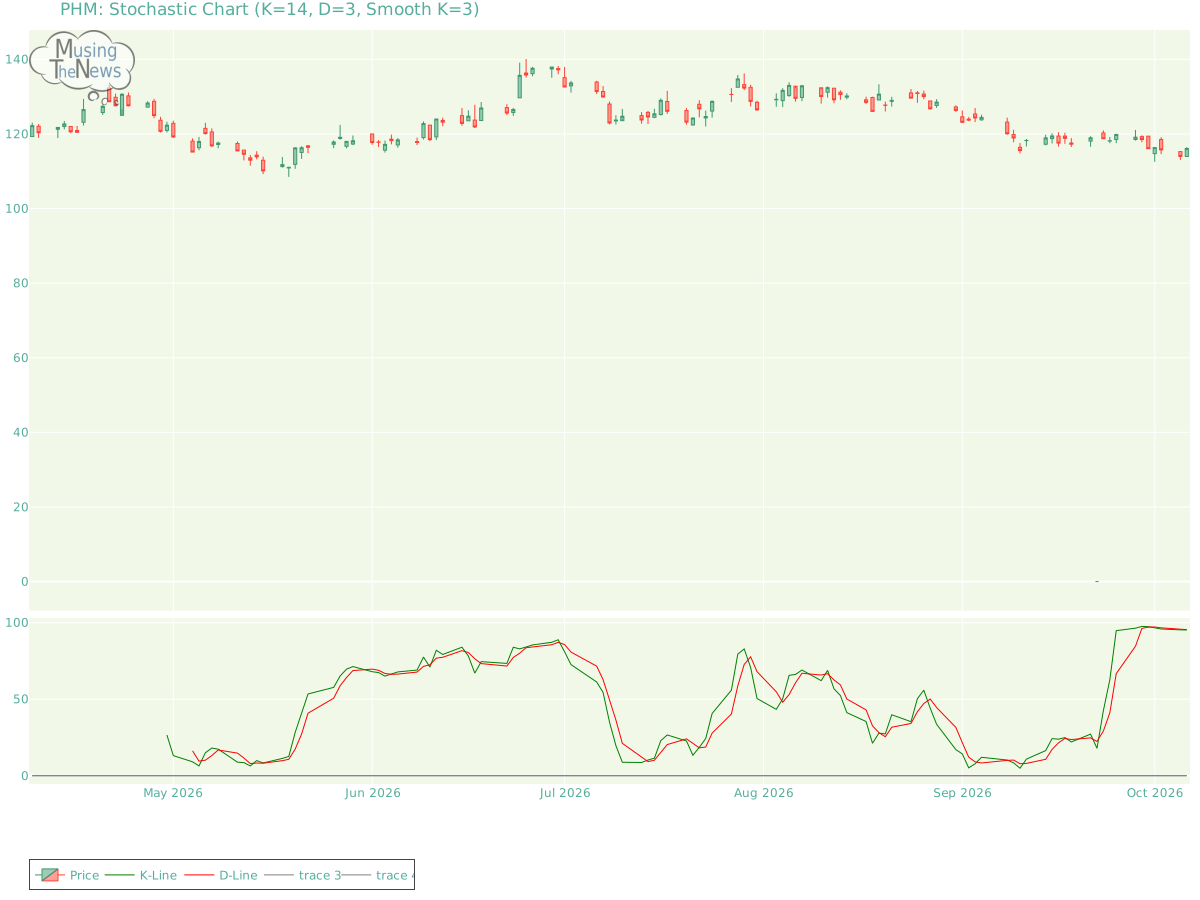
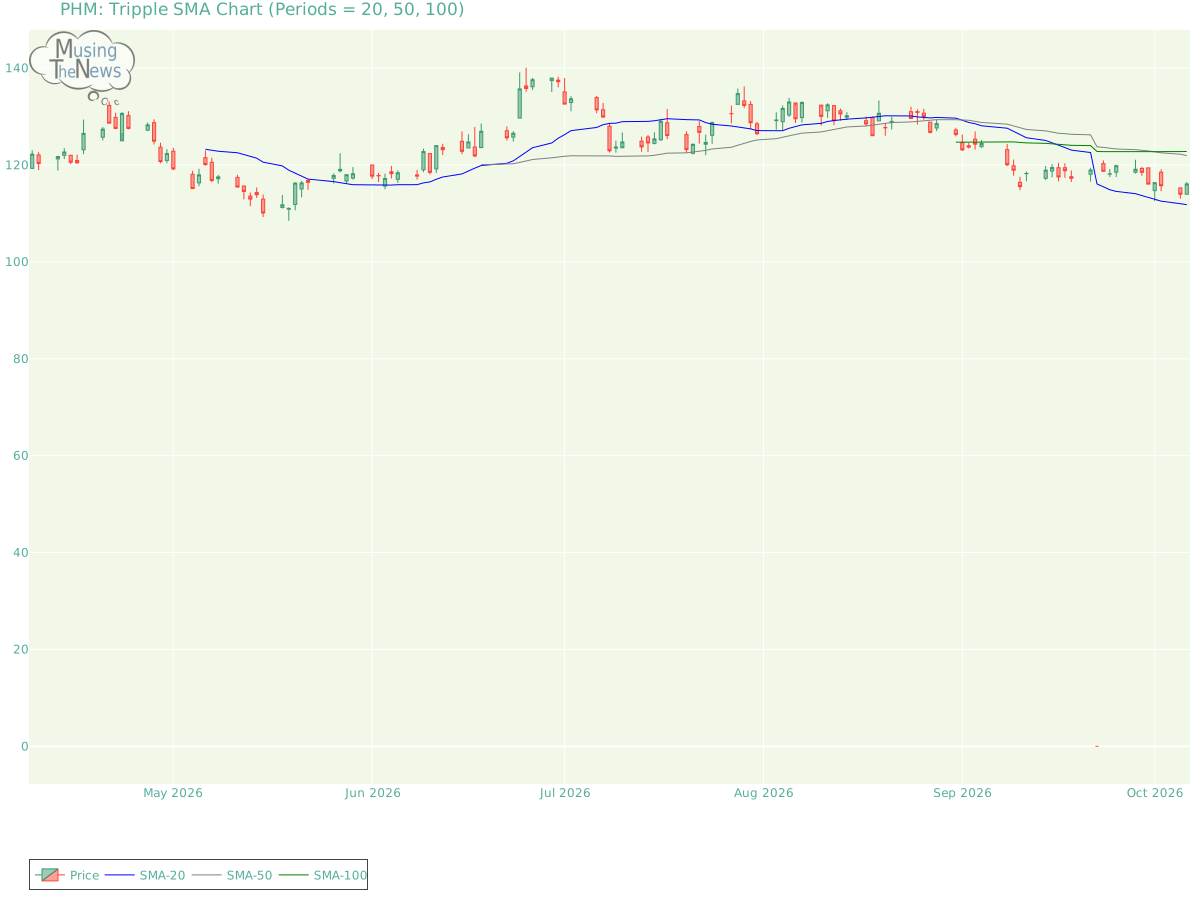
Support and Resistance: The current price for PHM is 116.1, supported at 115.15 with resistance at 120.1. This indicates a trading range where 115.15 might prevent further declines, while 120.1 could hinder additional gains.Support/Resistance for PHMAroon: The current state of the AROON is neutral, offering no clear signals of movement in either direction. This suggests a potential pause in market activity, with no strong trend emerging at the moment.Aroon chart for PulteGroup, Inc.Bol. Bands: The BOLL BANDS is currently in a neutral position for PulteGroup, Inc., offering no clear guidance on whether the market is likely to move up or down. This neutral stance suggests that further observation may be necessary before a trend becomes apparent.Bolinger Bands chart for PulteGroup, Inc.Parabolic SAR: The PSAR remains bullish in its outlook, setting a key support level that could sustain the ongoing upward trend. This strong support indicates that the market may continue to rise, with the bullish momentum likely to persist for PHM.Parabolic Stop and Reverse chart for PulteGroup, Inc.Stochastic: The K-line is now below the D-line on the stochastic indicator, though it remains above 80, pointing to a possible bearish price move. This could be an early warning that the market's upward trend is weakening, potentially leading to a reversal. Investors should be cautious and watch for further bearish signals.Stochastic chart for PulteGroup, Inc.Tripple Moving Agerage: The current alignment of the 20, 50, and 100 moving averages shows a bullish trend, but the slopes of the 20 and 50 SMAs are losing strength. This weakening momentum could indicate that a trend reversal is imminent, potentially leading to a bearish shift in price action. Investors should be cautious as the market's upward trend may soon come to an end.Tripple SMA chart for PulteGroup, Inc. When evaluating a company's technical data, such as stock price charts or volume, it is essential to first consider its fundamentals. These fundamentals include financial stability, growth potential, and competitive advantages. Additionally, understanding the broader industry in which the company operates offers context that helps to make sense of technical patterns. By examining both the company's internal strengths and external environment, one can make more accurate and meaningful conclusions about its stock performance.