The PSAR remains bullish in its outlook, establishing a key support level that could serve as a foundation for further upward movement. This persistent bullish stance sugge...
By MusingTheNews
Updated 2026-10-07 23:26:41
Overall Technical outlook
Price Summary
On 2026-10-06, Northern Trust Corporation's shares started at 170.33, peaked at 171.06, bottomed out at 168.96, and ended -0.51% lower at 169.46, with 1071300 shares traded. The stock's peak price over the last 52 weeks is 191.41, with the lowest being 0.0.
Technicals
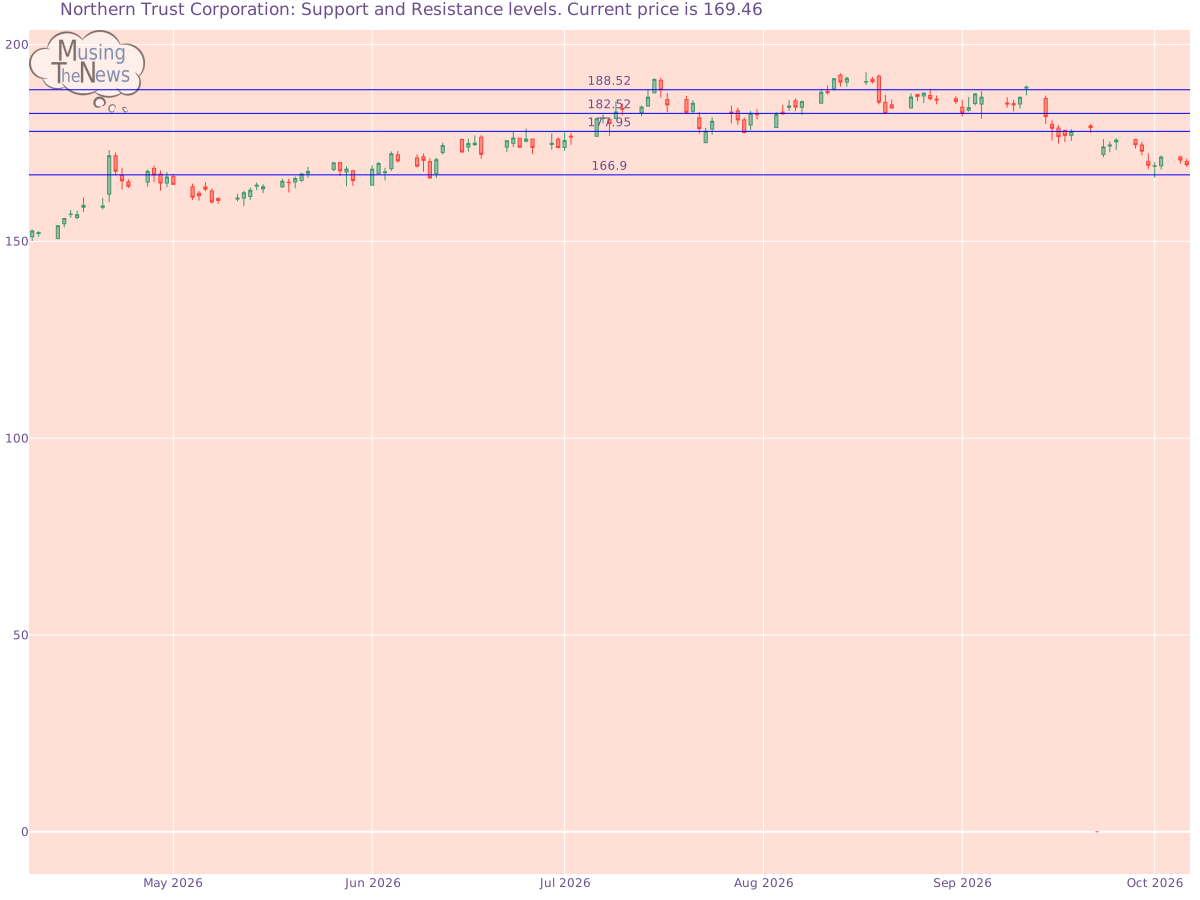
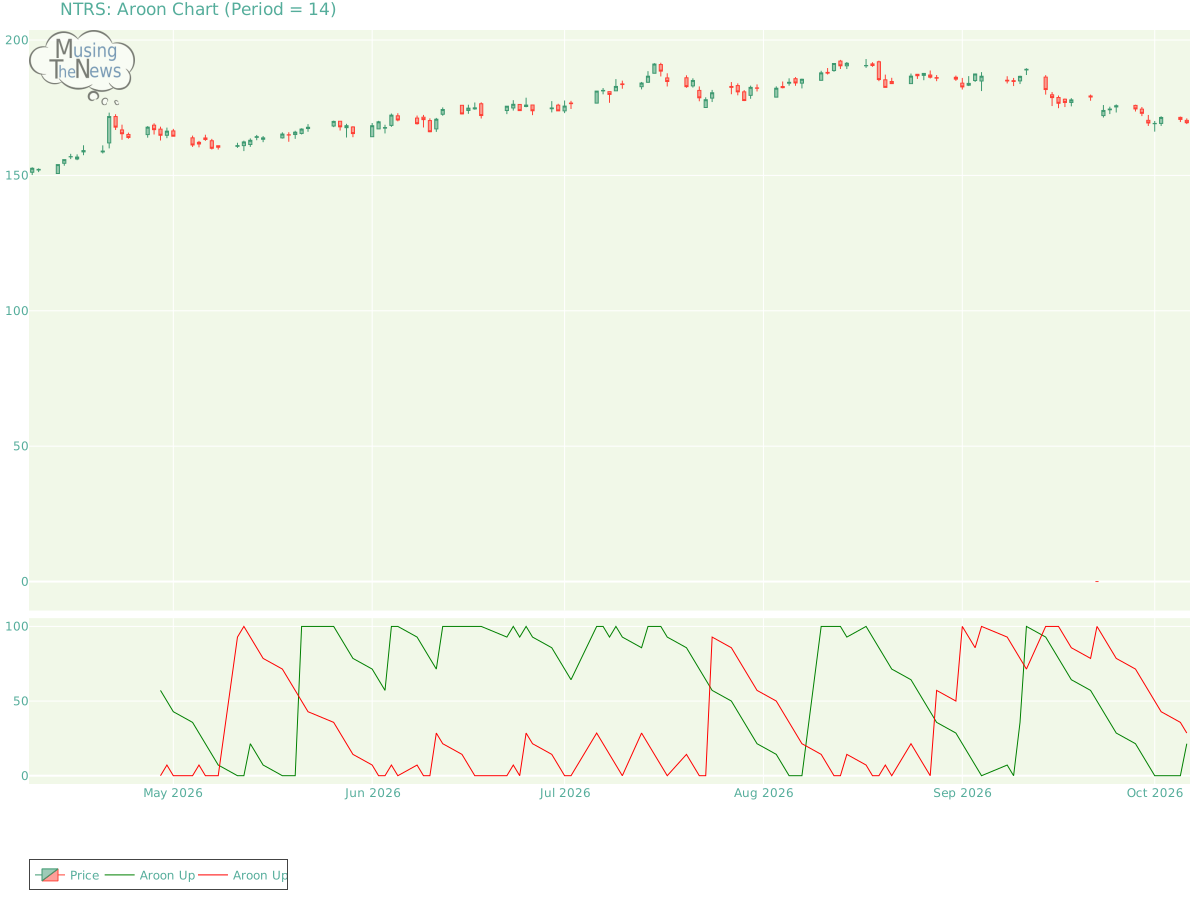
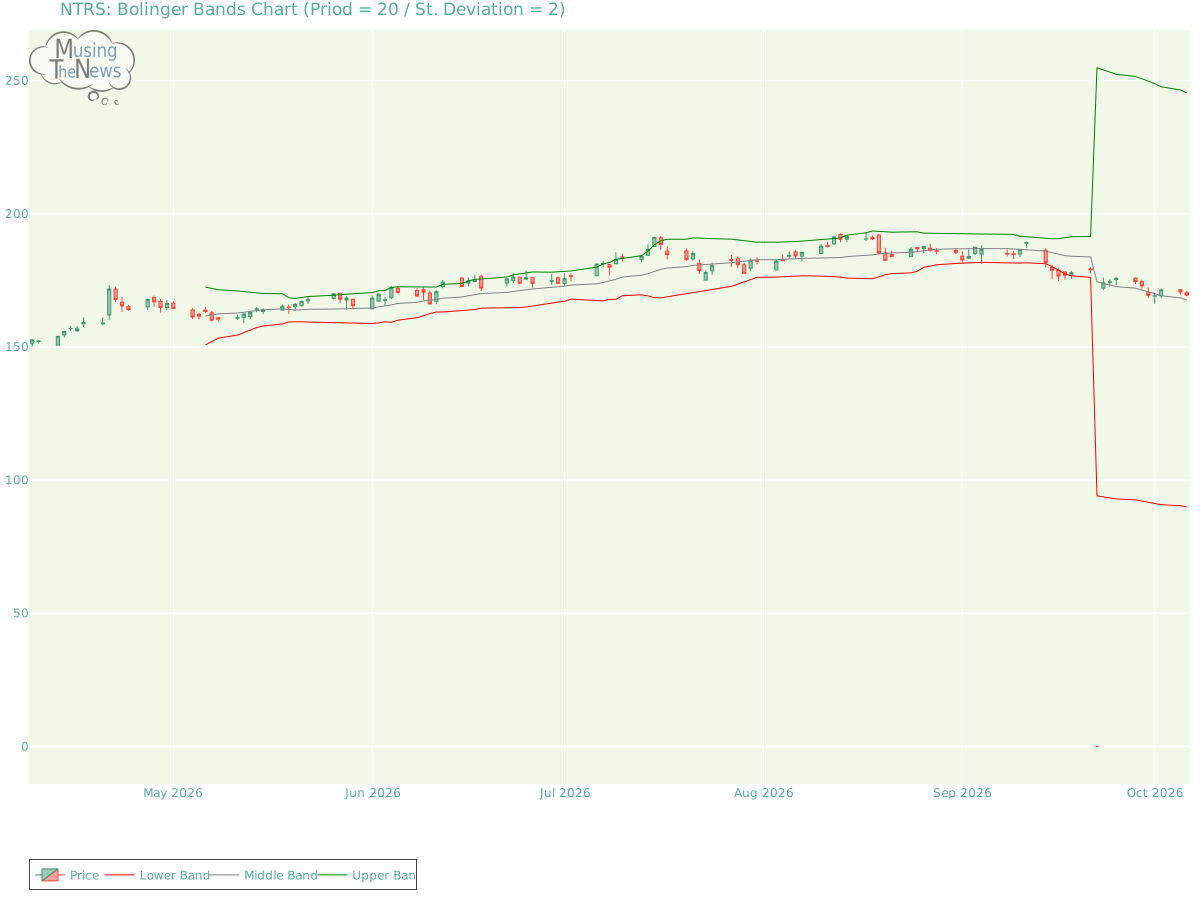
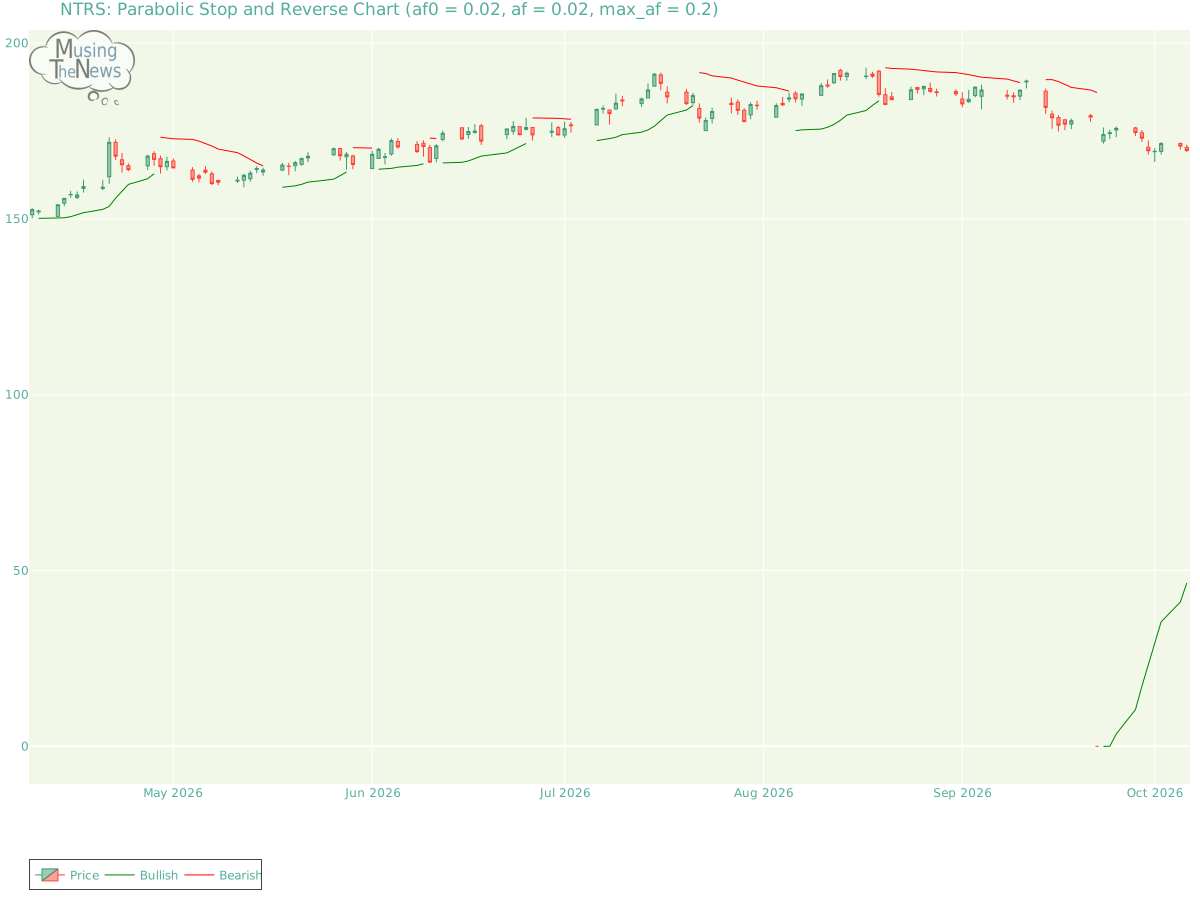
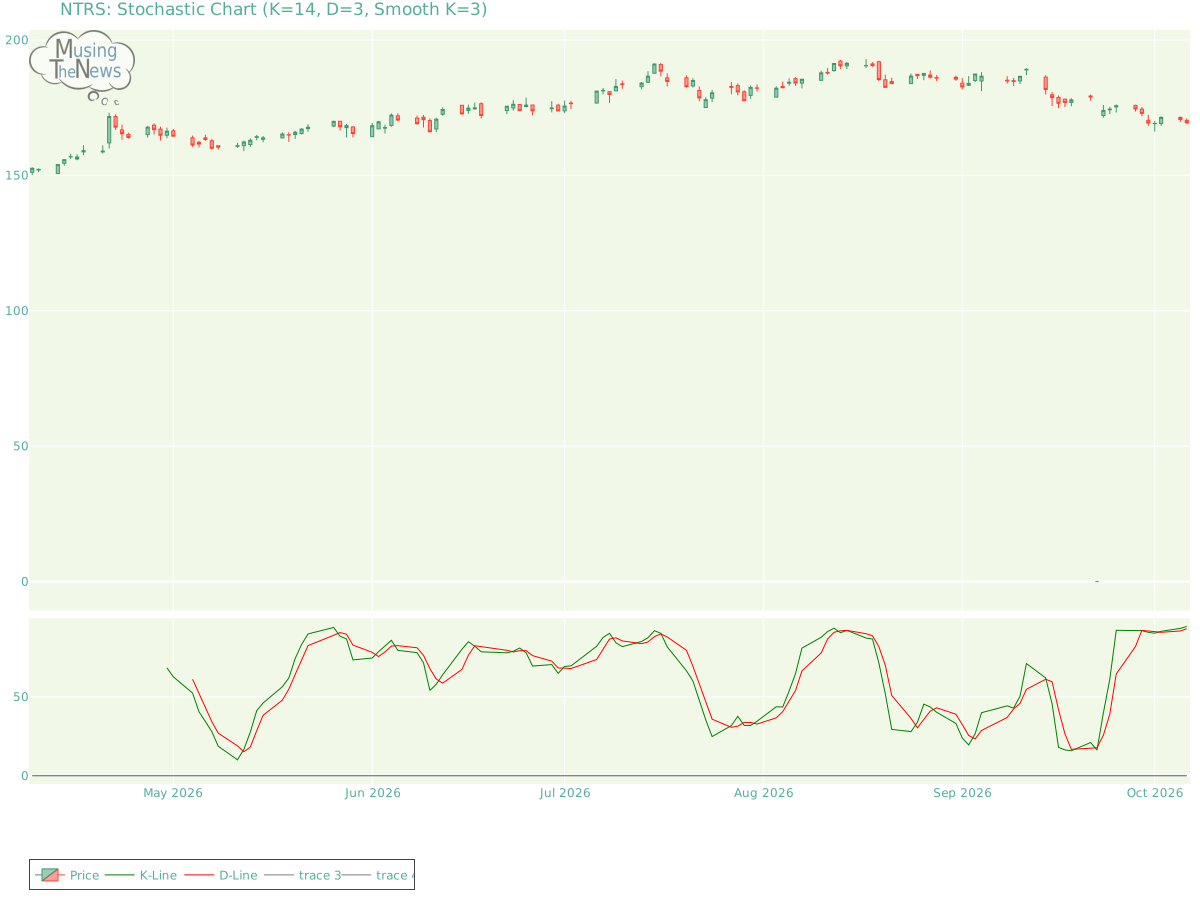
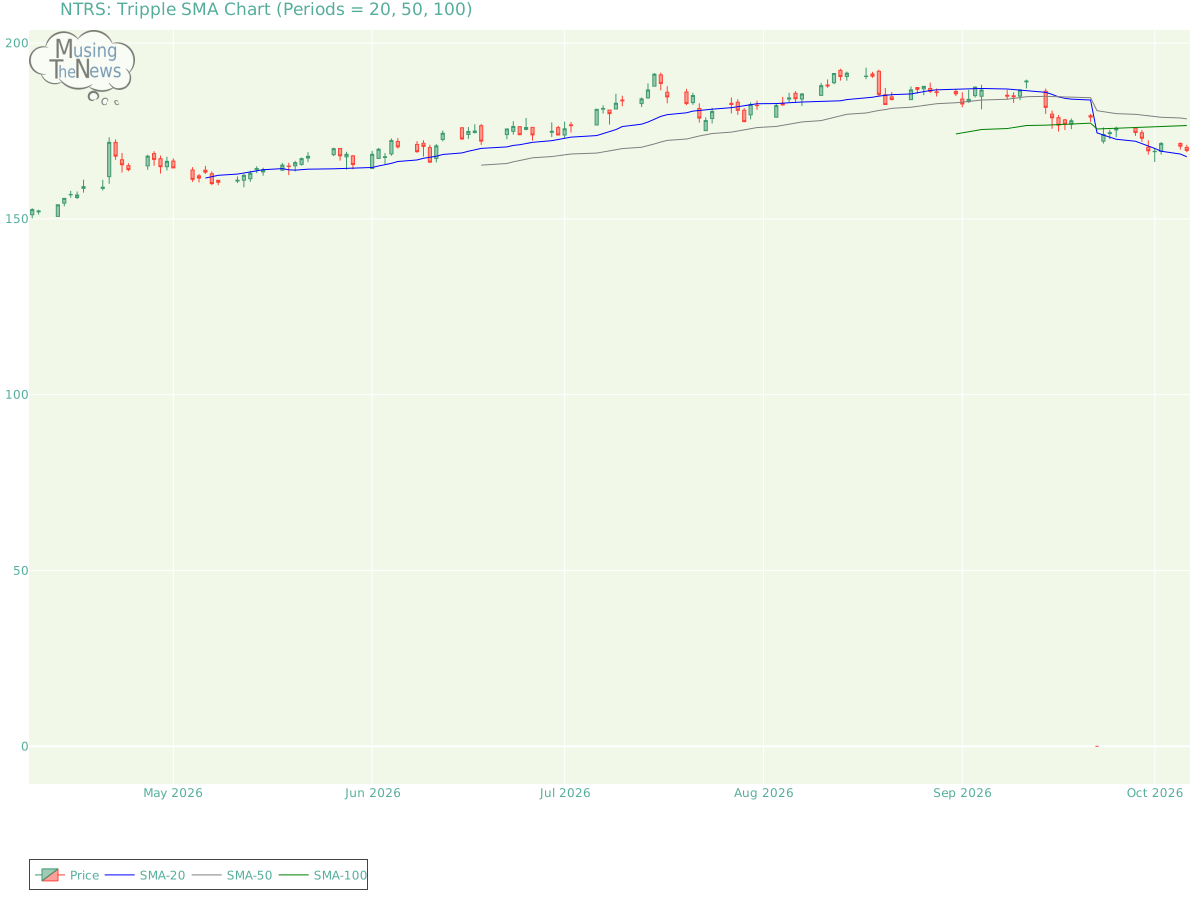
Support and Resistance: The price currently sits at 169.46, finding support at 166.9 and resistance at 177.95. These levels define a range for Northern Trust Corporation where the price may move, with 166.9 offering a base and 177.95 limiting upward momentum.Support/Resistance for NTRSAroon: The AROON is in a neutral stance, with no clear direction indicated for the market. This lack of clarity suggests that the market may be in a state of equilibrium for NTRS, with no strong trend emerging.Aroon chart for Northern Trust CorporationBol. Bands: The BOLL BANDS is currently in a neutral position for Northern Trust Corporation, offering no clear guidance on whether the market is likely to move up or down. This neutral stance suggests that further observation may be necessary before a trend becomes apparent.Bolinger Bands chart for Northern Trust CorporationParabolic SAR: The PSAR remains bullish in its outlook, establishing a key support level that could serve as a foundation for further upward movement. This persistent bullish stance suggests that the market may continue to trend higher, with the established support providing a potential safety net for investors.Parabolic Stop and Reverse chart for Northern Trust CorporationStochastic: The stochastic indicator reflects bullish conditions for NTRS, with the K-line above both the D-line and the 80 level. This setup suggests strong upward momentum, implying that the market may continue to experience gains. Investors could interpret this as a sign of ongoing strength.Stochastic chart for Northern Trust CorporationTripple Moving Agerage: The Tripple MOVING AVG is currently neutral, showing no clear bias toward an upward or downward trend. This suggests that the market may be in a phase of indecision or consolidation.Tripple SMA chart for Northern Trust Corporation A company's technical data, including stock price and trading volume, can provide valuable insights when considered alongside its fundamentals. These include financial performance, market share, and growth strategy, as well as broader industry dynamics. Examining these factors helps investors or analysts make more informed decisions, as the company's fundamentals offer context for understanding how and why certain technical patterns may emerge in the market.