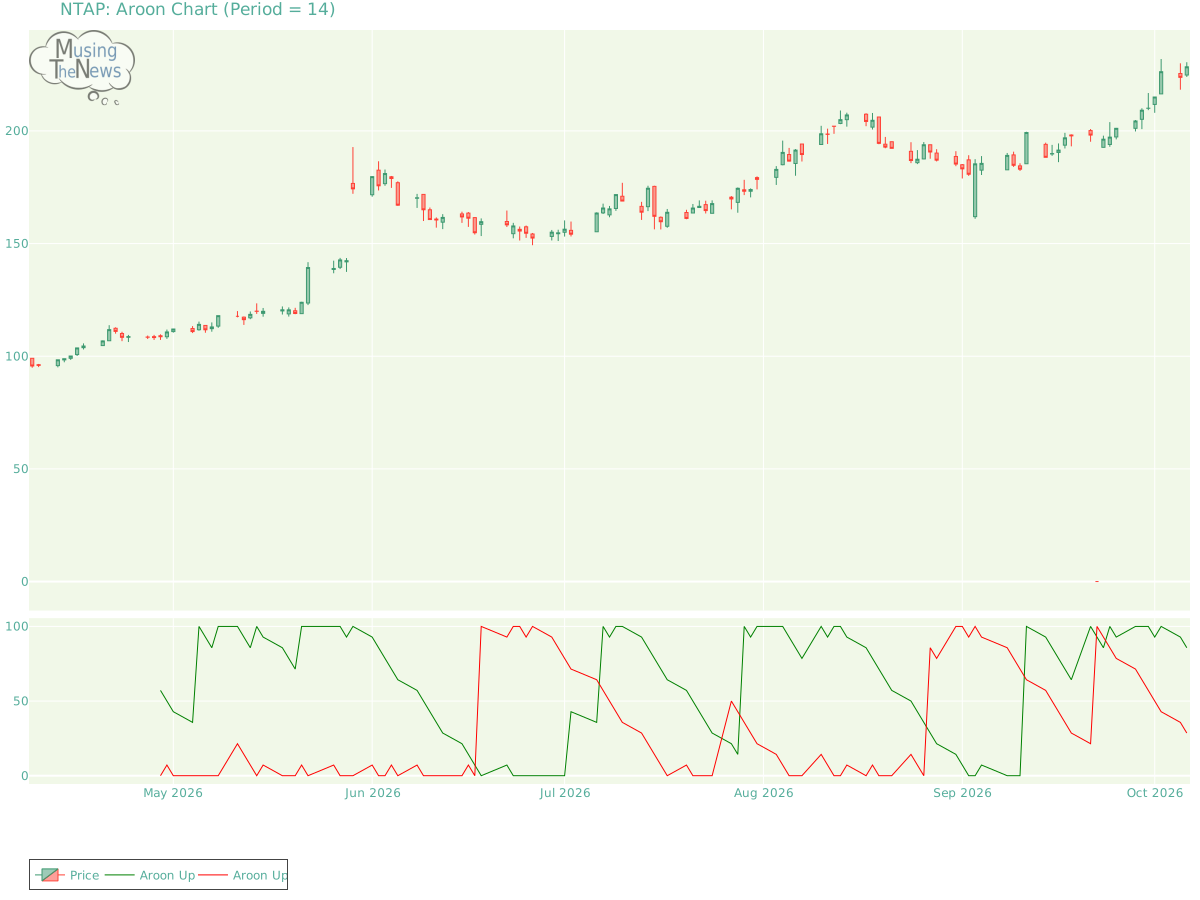
The AROON is in a neutral stance, not pointing to a clear trend in either direction. This suggests that the market may be lacking strong momentum, making it difficult to pr...
By MusingTheNews
Updated 2026-10-07 23:26:39
Overall Technical outlook
Price Summary
NetApp, Inc.'s stock opened at 224.8 on 2026-10-06, surged to 230.49, dropped to 223.95, and ended 1.62% up at 228.45, with 2842900 shares traded. The stock's highest price over the 52-week span is 228.45, while the lowest price is 0.0.
Technicals
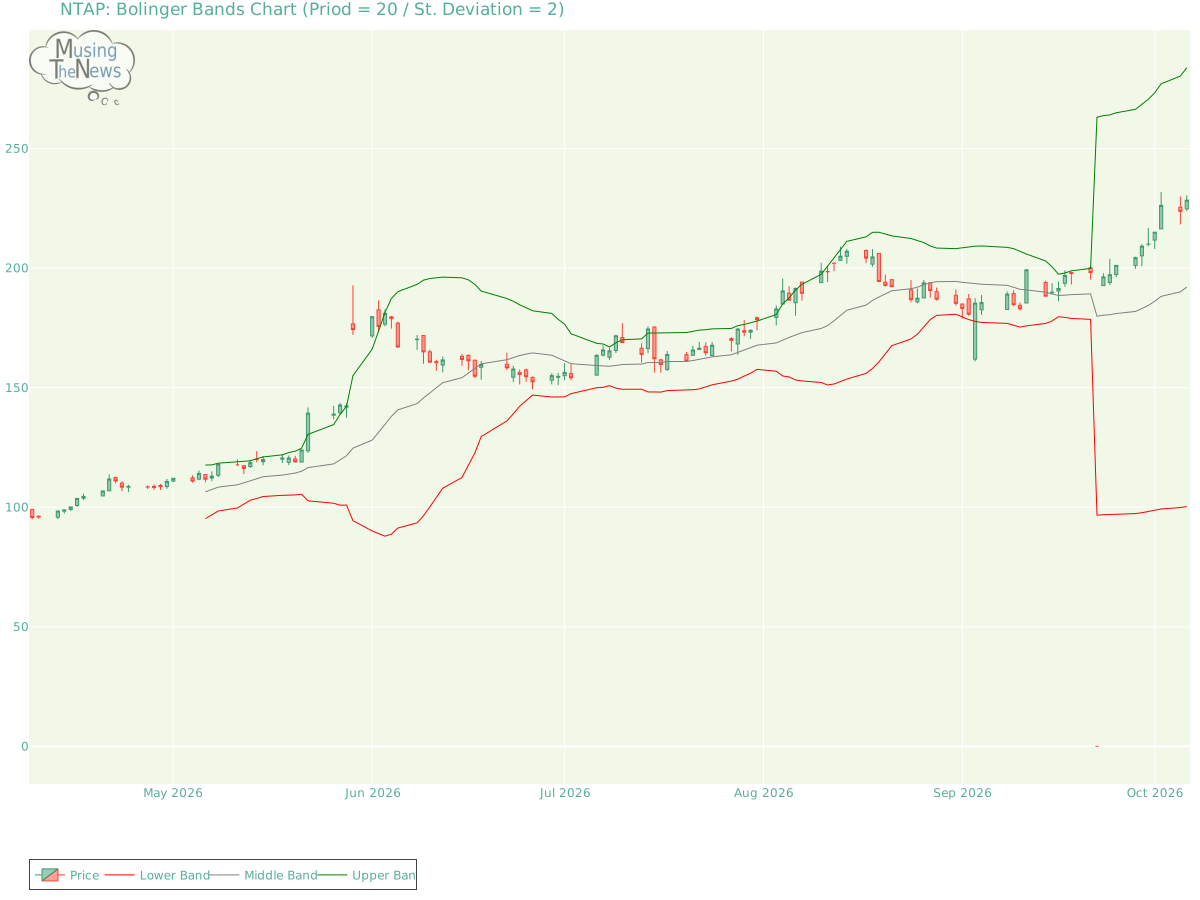
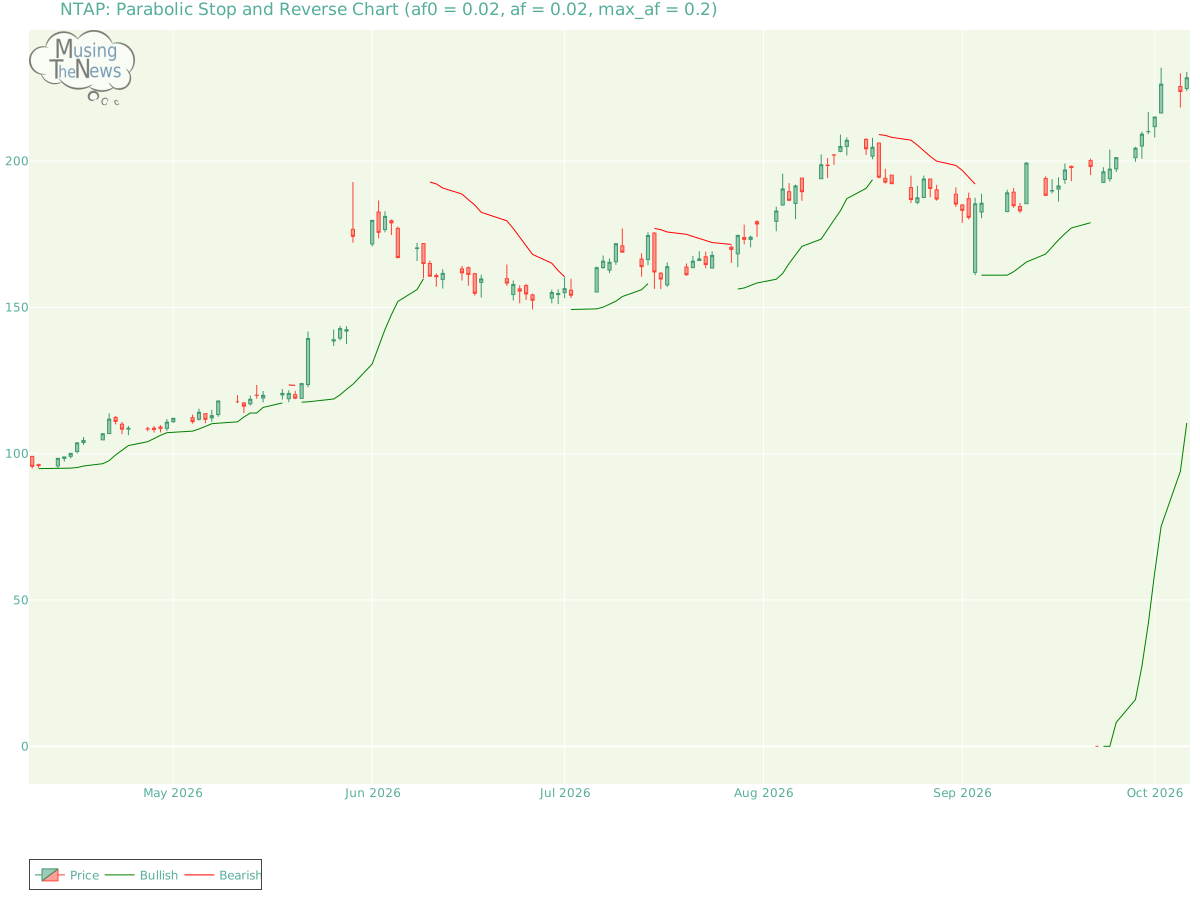
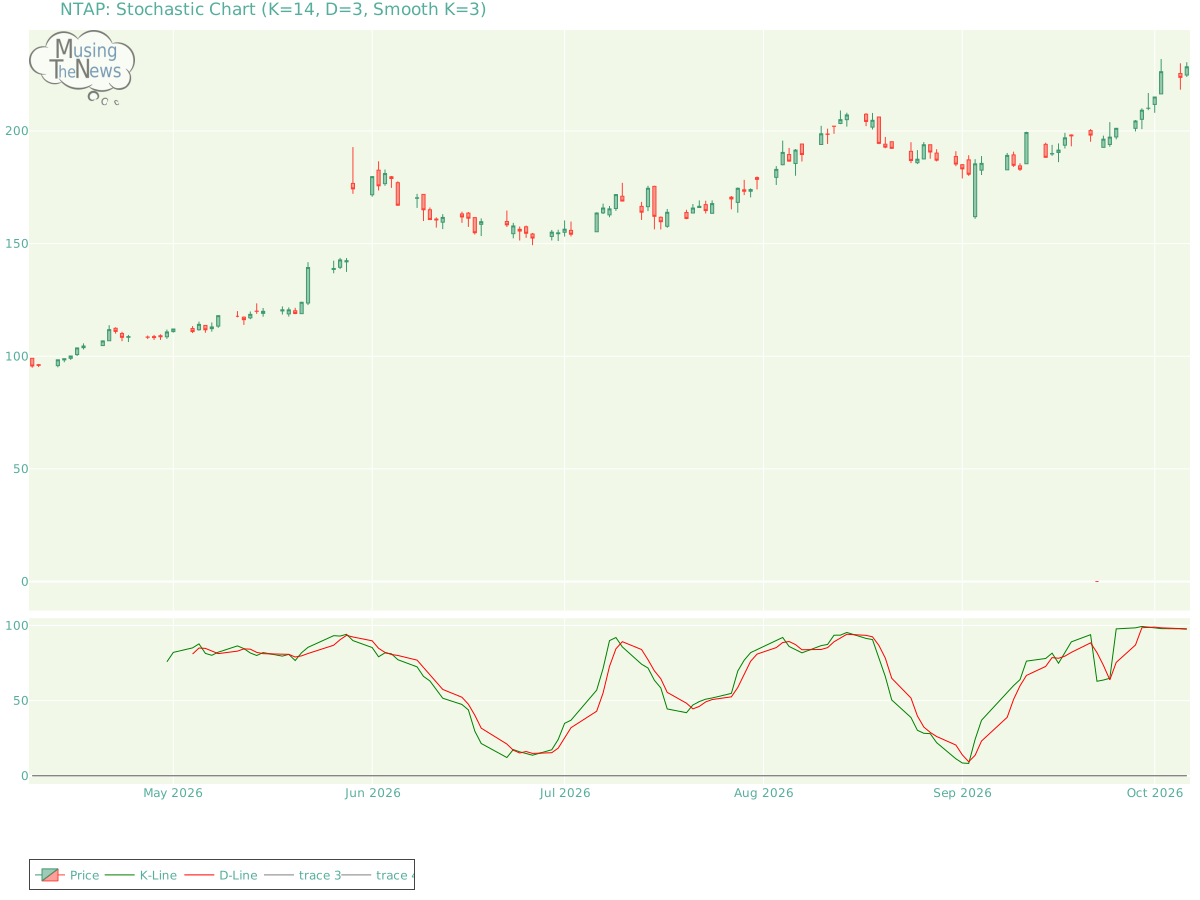
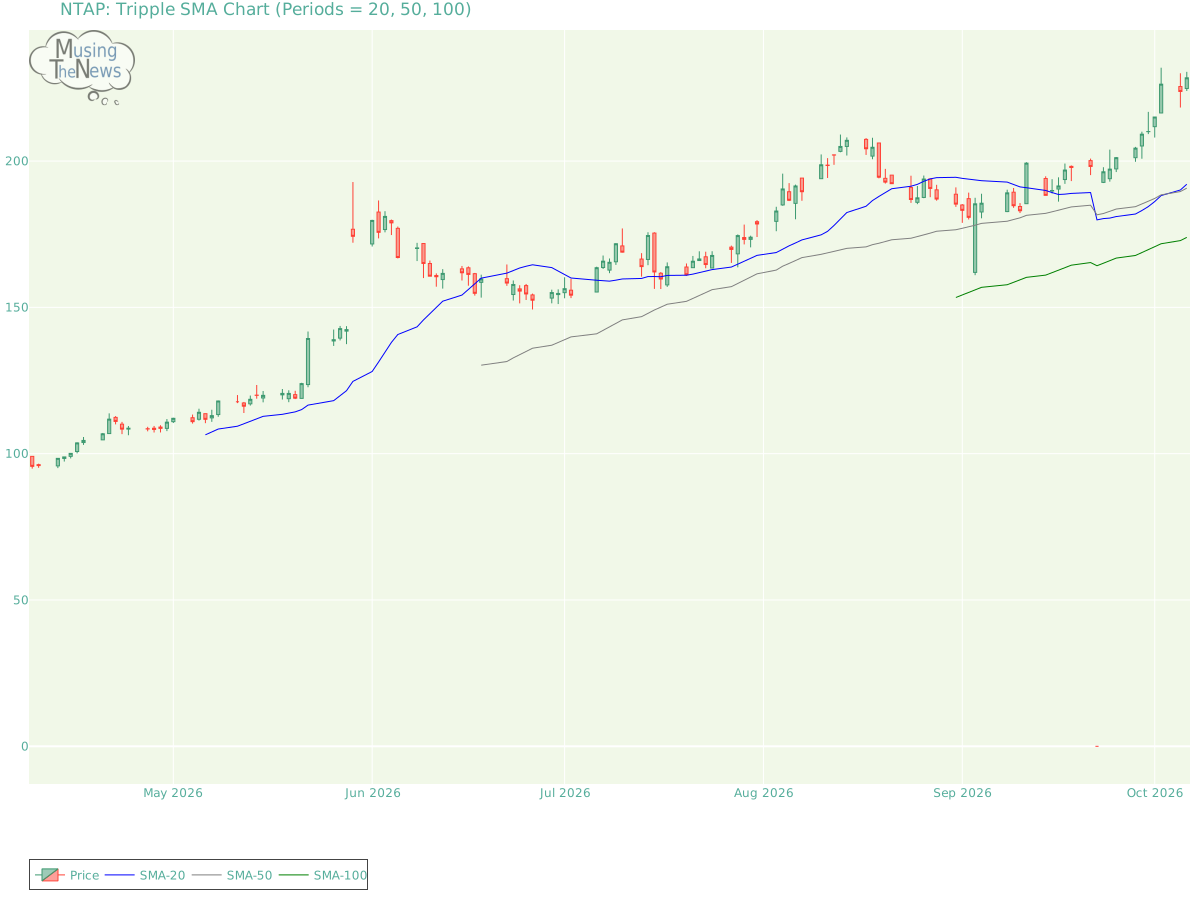
Aroon: The AROON is in a neutral stance, not pointing to a clear trend in either direction. This suggests that the market may be lacking strong momentum, making it difficult to predict the next move.Aroon chart for NetApp, Inc.Bol. Bands: The BOLL BANDS is showing a neutral reading, with no clear direction indicated for upward or downward movement. This neutral position suggests a possible period of consolidation.Bolinger Bands chart for NetApp, Inc.Parabolic SAR: The PSAR remains bullish in its outlook, reinforcing a key support level that could help sustain the market's upward movement for NTAP. This support suggests that the bullish momentum is likely to persist, offering a foundation for further growth.Parabolic Stop and Reverse chart for NetApp, Inc.Stochastic: The stochastic indicator for NTAP reflects the K-line moving below the D-line, though it stays above 80, hinting at the potential beginning of a bearish price move. This setup suggests that the market's strength may be diminishing, with a possible downturn ahead. Traders should be on alert for further bearish confirmation.Stochastic chart for NetApp, Inc.Tripple Moving Agerage: The 20, 50, and 100 moving averages are aligned in a bearish formation, suggesting a downtrend. However, the slopes of the 20 and 50 SMAs are beginning to waver, indicating that the bearish momentum may be losing strength. This weakening could signal a potential shift towards bullish price action, as the market's current downward trajectory shows signs of faltering and a possible reversal may be near for NTAP.Tripple SMA chart for NetApp, Inc. In order to draw meaningful inferences from a company's technical data, it is essential to first consider its fundamentals. This includes reviewing financial metrics like revenue, profit margins, and debt-to-equity ratios. Additionally, understanding the broader industry landscape, including market trends and competitive pressures, is crucial. By integrating these insights with the company's technical performance, such as stock price fluctuations and trading volume, one can make more informed investment decisions.