Fundamentals for NetApp, Inc.
NTAP's elevated debt-to-equity ratio shows that the company is relying heavily on debt to fund its activities. This high leverage can amplify returns but also heightens fin...






Business Operations:
Sector: TechnologyIndustry: Software - Infrastructure
NetApp, Inc. provides a range of enterprise software, systems, and services that customers use to transform their data infrastructures in the United States, Canada, Latin America, Europe, the Middle East, Africa, and the Asia Pacific. It operates through two segments, Hybrid Cloud and Public Cloud. The company offers data management software, such as NetApp ONTAP, ONTAP One, NetApp Snapshot, NetApp SnapCenter Backup Management, NetApp SnapMirror Data Replication, and NetApp SnapLock Data Compliance; and storage infrastructure solutions, including NetApp All-Flash FAS (AFF A-Series), NetApp All-Flash FAS with capacity flash (AFF C-Series), NetApp All-Flash SAN Array (ASA A-Series & C-Series), NetApp Fabric Attached Storage (FAS), NetApp E/EF series, and NetApp StorageGRID. It also provides cloud storage services comprising NetApp Cloud Volumes ONTAP, Azure NetApp Files, Amazon FSx for NetApp ONTAP, and Google Cloud NetApp Volumes, as well as NetApp BlueXP, BlueXP Copy and Sync, BlueXP Backup and Recovery, BlueXP Classification, and BlueXP Ransomware Protection. In addition, the company offers operational services, such as NetApp Data Infrastructure Insights and Instaclustr; and professional and support services offerings include storage-as-a-service (STaaS), strategic consulting, professional, managed, and support services, as well as assessment, design, implementation, migration, and proactive support services to help customers optimize the performance and efficiency of their on-premises and hybrid multicloud storage environments. It serves various industries comprising energy, financial services, government, technology, internet, life sciences, healthcare services, manufacturing, media, entertainment, animation, video postproduction, and telecommunications through a direct sales force and an ecosystem of partners, including the leading cloud providers. NetApp, Inc. was incorporated in 1992 and is headquartered in San Jose, California.
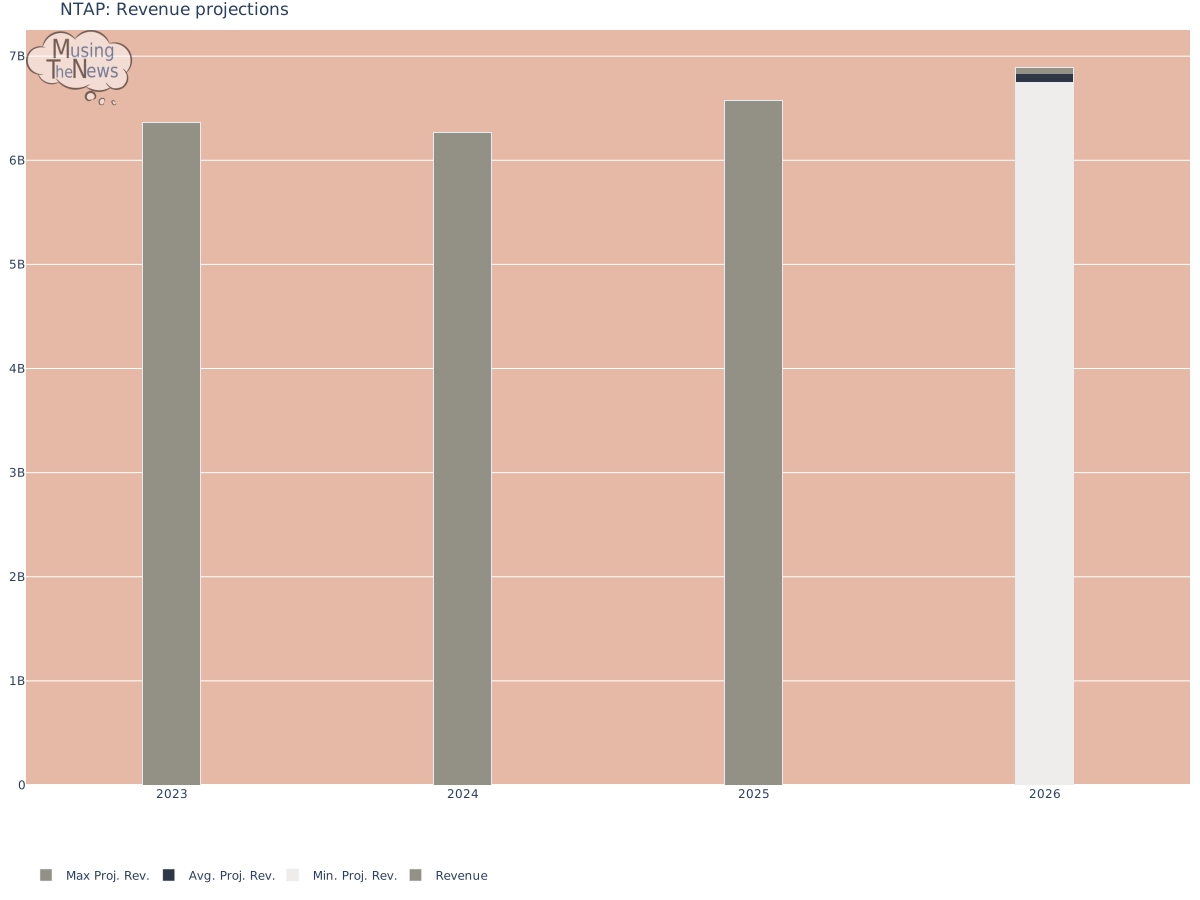
Revenue projections:
Financial Ratios:
| currentRatio | 1.242000 |
|---|---|
| forwardPE | 20.346302 |
| debtToEquity | 169.498000 |
| earningsGrowth | 0.635000 |
| revenueGrowth | 0.299000 |
| grossMargins | 0.706260 |
| operatingMargins | 0.266670 |
| trailingEps | 7.090000 |
| forwardEps | 11.120940 |
NetApp, Inc.'s current ratio 1.242, suggesting the company has sufficient liquidity to service its short-term debt. With its cash reserves and current assets in good shape, NetApp, Inc. can comfortably meet its immediate liabilities, reflecting a healthy financial standing.
NetApp, Inc.'s Forward PE ratio is in a good range, reflecting a reasonable balance between stock price and earnings. The stock is not overpriced, leaving room for growth, which suggests potential for investors looking to capitalize on future value appreciation.
NTAP's elevated debt-to-equity ratio shows that the company is relying heavily on debt to fund its activities. This high leverage can amplify returns but also heightens financial risks if cash flow becomes constrained.
NTAP's positive earnings and revenue growth indicate that the company is on track to expand its business. This growth suggests a strong financial outlook, with increasing profits and sales positioning NTAP for continued success in the market.
Positive gross and operating margins for NetApp, Inc. suggest that the company is operating profitably. These margins highlight NetApp, Inc.'s efficiency in managing costs while maintaining healthy revenue streams, contributing to its overall financial strength.
With a forward EPS greater than its trailing EPS, NTAP is expected to see higher profitability this year. The forecasted increase in earnings reflects optimism about the company's financial growth and potential for improved performance over the prior year.
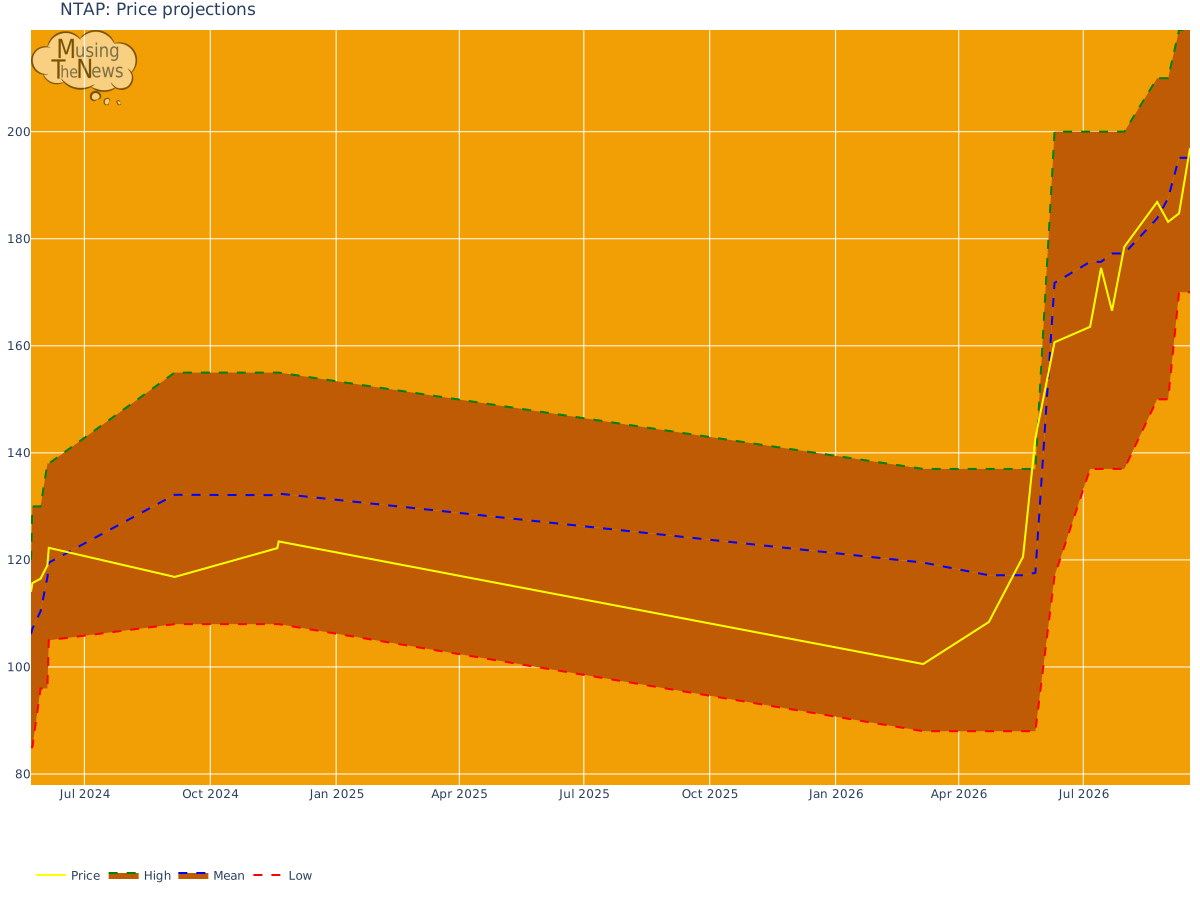
Price projections:
Insider Transactions:
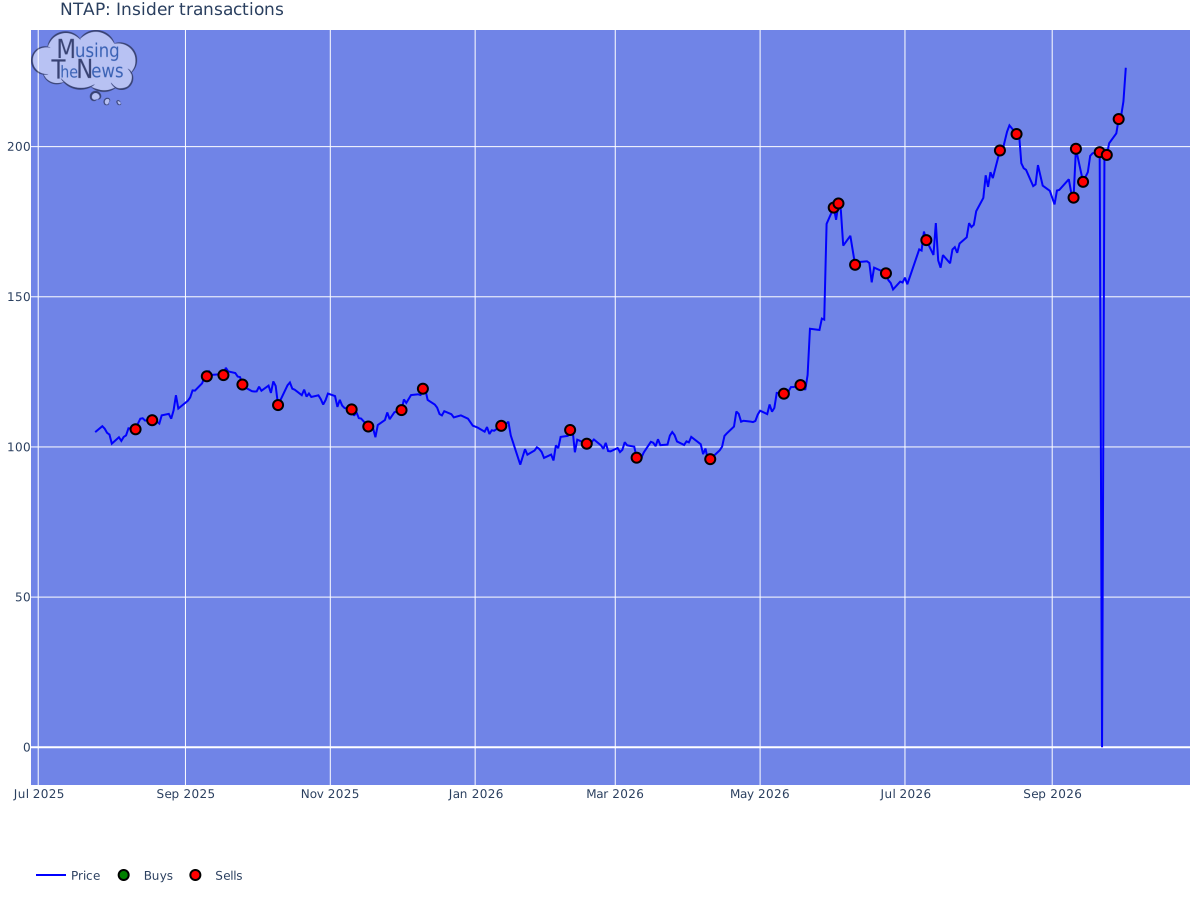
30 transactions to sell NetApp, Inc. occurred, with market price at 143.9505376180013.There were no sell transactions during the period under consideration.With more buys than sells around NTAP's current price, there seems to be increased confidence among investors. This shift may indicate a favorable outlook, as the buying behavior suggests optimism for the stock's future growth or resilience.
Recommendation changes over time:
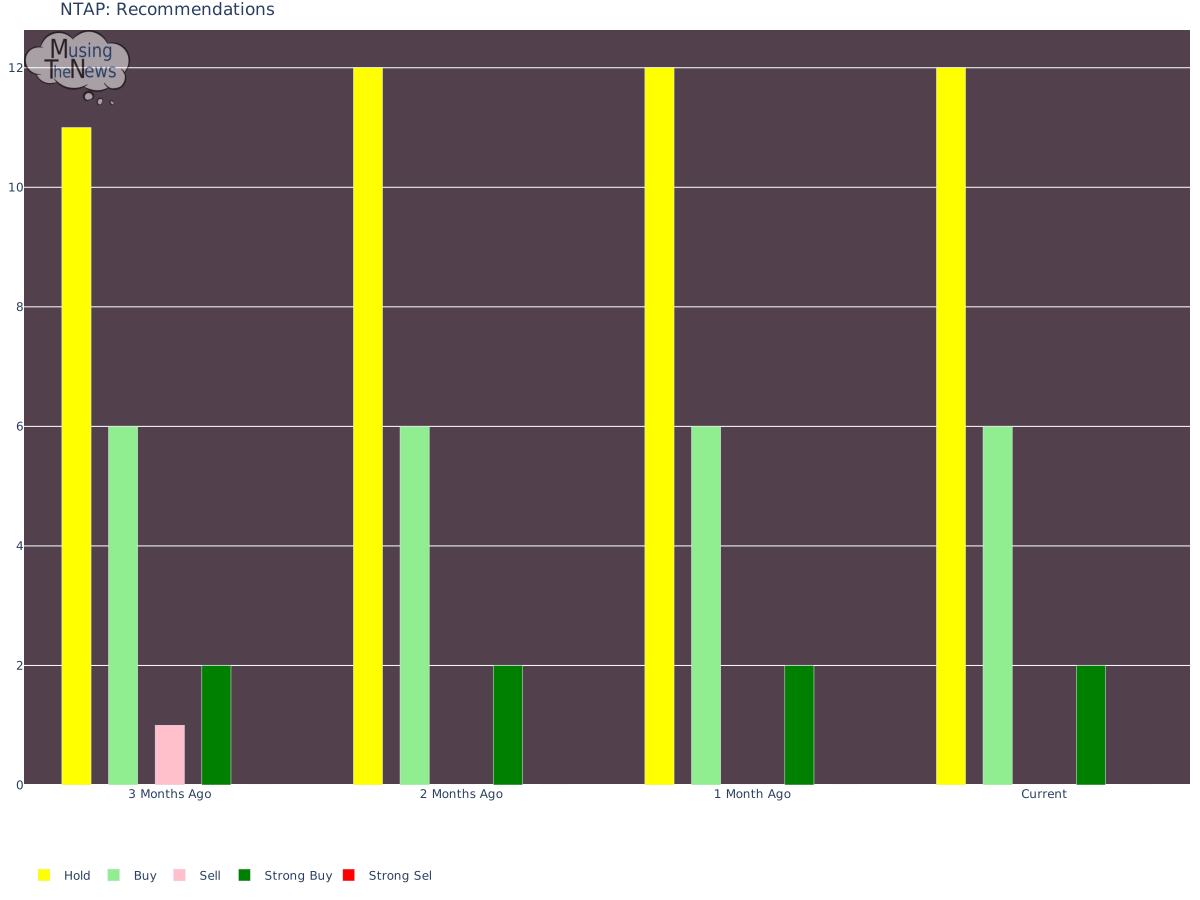
A recent buy bias from analysts toward NetApp, Inc. may inspire confidence in investors, who could view the stock as a promising investment. This positive sentiment suggests that NetApp, Inc. might be an appealing option for those looking to grow their wealth through stock market investments.





