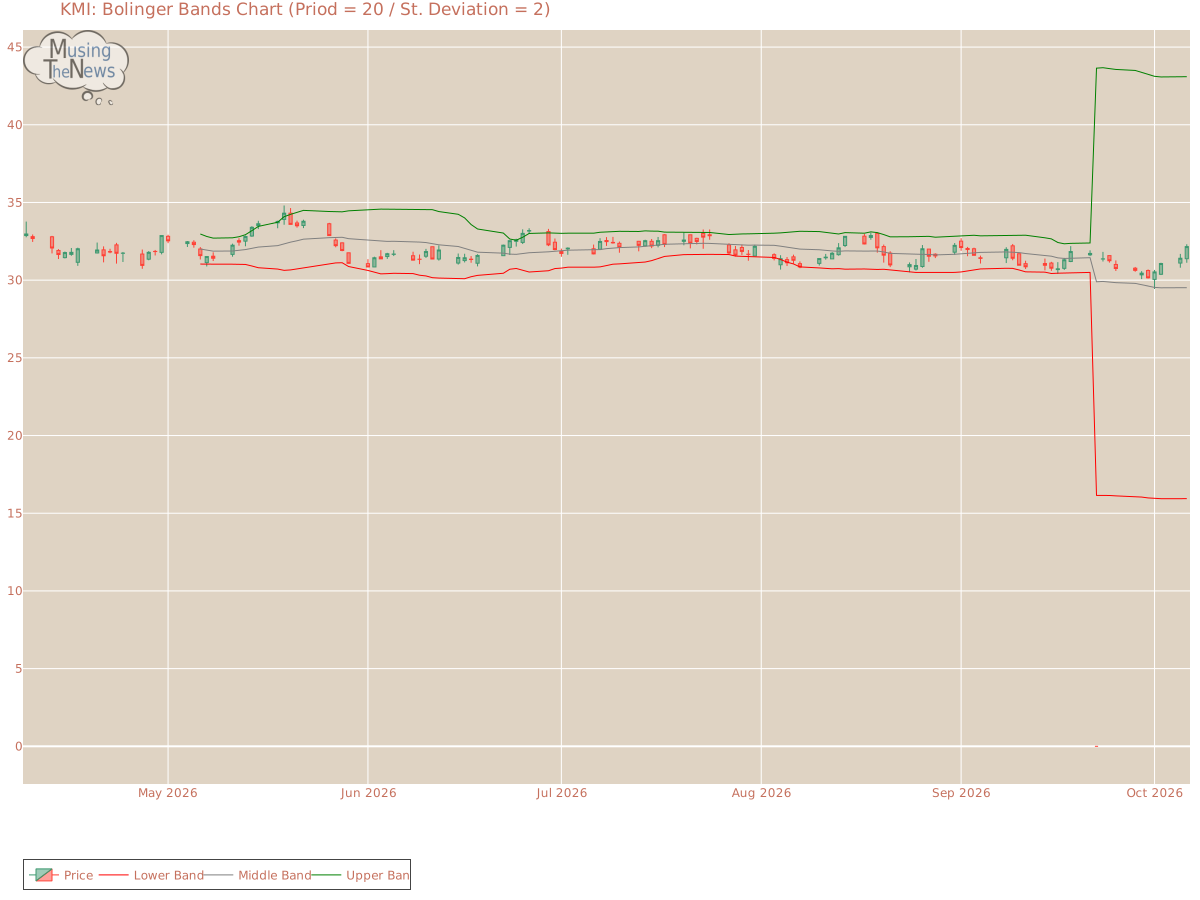
The current state of the BOLL BANDS is neutral for KMI, providing no clear indication of a trend in either direction. This suggests that the market may be lacking momentum,...
By MusingTheNews
Updated 2026-10-07 23:26:30
Overall Technical outlook
Price Summary
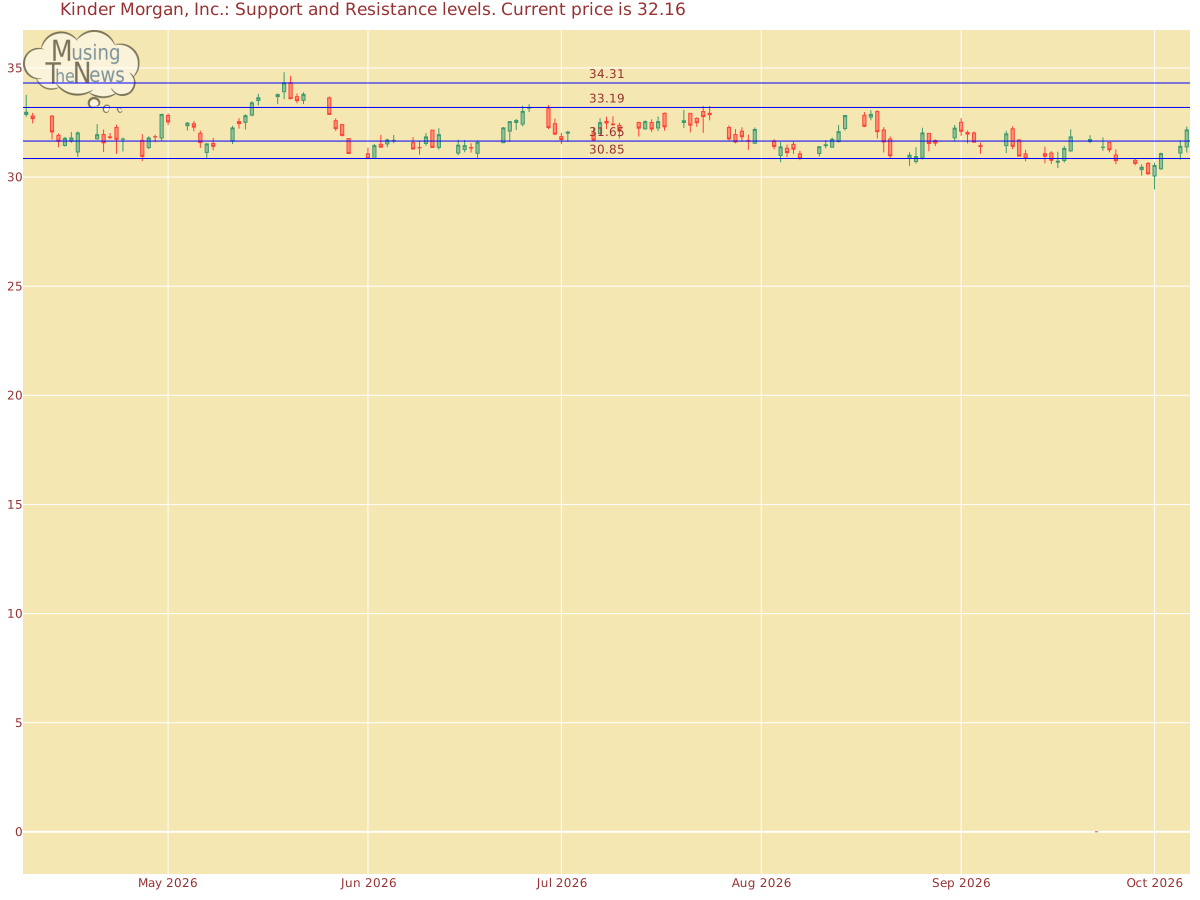
A 2.49% surge in Kinder Morgan, Inc.'s stock marked an fantastic day on the market. On 2026-10-06, Kinder Morgan, Inc.'s stock opened at 31.38, spiked to 32.31, declined to 31.12, and closed 2.49% up at 32.16, with 15695900 shares traded. Over the course of 52 weeks, the stock peaked at 34.31 and hit a low of 0.0.
Technicals
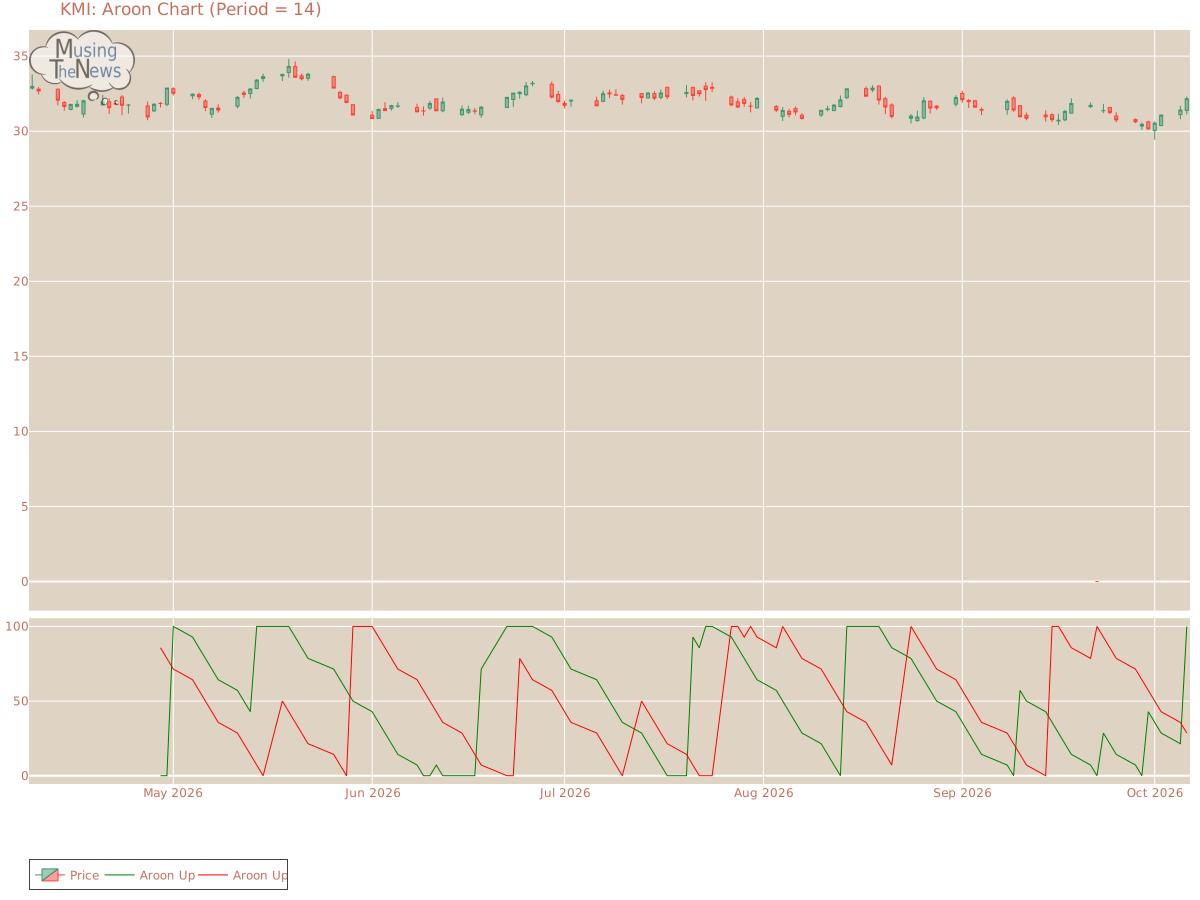
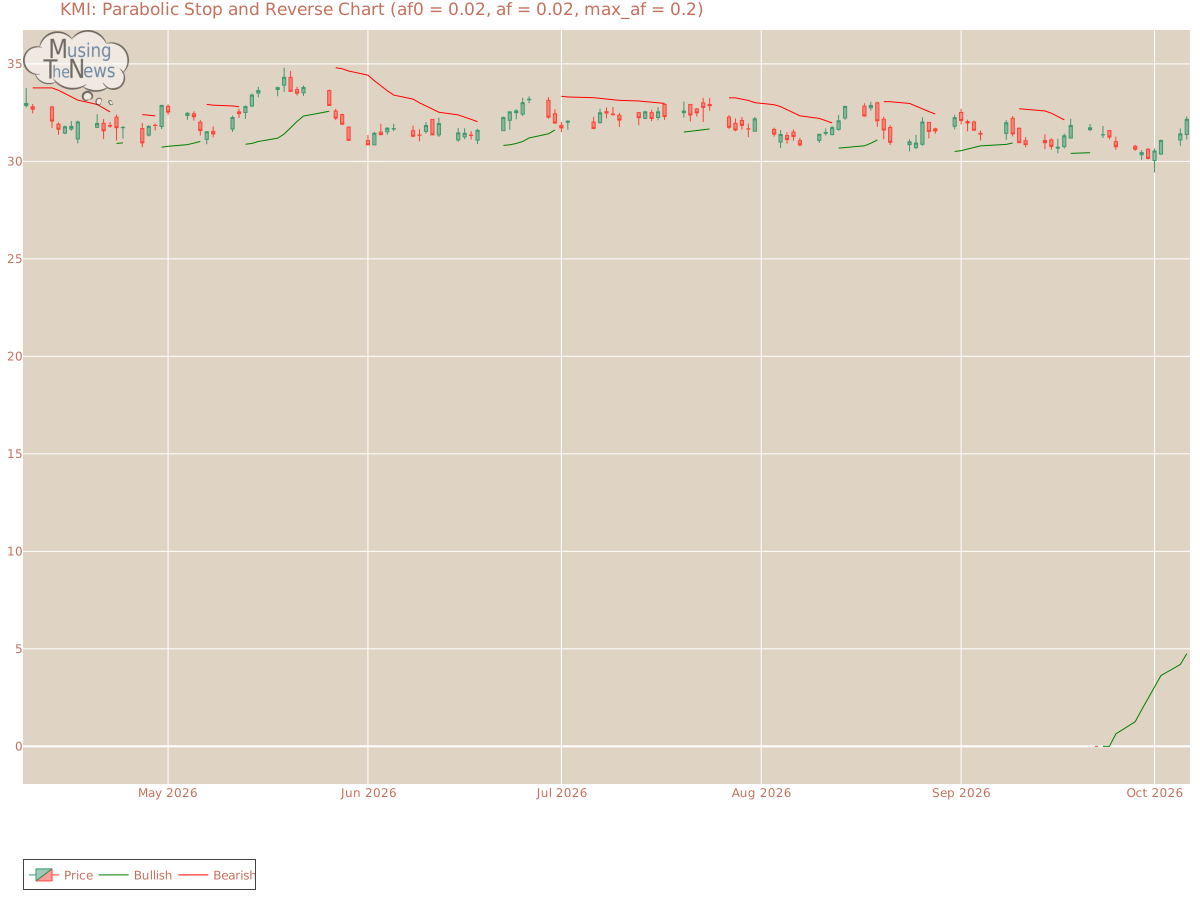
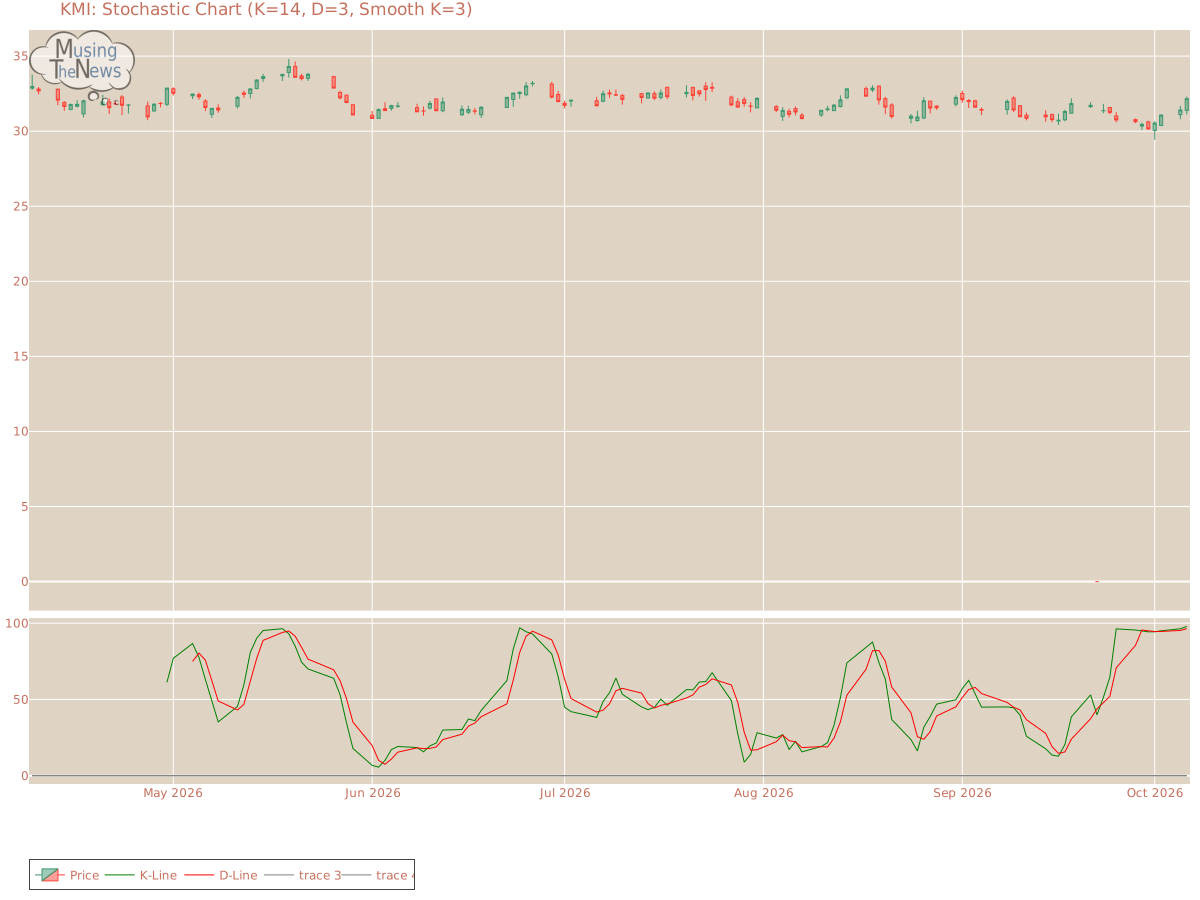
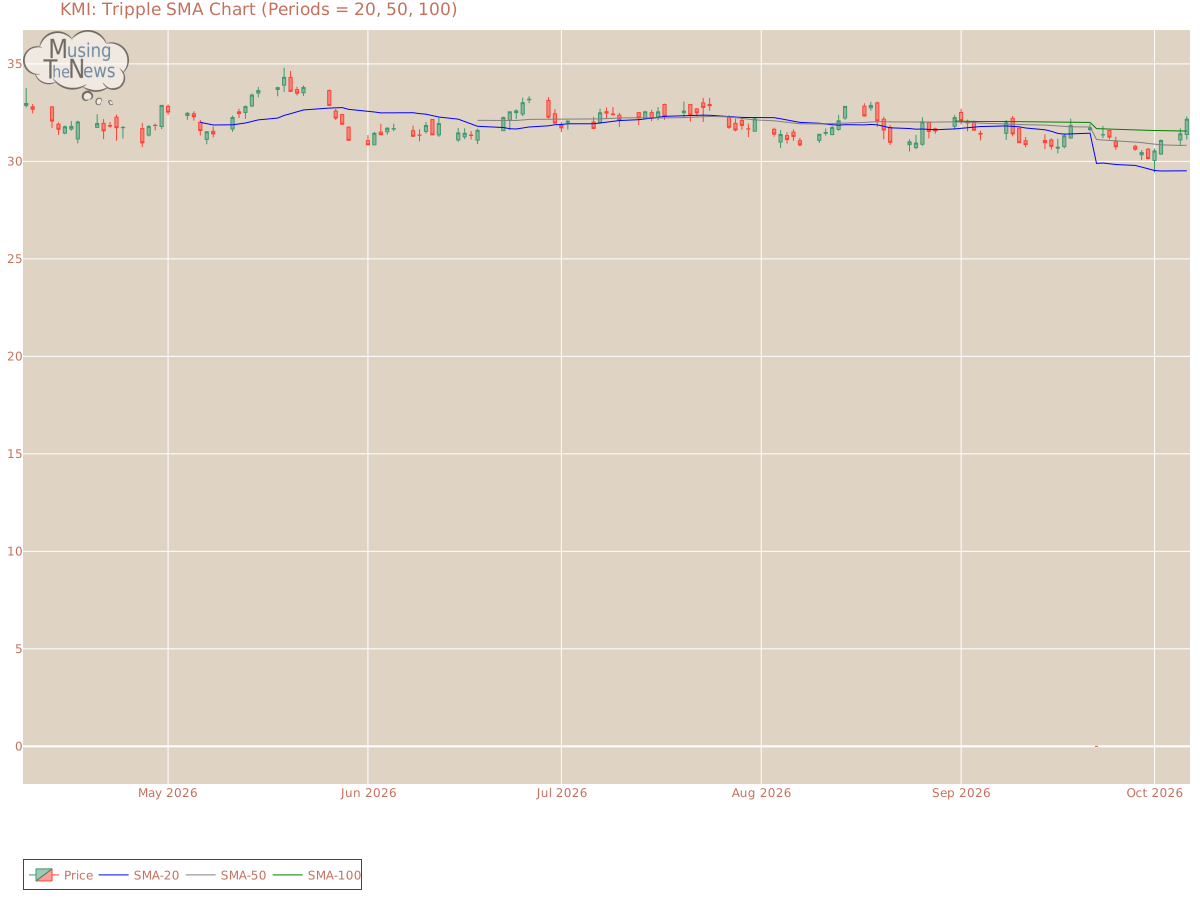
Support and Resistance: The current price of 32.16 is supported at 31.65, with resistance at 33.19. This suggests that the price for KMI might remain between these levels, where 31.65 acts as a floor and 33.19 as a ceiling in the market.Support/Resistance for KMIAroon: The AROON indicator is showing a significant bullish trend, as the Aroon Up has risen and the Aroon Oscillator has reversed. This suggests a potential reversal to an upward trend, indicating that market sentiment is becoming more optimistic. Investors may anticipate continued upward momentum, with the market likely to experience further gains.Aroon chart for Kinder Morgan, Inc.Bol. Bands: The current state of the BOLL BANDS is neutral for KMI, providing no clear indication of a trend in either direction. This suggests that the market may be lacking momentum, making it difficult to predict future movements.Bolinger Bands chart for Kinder Morgan, Inc.Parabolic SAR: The PSAR continues to be bullish for KMI, setting a strong support level that could sustain the ongoing upward trend. This level of support indicates that the market is likely to continue its positive trajectory, offering a base for continued bullish movement.Parabolic Stop and Reverse chart for Kinder Morgan, Inc.Stochastic: The stochastic indicator is currently bullish, with the K-line exceeding both the D-line and the 80 level. This configuration indicates robust upward momentum, suggesting that the market may experience further gains. Investors may interpret this as a positive signal for continued upward movement.Stochastic chart for Kinder Morgan, Inc.Tripple Moving Agerage: The 20-50-100 period moving averages suggest a bullish trend, but the slopes of the faster averages indicate that this strength may be weakening. The potential for a reversal is becoming apparent, as the shorter-term averages show signs of fading momentum, suggesting that a trend change could be imminent.Tripple SMA chart for Kinder Morgan, Inc. To make the most of a company's technical analysis, it's important to start with an understanding of its fundamentals. These include profitability, cash flow, and competitive positioning. Additionally, the industry in which the company operates plays a critical role, as trends and external factors can influence its market performance. By considering both the company's internal fundamentals and the external industry environment, more meaningful and accurate conclusions can be drawn from the technical data.
Kinder Morgan Inc.KMI share priceKMI technical chartKMI stock chartKMI techncal analysisKMI price trendsKMI stock signalsKMI stock pricestock marketNSE stock chart