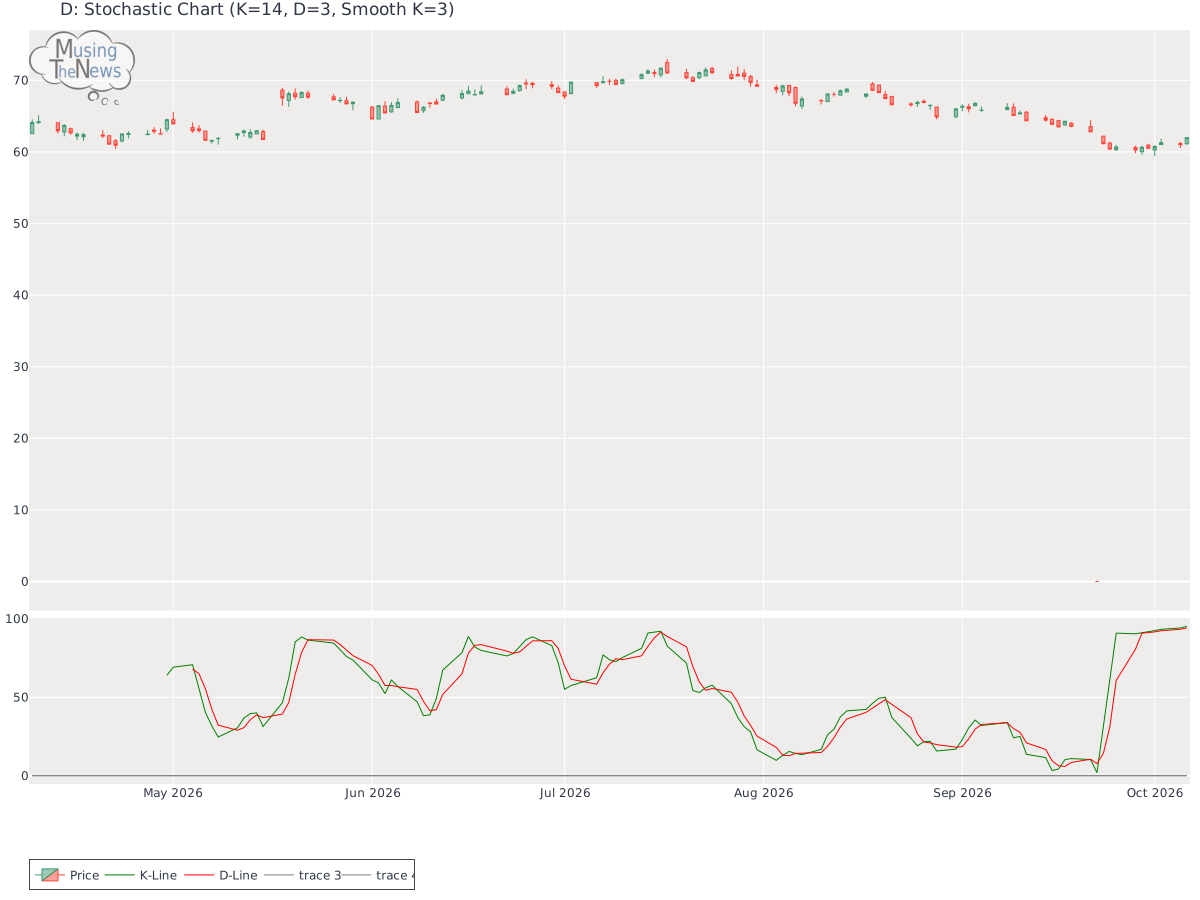
The stochastic indicator shows bullish conditions, with the K-line positioned above the D-line and exceeding the 80 level. This setup suggests strong upward momentum, indic...
By MusingTheNews
Updated 2026-10-07 23:26:08
Overall Technical outlook
Price Summary
On 2026-10-06, Dominion Energy, Inc.'s stock opened at 61.14, peaked at 62.08, hit a low of 61.01, and closed 1.41% higher at 62.0, with 3897800 shares changing hands. In the 52-week period, the stock's peak price is 71.69, and the lowest price recorded is 0.0.
Technicals
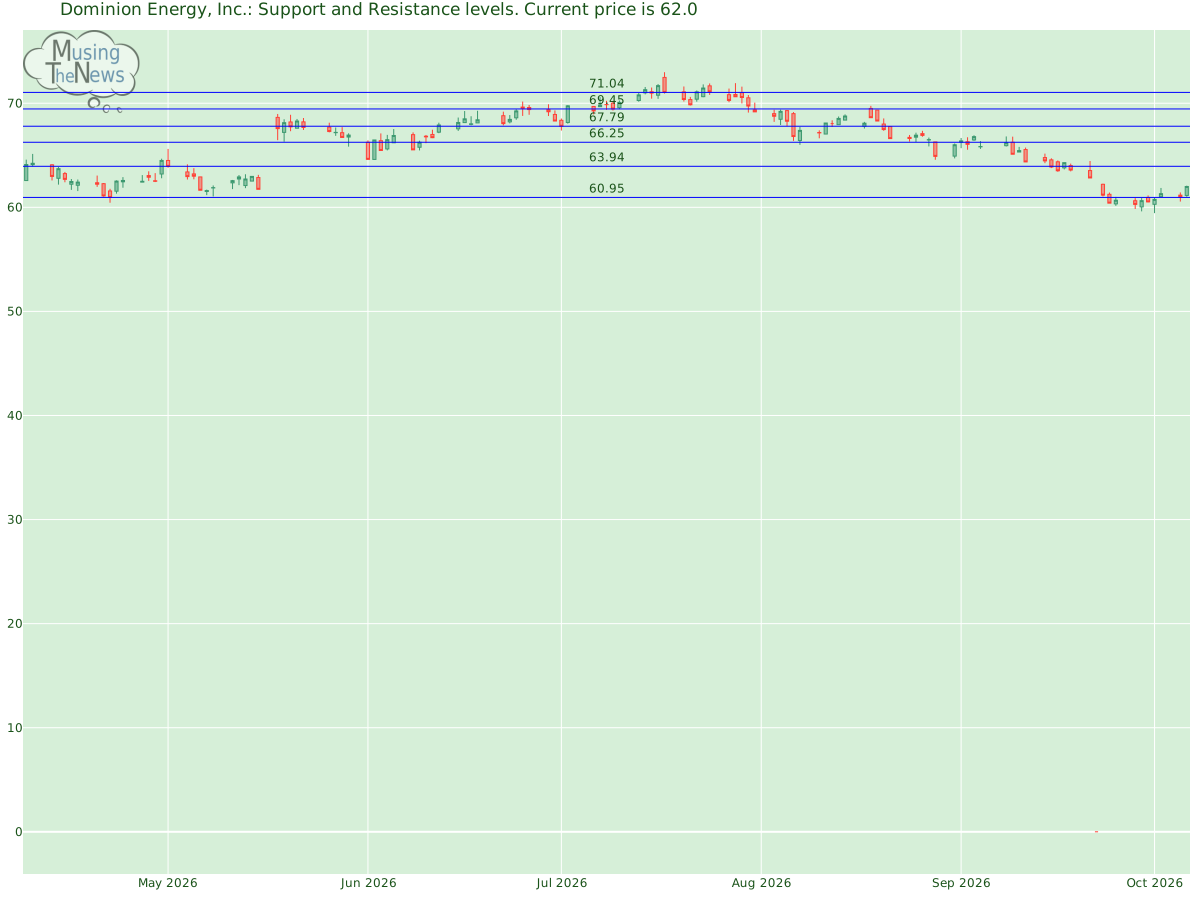
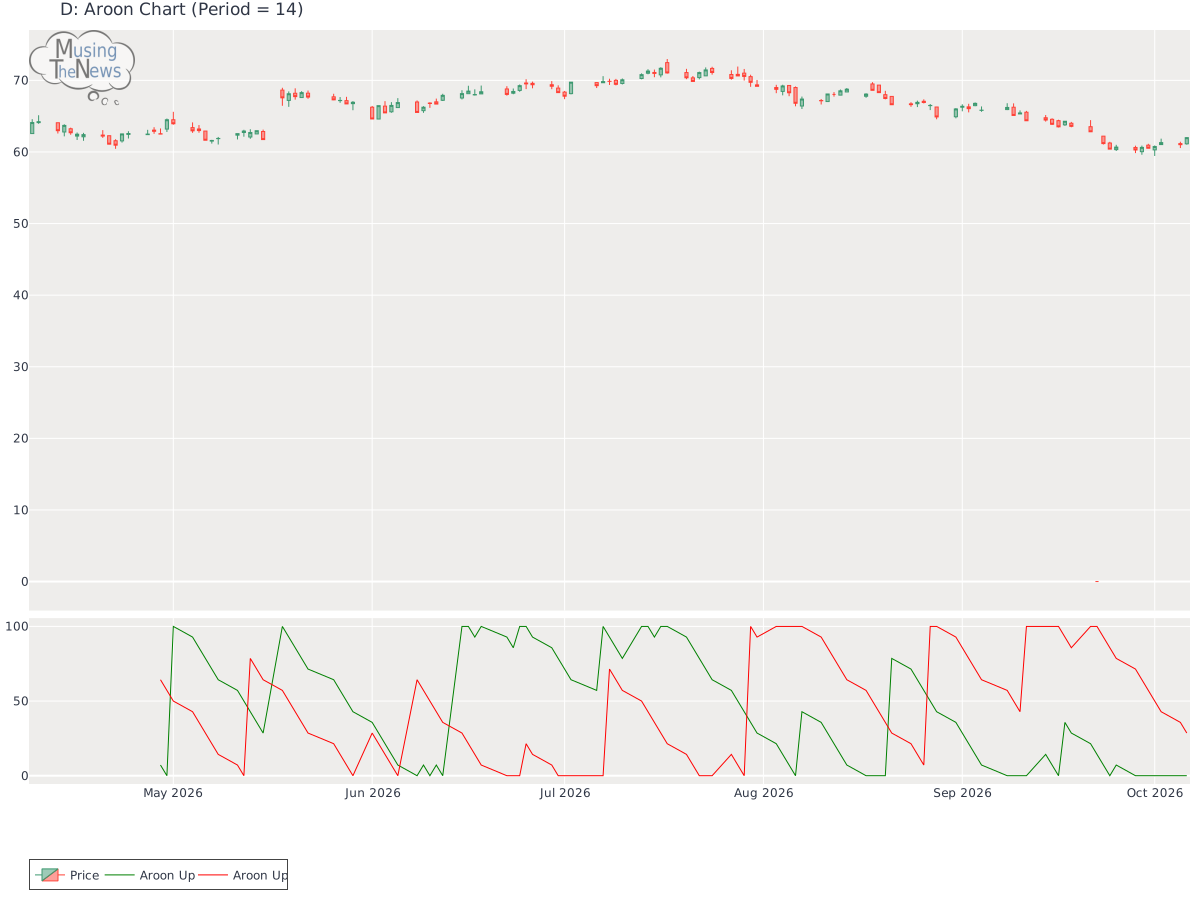
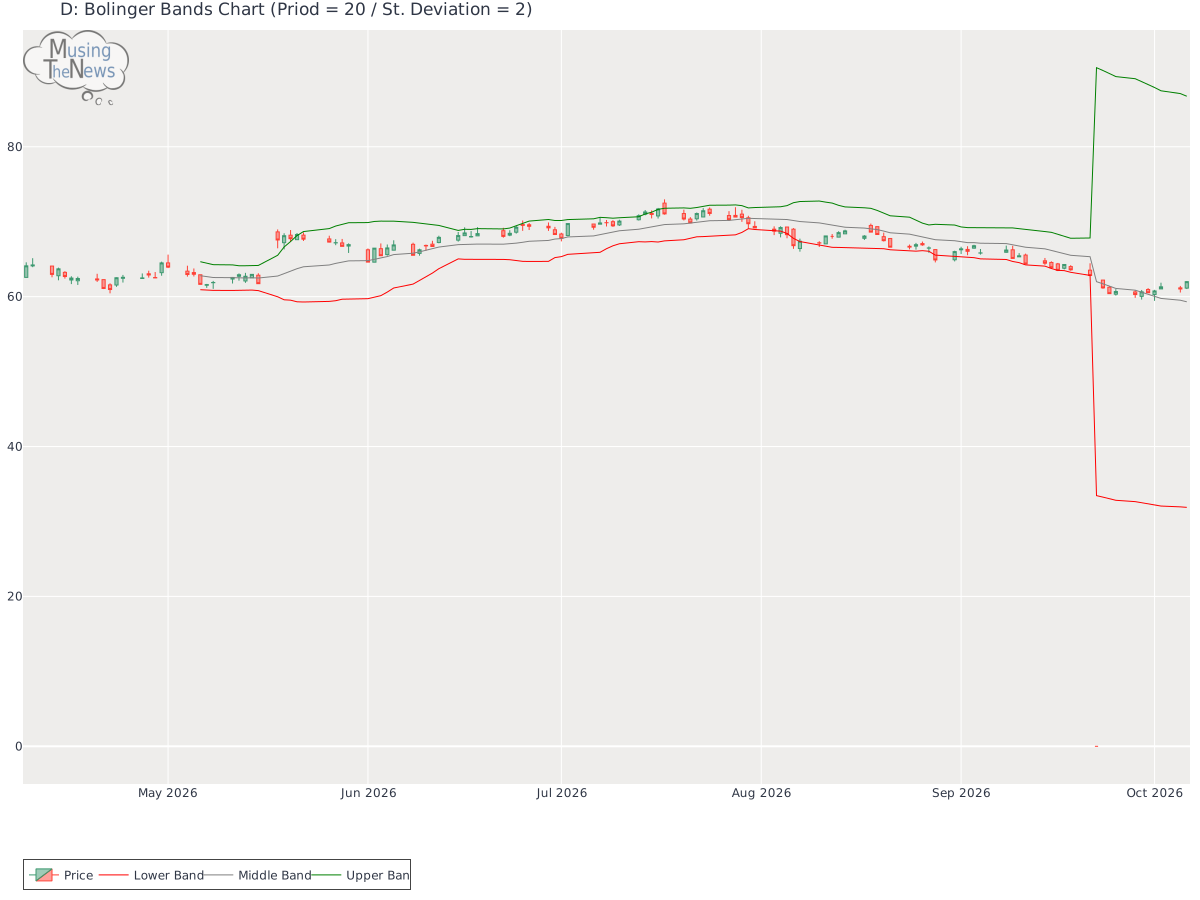
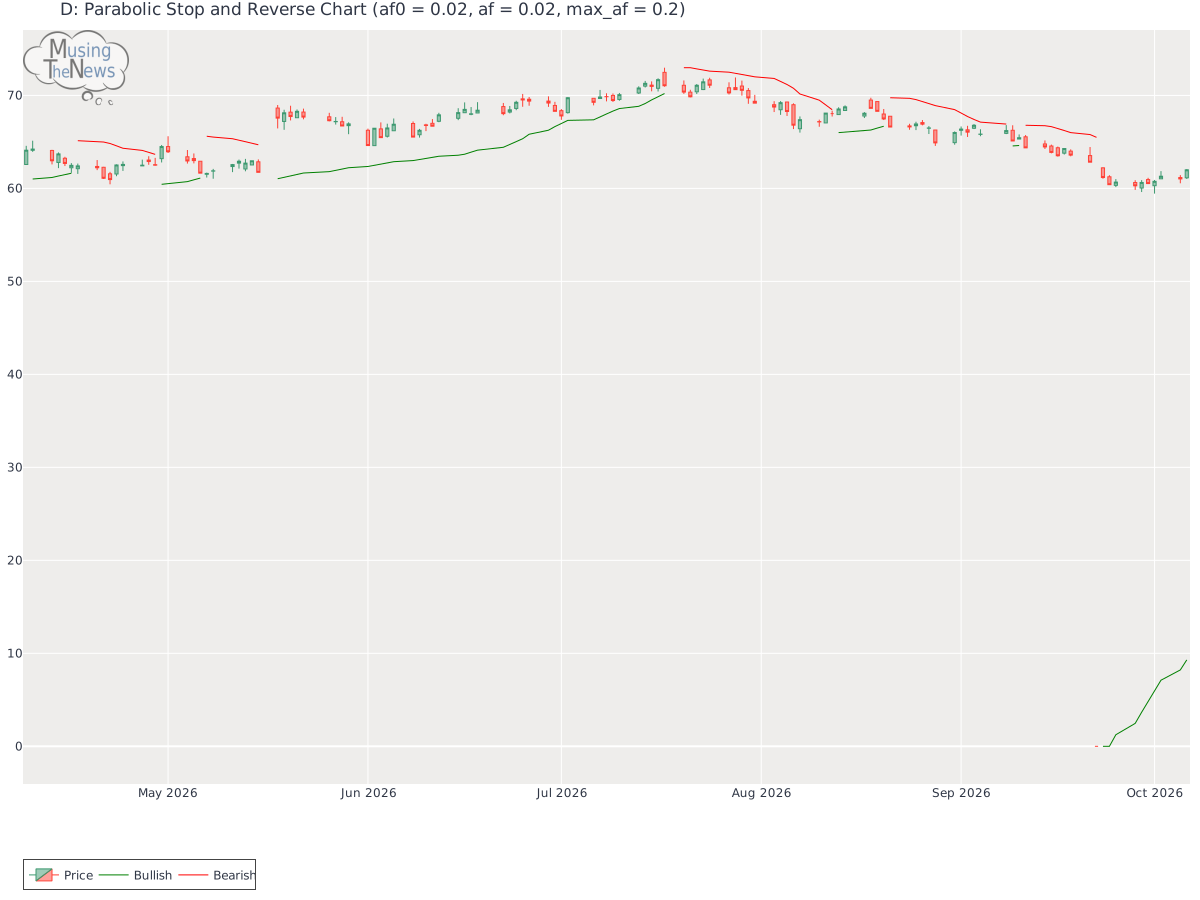
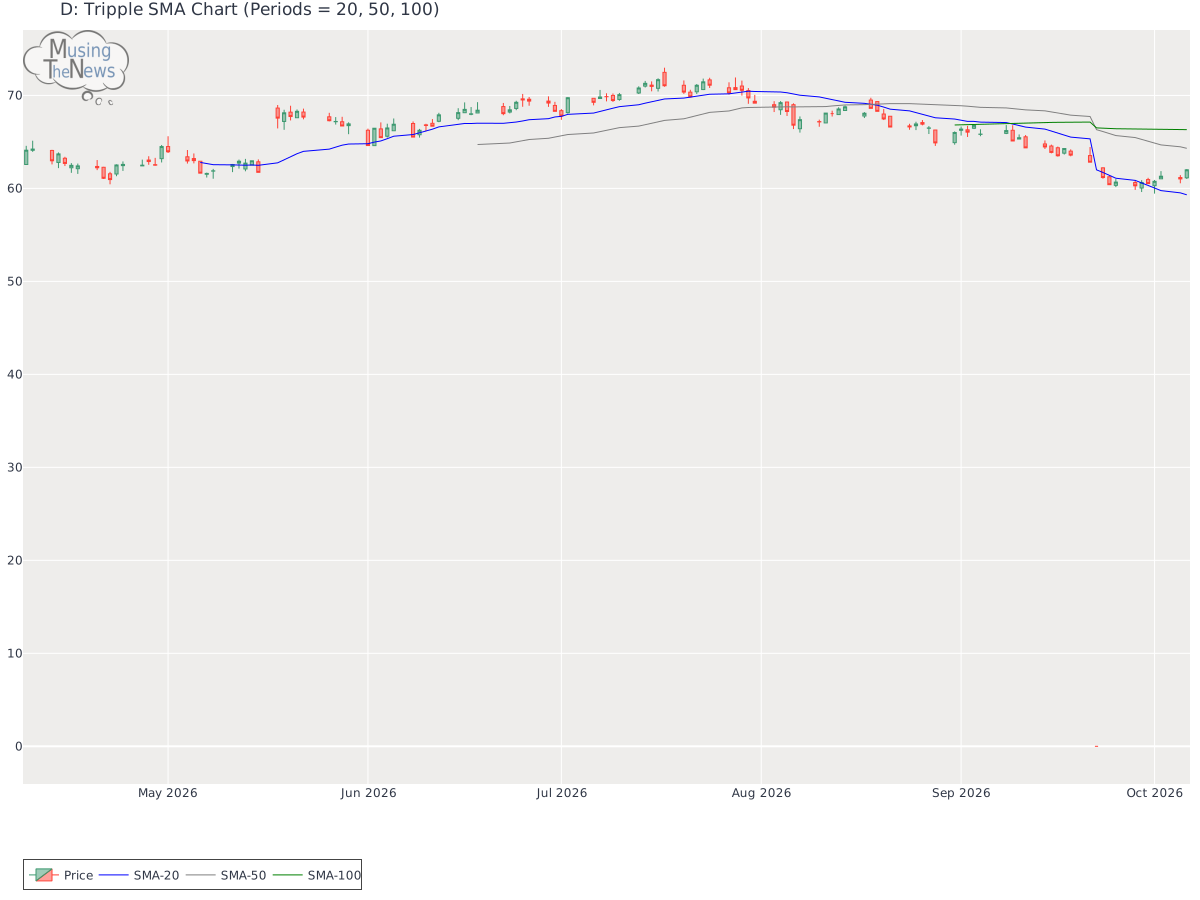
Support and Resistance: The price of 62.0 is supported at 60.95 and faces resistance at 63.94. This range suggests key levels for D where the price may stabilize, with 60.95 acting as a support and 63.94 as a cap on gains.Support/Resistance for DAroon: The current reading of the AROON is neutral for D, with no clear signals for an upward or downward trend. This indicates that the market may be in a state of uncertainty, with no dominant force driving the direction.Aroon chart for Dominion Energy, Inc.Bol. Bands: The current reading of the BOLL BANDS indicator suggests a neutral stance, with no clear signals indicating an upward or downward direction. This lack of directional bias suggests the market may be in a period of consolidation or uncertainty.Bolinger Bands chart for Dominion Energy, Inc.Parabolic SAR: The PSAR remains bullish in its outlook, establishing a key support level that could serve as a foundation for further upward movement. This persistent bullish stance suggests that the market may continue to trend higher, with the established support providing a potential safety net for investors.Parabolic Stop and Reverse chart for Dominion Energy, Inc.Stochastic: The stochastic indicator shows bullish conditions, with the K-line positioned above the D-line and exceeding the 80 level. This setup suggests strong upward momentum, indicating that the market may continue to rise. Investors might view this as a favorable sign for continued growth.Stochastic chart for Dominion Energy, Inc.Tripple Moving Agerage: The 20-50-100 period moving averages suggest a bullish trend, though the weakening slopes of the shorter-term averages raise concerns about a potential reversal. While the overall momentum is still upward, the indications from the faster averages suggest that the trend might be nearing its end, warranting caution.Tripple SMA chart for Dominion Energy, Inc. When evaluating a company's technical data, such as stock price charts or volume, it is essential to first consider its fundamentals. These fundamentals include financial stability, growth potential, and competitive advantages. Additionally, understanding the broader industry in which the company operates offers context that helps to make sense of technical patterns. By examining both the company's internal strengths and external environment, one can make more accurate and meaningful conclusions about its stock performance.