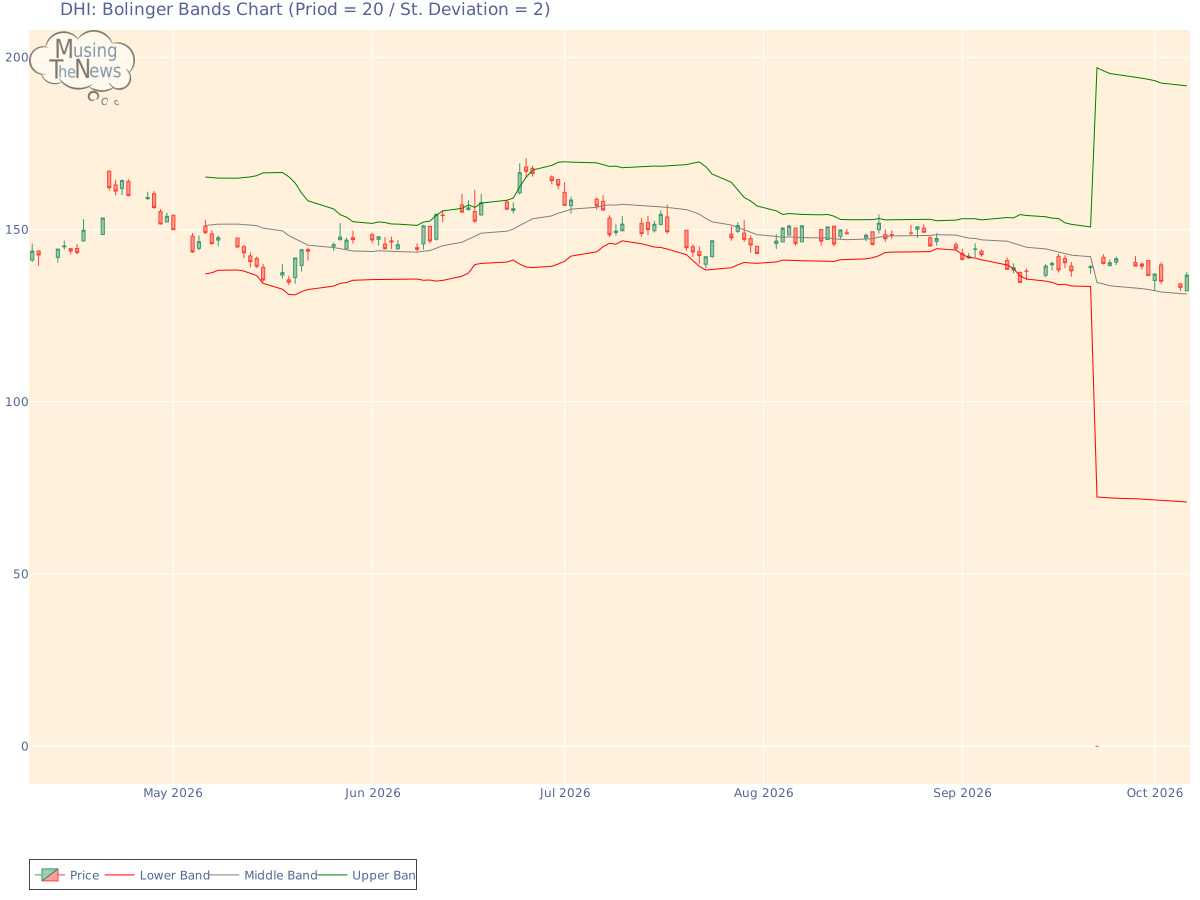
The BOLL BANDS is currently in a neutral position for D.R. Horton, Inc., offering no clear guidance on whether the market is likely to move up or down. This neutral stance ...
By MusingTheNews
Updated 2026-10-07 23:26:09
Overall Technical outlook
Price Summary
D.R. Horton, Inc.'s stock saw a 3.43% jump, showcasing an remarkable market day. D.R. Horton, Inc.'s stock started trading at 132.21 on 2026-10-06, climbed to 137.64, fell to 132.21, and closed 3.43% higher at 136.75, with 4934400 shares traded. In the 52-week period, the stock's peak price is 167.78, and the lowest price recorded is 0.0.
Technicals
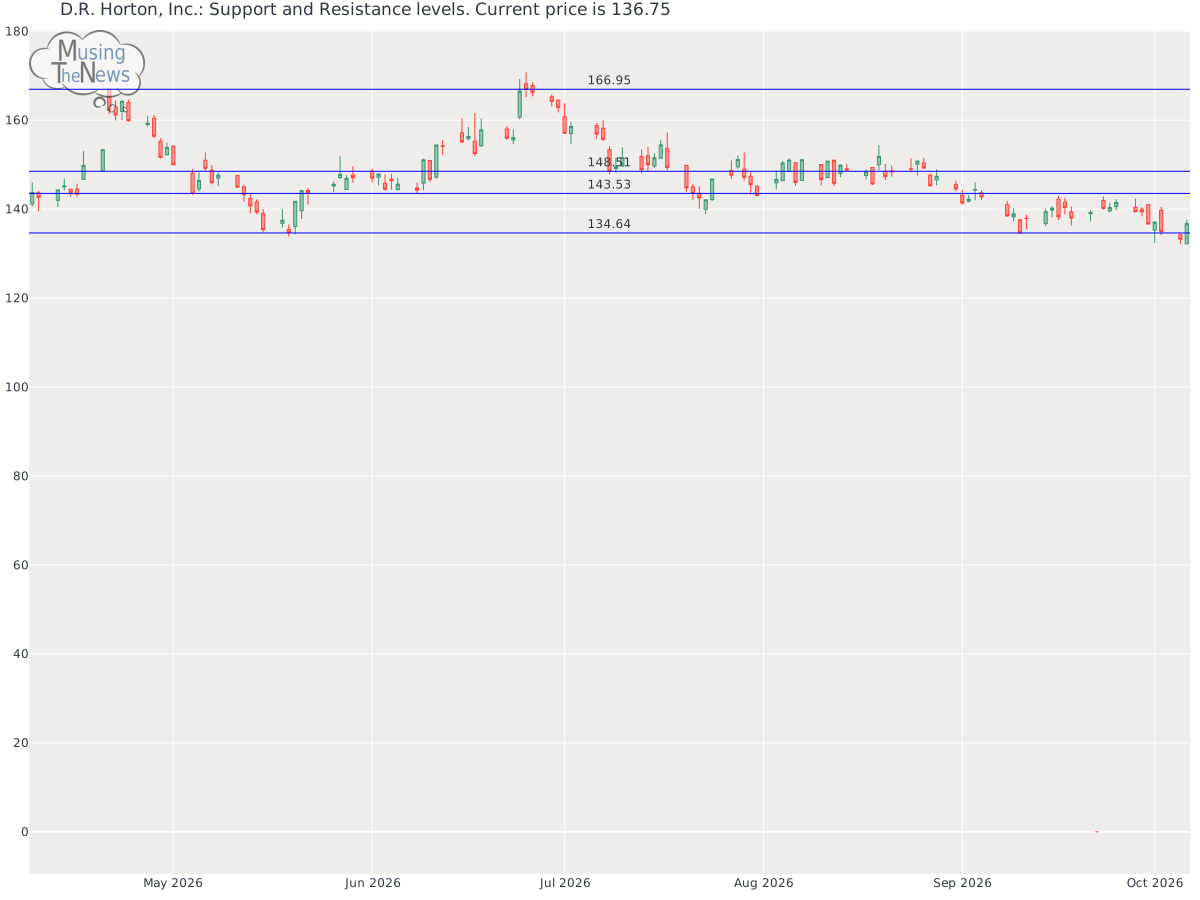
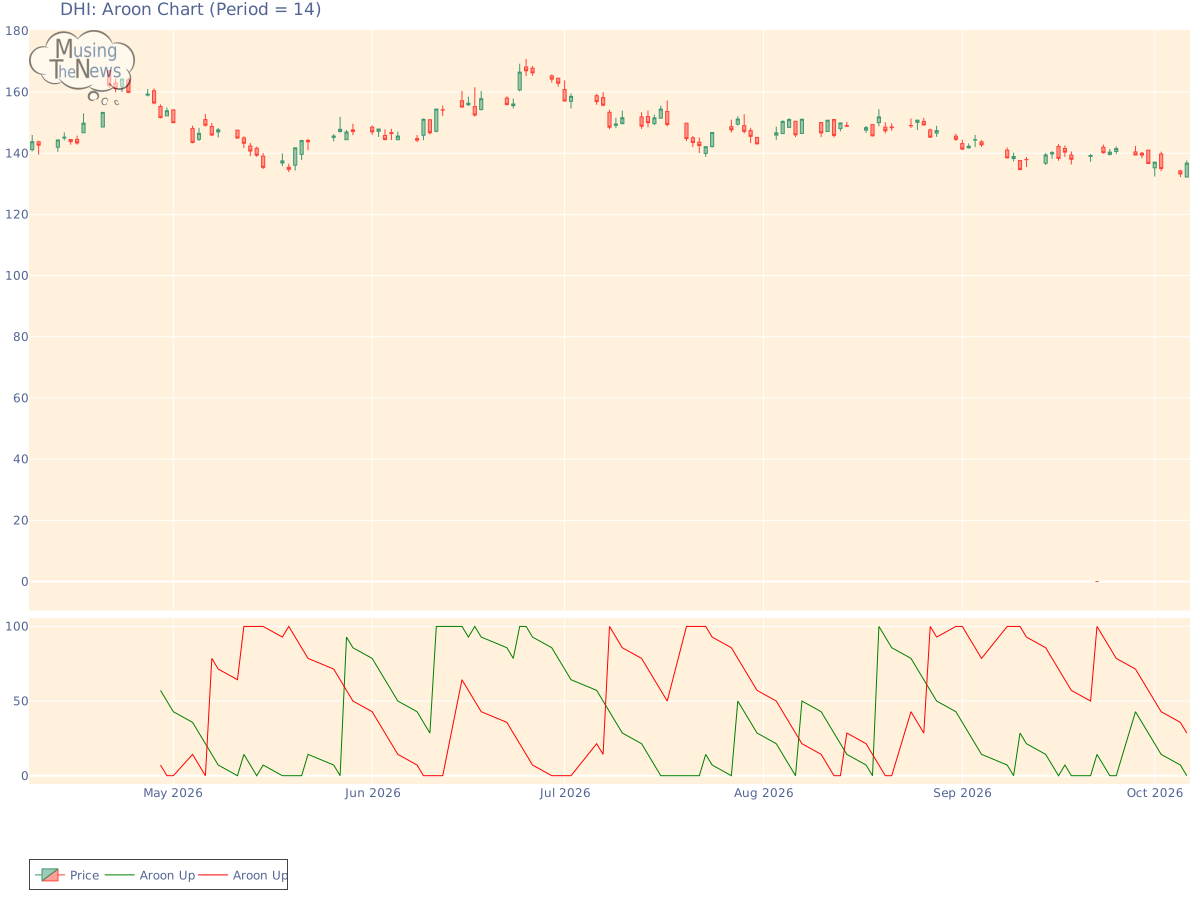
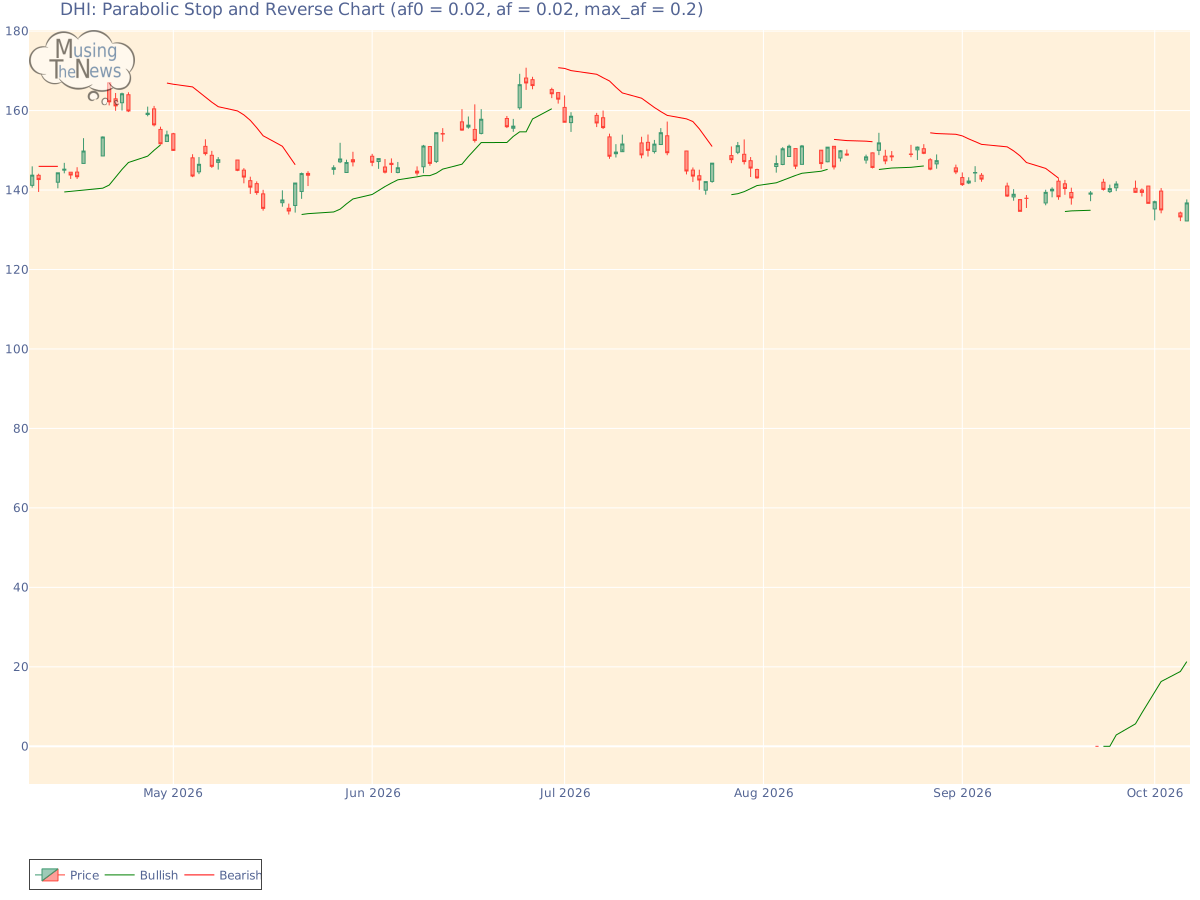
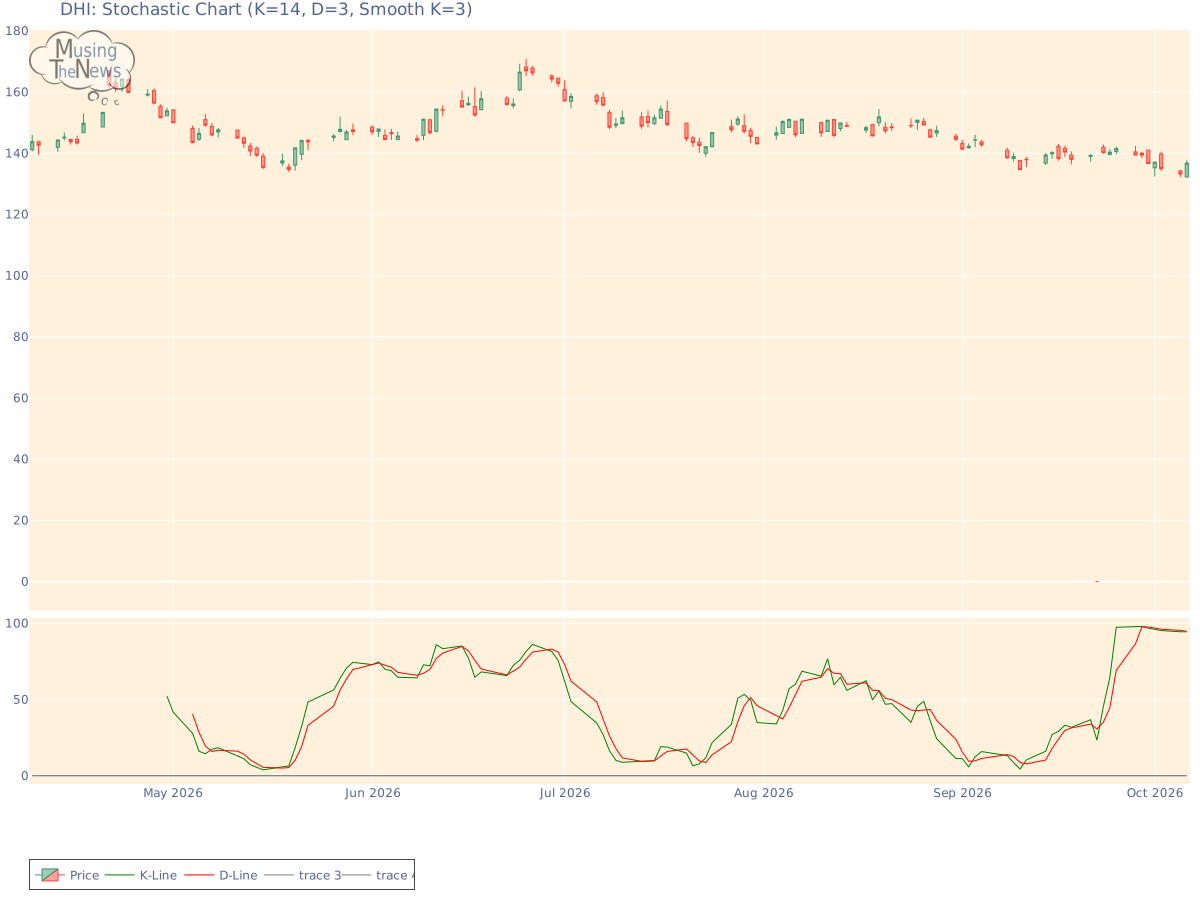
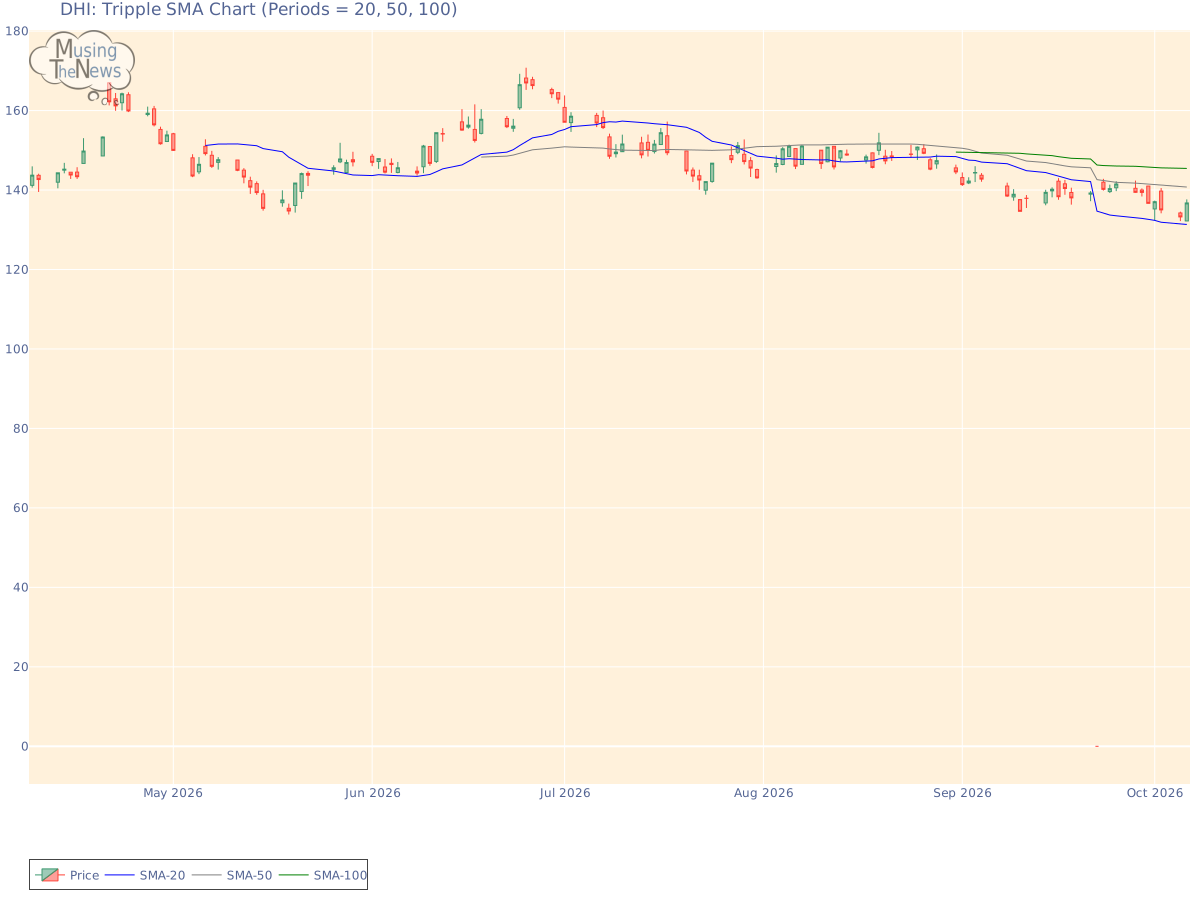
Support and Resistance: The price of 136.75 is supported at 134.64 and encounters resistance at 143.53. This suggests key levels where the price might find stability, with 134.64 providing a base and 143.53 acting as an upper boundary for DHI.Support/Resistance for DHIAroon: The current state of the AROON is neutral for DHI, providing no clear indication of a trend in either direction. This suggests that the market may be lacking momentum, making it difficult to predict future movements.Aroon chart for D.R. Horton, Inc.Bol. Bands: The BOLL BANDS is currently in a neutral position for D.R. Horton, Inc., offering no clear guidance on whether the market is likely to move up or down. This neutral stance suggests that further observation may be necessary before a trend becomes apparent.Bolinger Bands chart for D.R. Horton, Inc.Parabolic SAR: The PSAR remains bullish, setting a critical support level that may help sustain the market's upward trend. This persistent bullish outlook suggests that the market is likely to continue climbing, with the support level offering a foundation for further growth.Parabolic Stop and Reverse chart for D.R. Horton, Inc.Stochastic: The K-line has dipped below the D-line on the stochastic indicator, even as it remains above 80, signaling the potential start of a bearish price move. This setup suggests that the market may be entering a period of weakening momentum, possibly leading to a decline. Investors should monitor the situation for additional bearish signals.Stochastic chart for D.R. Horton, Inc.Tripple Moving Agerage: A bullish trend is evident from the alignment of the 20-50-100 period moving averages, but the slopes of the faster averages indicate a potential reversal for DHI. The weakening signals from the shorter-term averages suggest that the upward momentum may be fading, signaling the possibility of an impending change in trend.Tripple SMA chart for D.R. Horton, Inc. Understanding a company's fundamentals—such as revenue, earnings, and debt levels—provides a solid foundation for analyzing its technical performance. Similarly, knowledge of the industry, including key competitors and market trends, is critical. Combining this fundamental analysis with technical indicators like stock charts, moving averages, and trading volume enables a more comprehensive approach to evaluating the company's overall health and potential future performance.