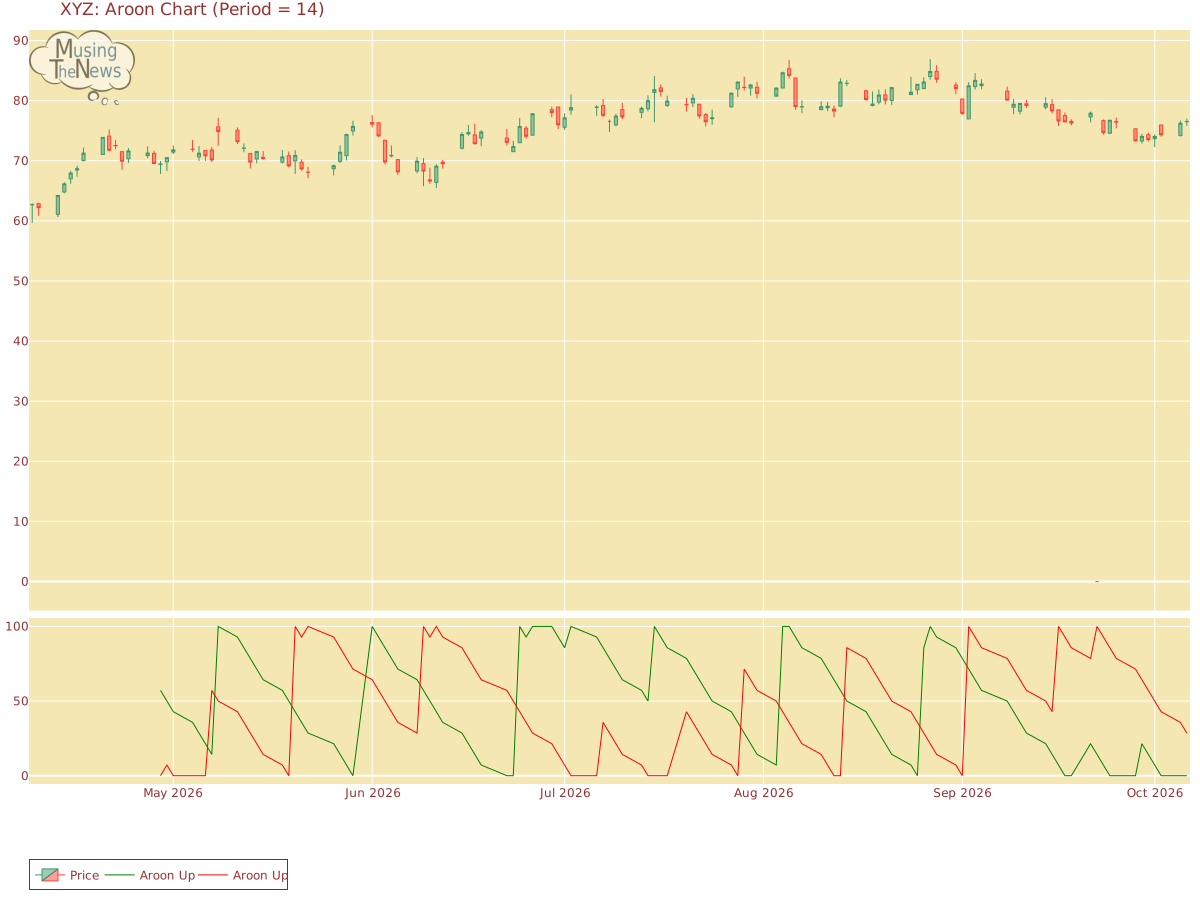
The AROON is currently in a neutral position for Block, Inc., offering no clear guidance on whether the market is likely to move up or down. This neutral stance suggests th...
By MusingTheNews
Updated 2026-10-07 23:25:52
Overall Technical outlook
Price Summary
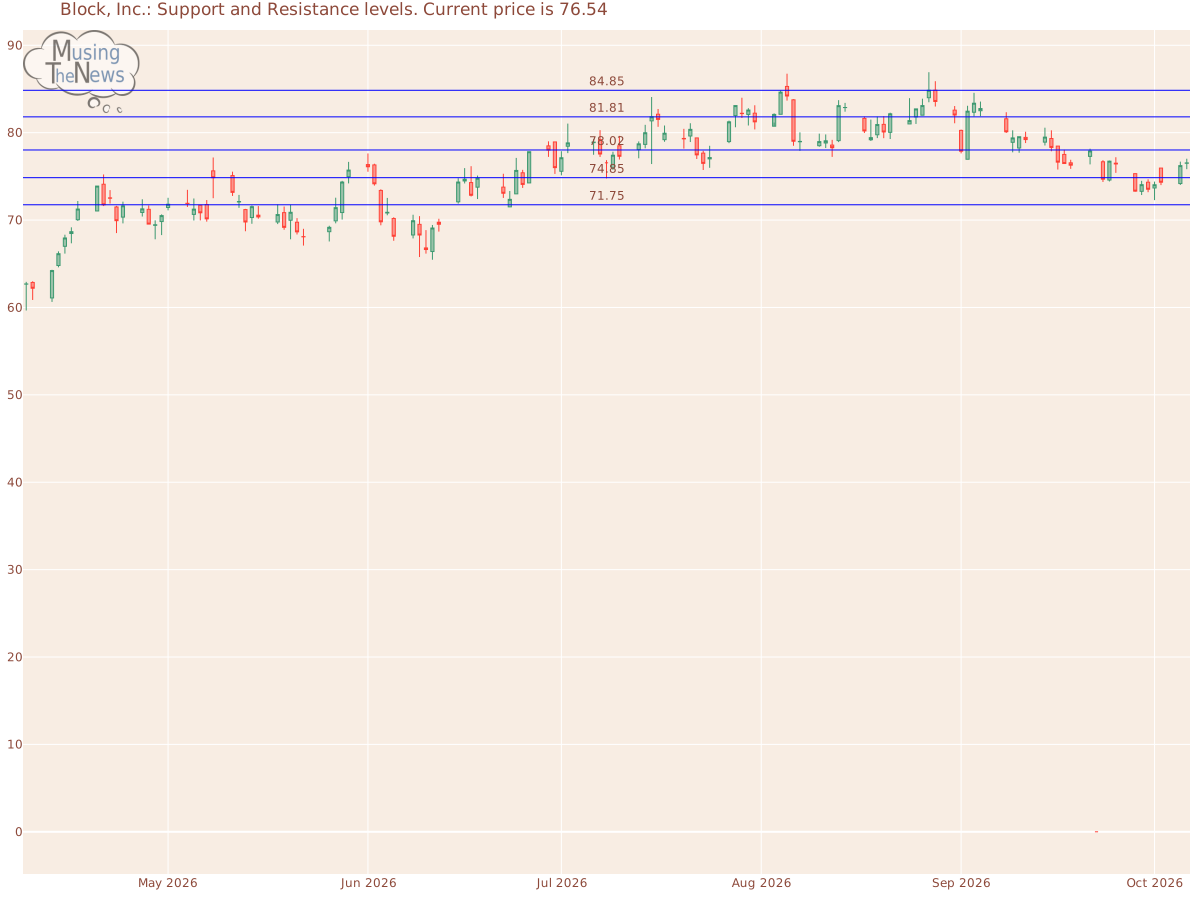
Block, Inc.'s stock started the year at 76.5, climbed to a high of 77.02, fell to 75.82, and closed 0.05% up at 76.54, with 2879000 shares traded on 2026-10-06. The highest price the stock achieved in the past 52 weeks is 84.85, while the lowest price it saw is 0.0.
Technicals
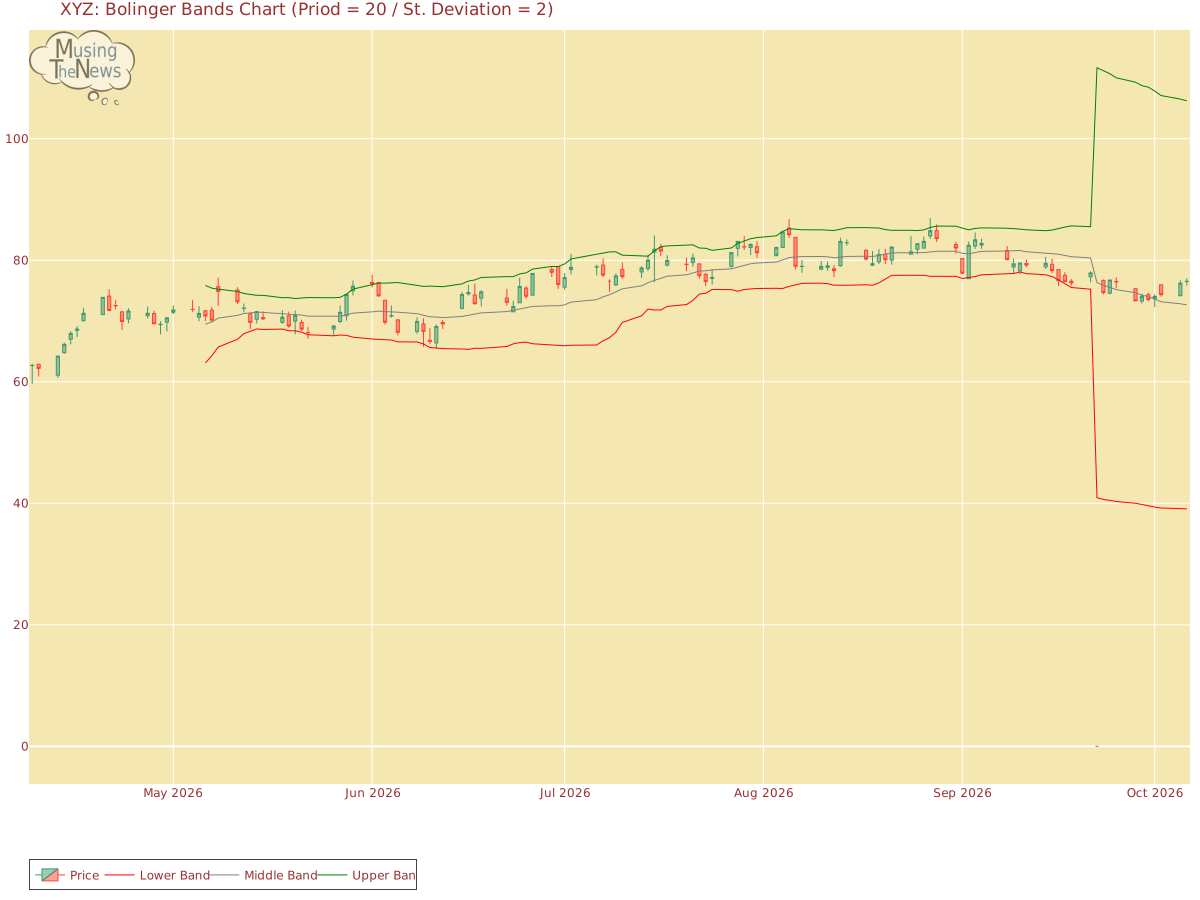
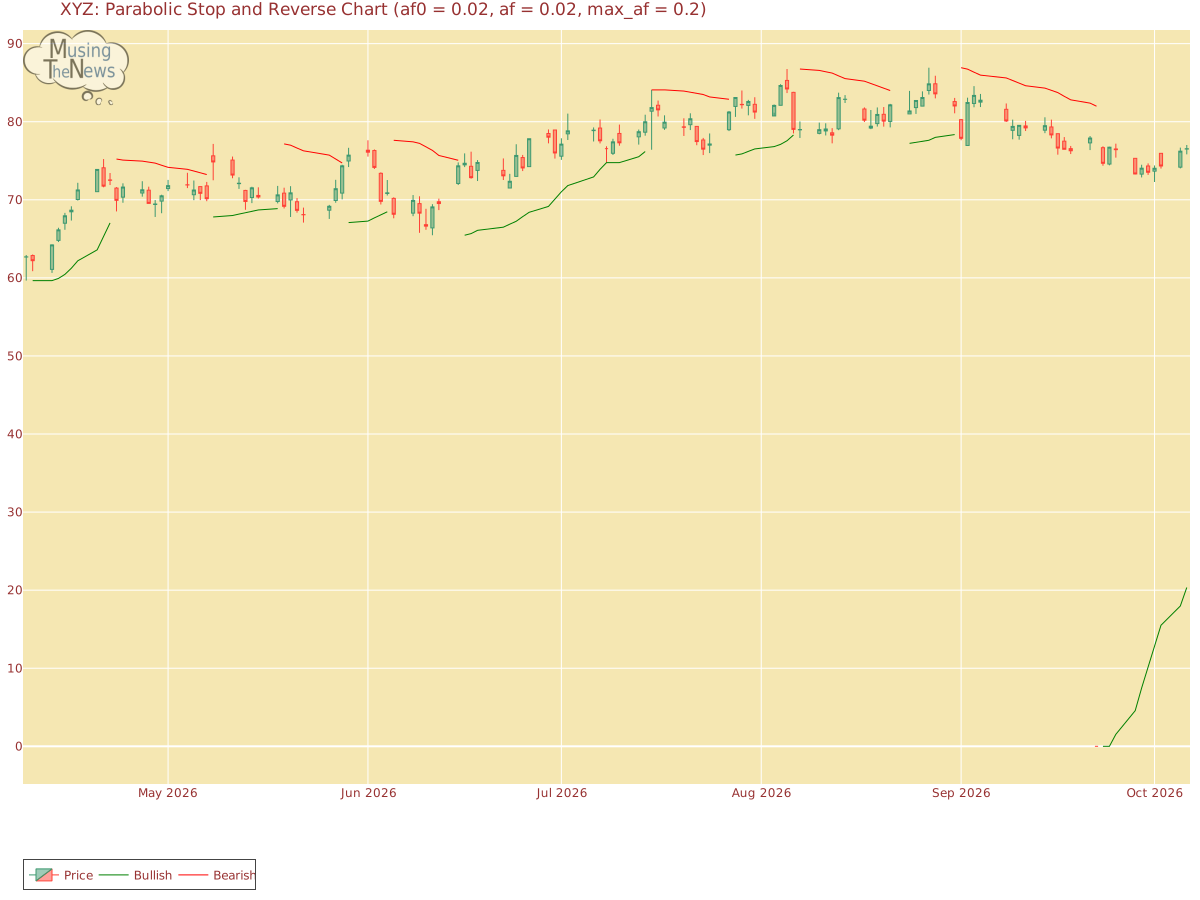
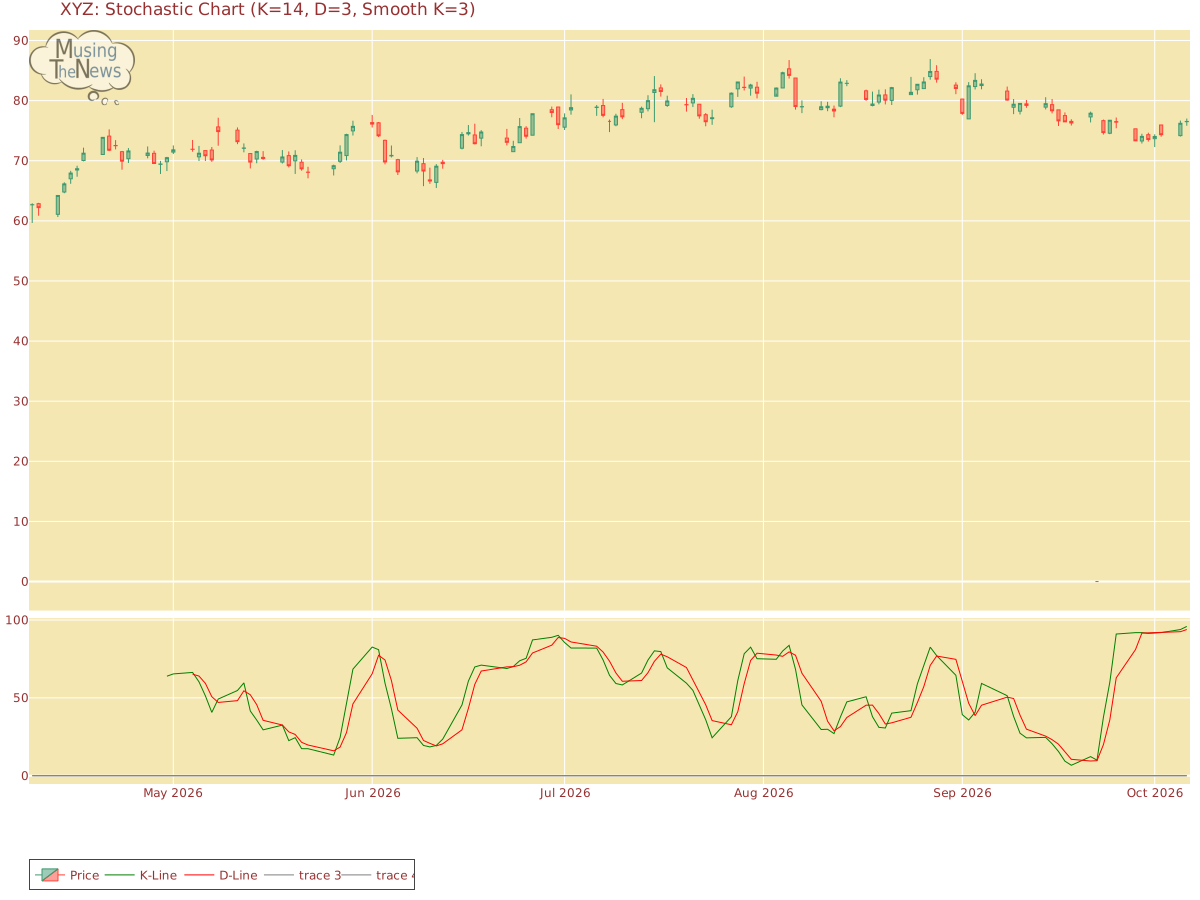
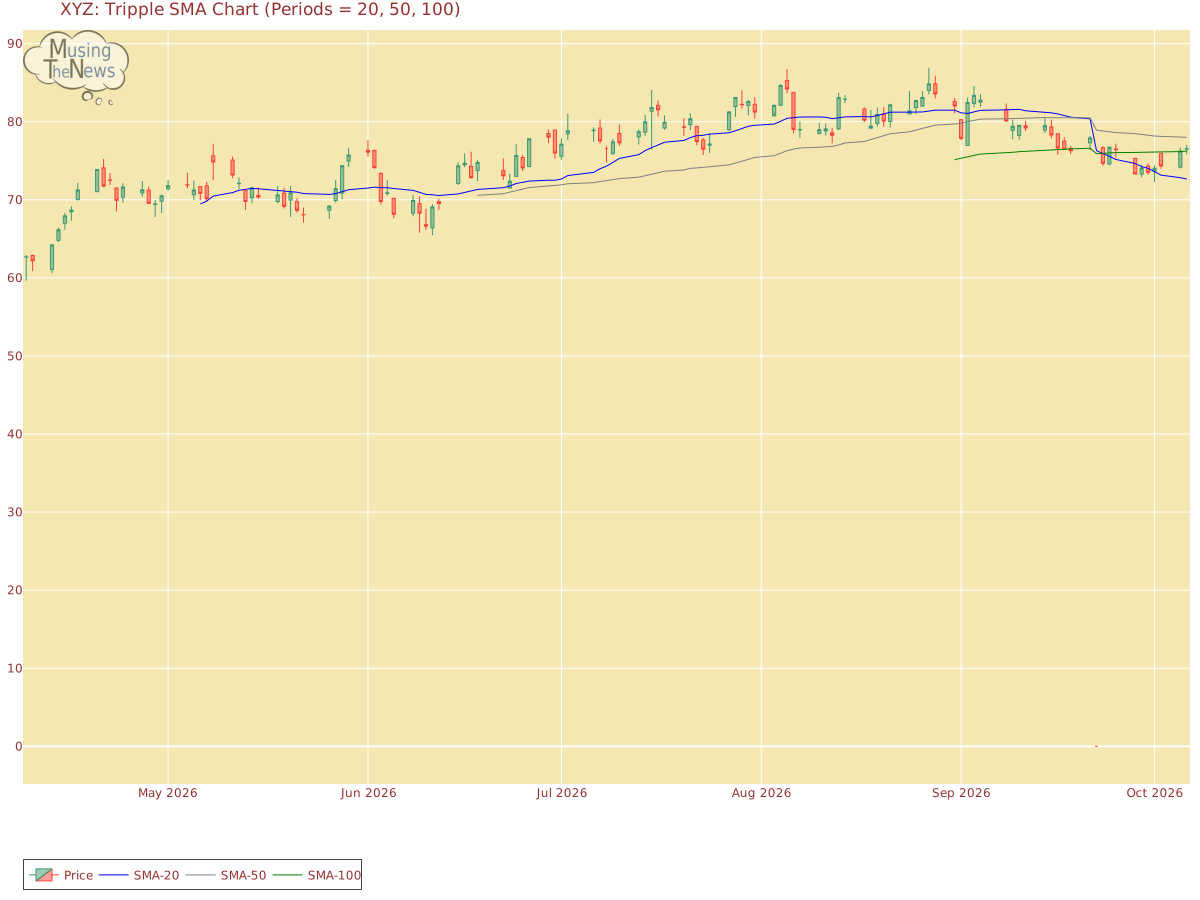
Support and Resistance: With the current price at 76.54, support is found at 74.85 and resistance at 78.02. These levels indicate where buyers might step in at 74.85, while sellers could limit gains at 78.02, defining a trading boundary for Block, Inc..Support/Resistance for XYZAroon: The AROON is currently in a neutral position for Block, Inc., offering no clear guidance on whether the market is likely to move up or down. This neutral stance suggests that further observation may be necessary before a trend becomes apparent.Aroon chart for Block, Inc.Bol. Bands: The current reading of the BOLL BANDS is neutral, offering no clear signals for a movement in either direction. This suggests that the market may be in a holding pattern, with no dominant trend in place.Bolinger Bands chart for Block, Inc.Parabolic SAR: The PSAR for XYZ continues to be bullish, establishing a crucial support level that may help maintain the current upward trend. This level of support suggests that the market is poised to continue its positive trajectory, offering a foundation for further growth.Parabolic Stop and Reverse chart for Block, Inc.Stochastic: The stochastic indicator for XYZ reflects a bullish outlook, with the K-line positioned above the D-line and surpassing the 80 mark. This setup suggests strong upward momentum, implying that the market may continue to rise. Investors may interpret this as a positive signal for further gains.Stochastic chart for Block, Inc.Tripple Moving Agerage: The Tripple MOVING AVG is currently in a neutral position for Block, Inc., offering no clear guidance on whether the market is likely to move up or down. This neutral stance suggests that further observation may be necessary before a trend becomes apparent.Tripple SMA chart for Block, Inc. A thorough analysis of a company involves looking beyond its stock price movements and trading patterns. You must also examine its fundamentals, which include profitability, growth prospects, and competitive advantages. Additionally, the industry in which the company operates provides important context, as factors like technological innovations, regulation, and market demand influence performance. By integrating this information with technical analysis, more accurate predictions about the company's future can be made.