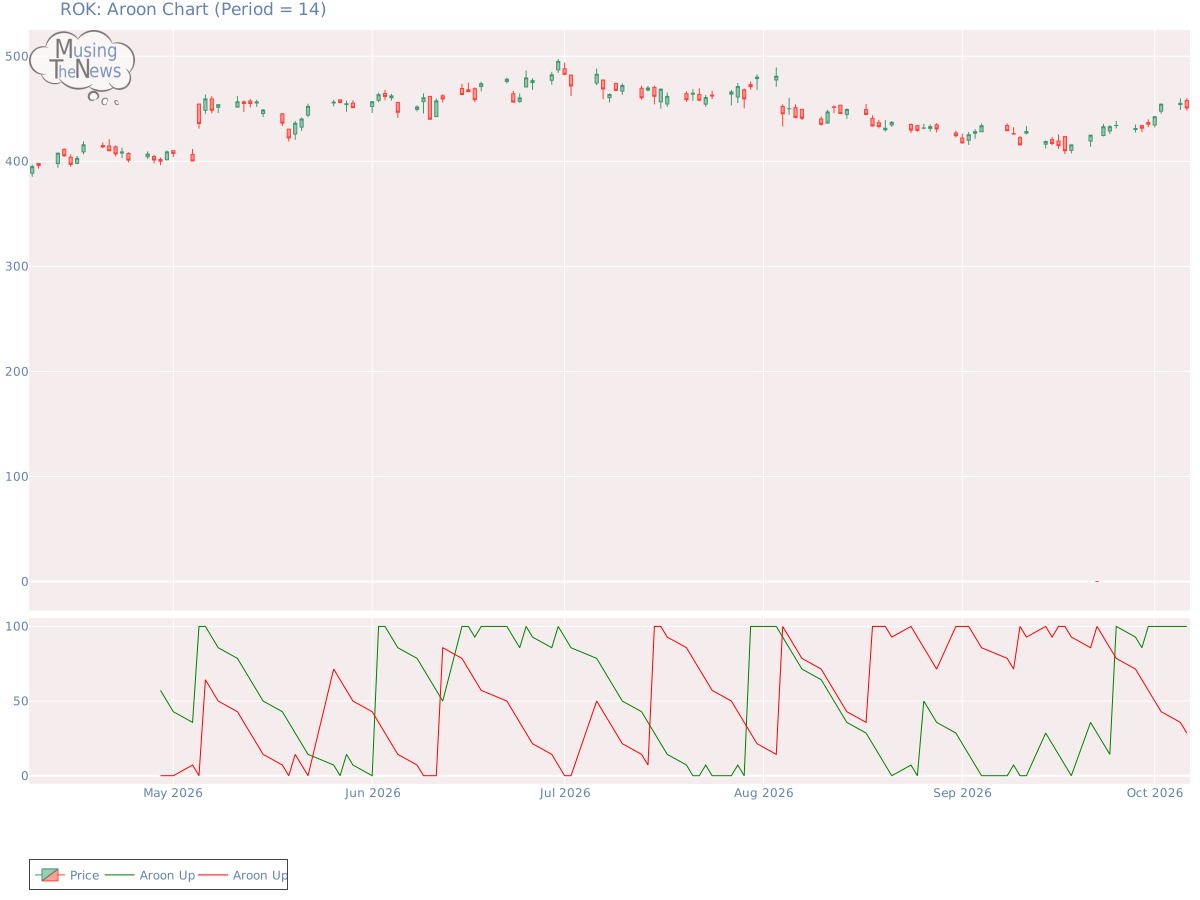
The Aroon indicator continues to show a bullish trend for Rockwell Automation, Inc., with Aroon Up holding at the 100 level. This suggests strong upward momentum, but the t...
By MusingTheNews
Updated 2026-10-07 23:26:51
Overall Technical outlook
Price Summary
2026-10-06, saw ROK's stock open at 457.92, hit a peak of 460.2, fall to a low of 448.45, and close down -1.57% at 450.74, with 574600 shares changing hands. The highest price the stock achieved in the past 52 weeks is 495.08, while the lowest price it saw is 0.0.
Technicals
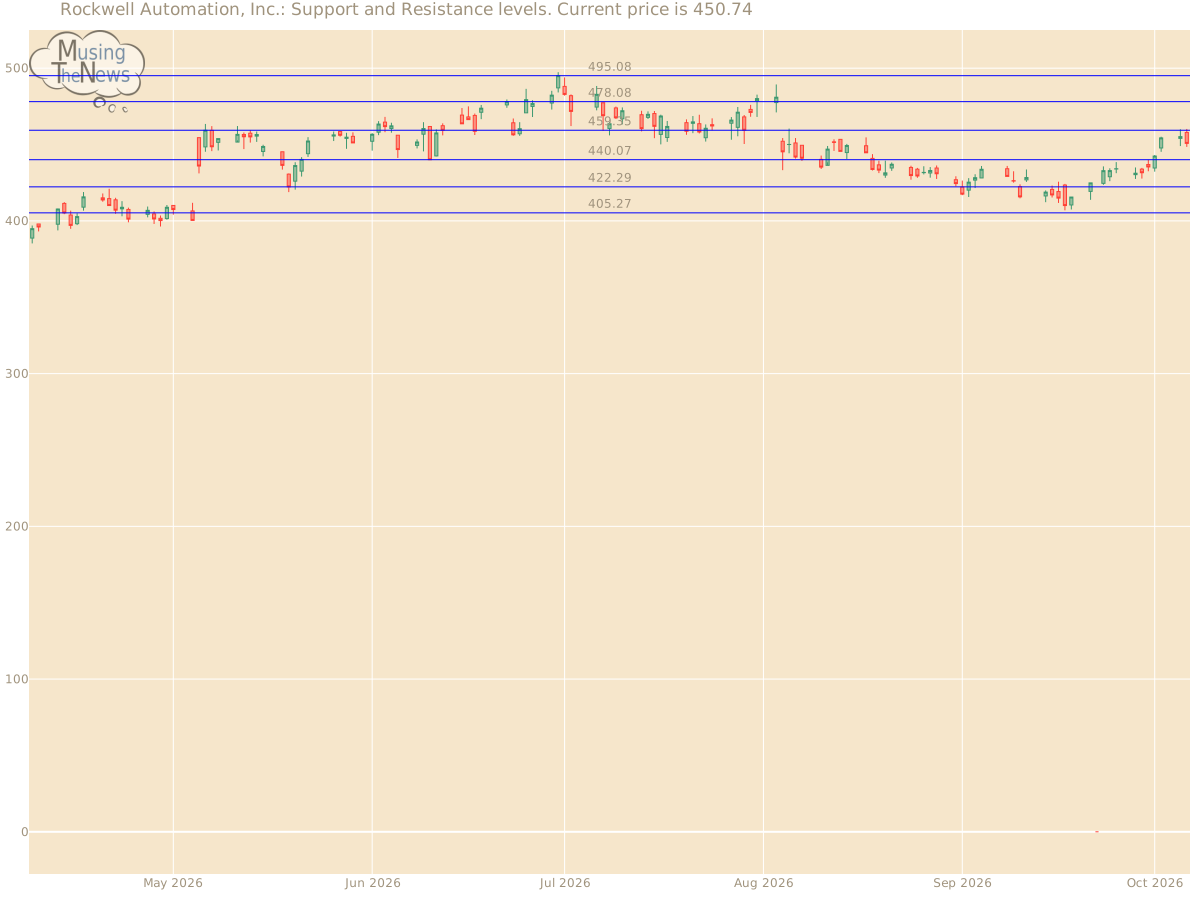
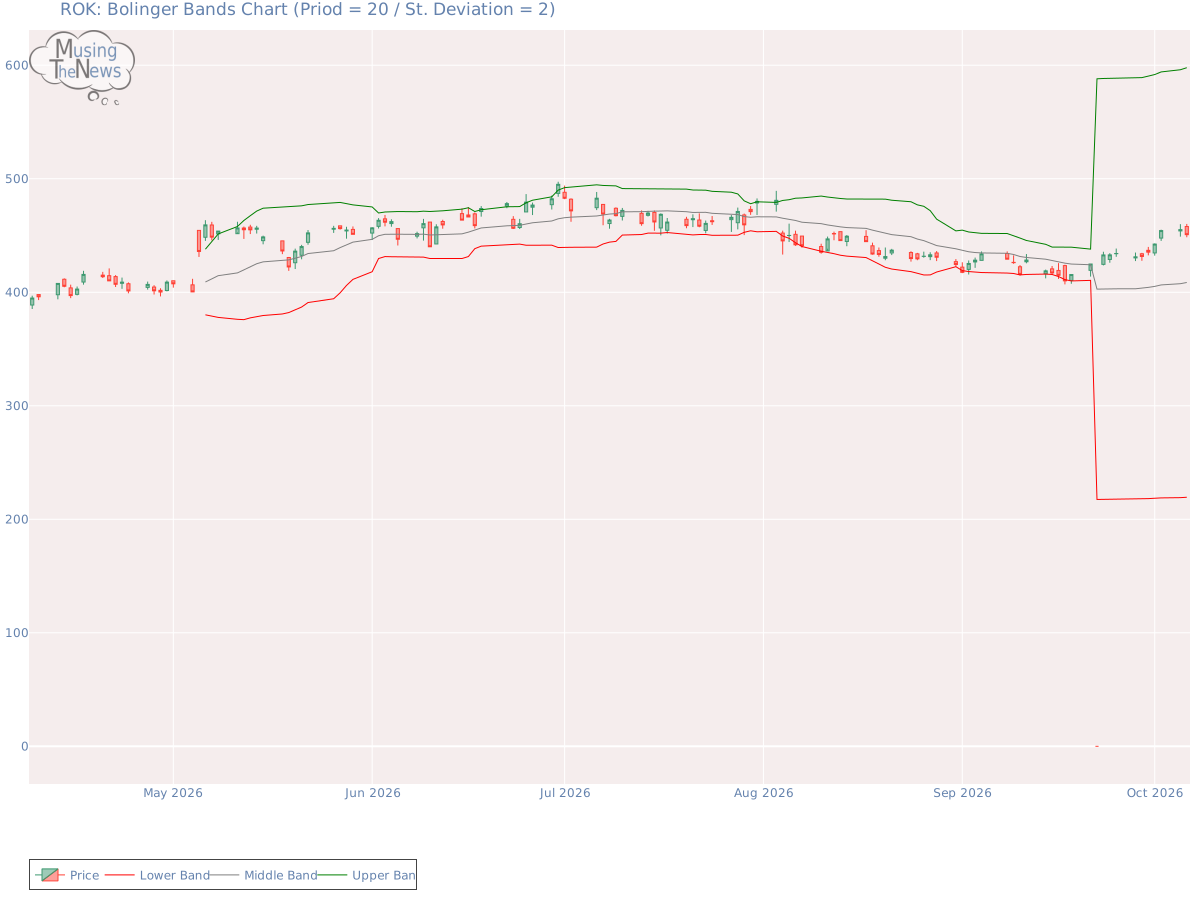
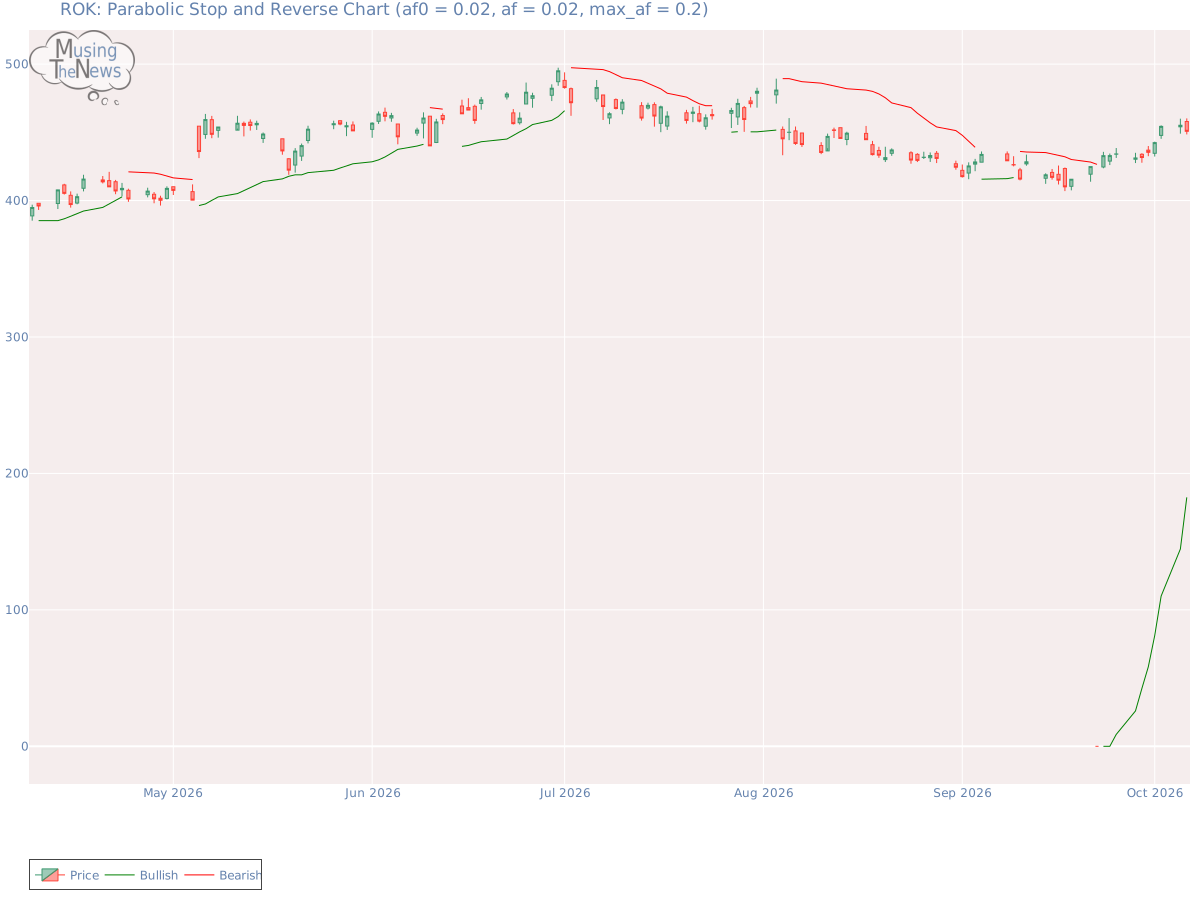
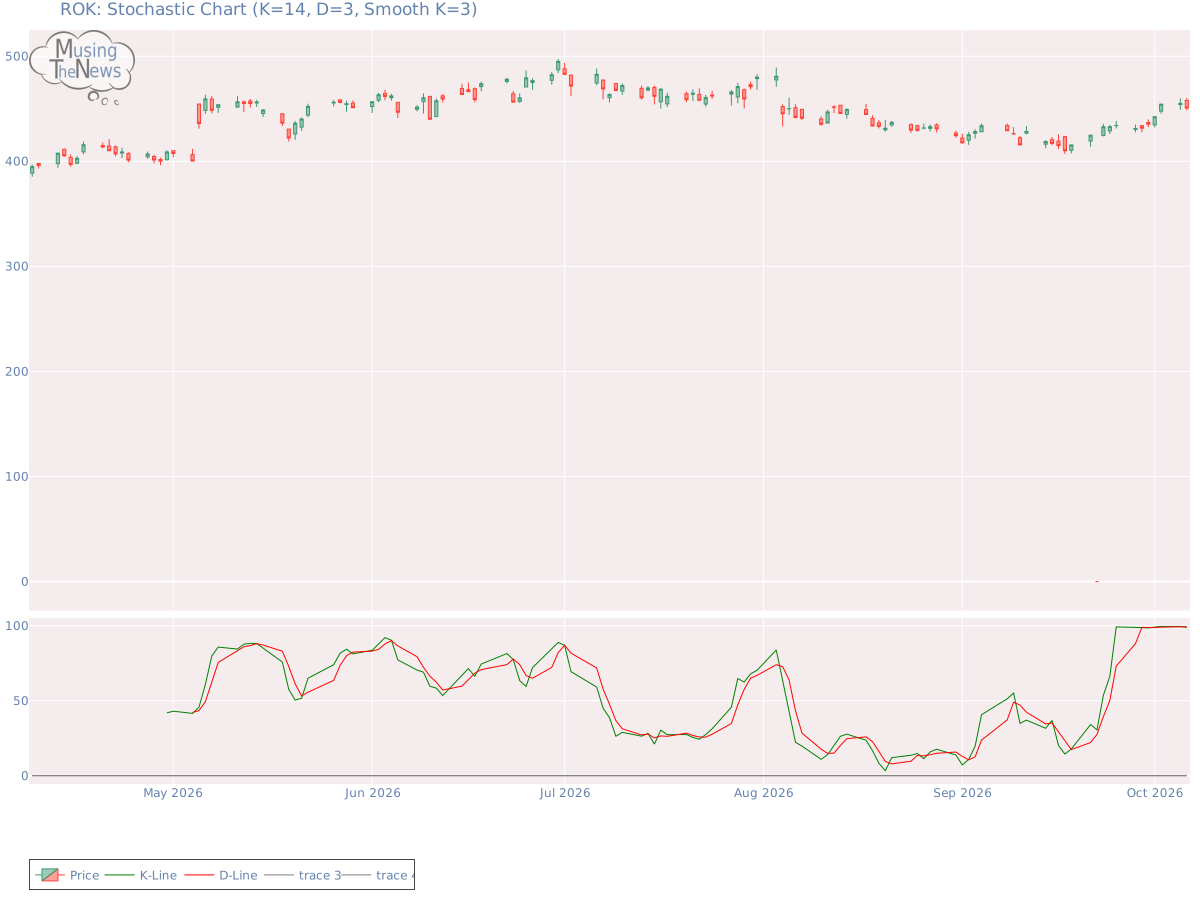
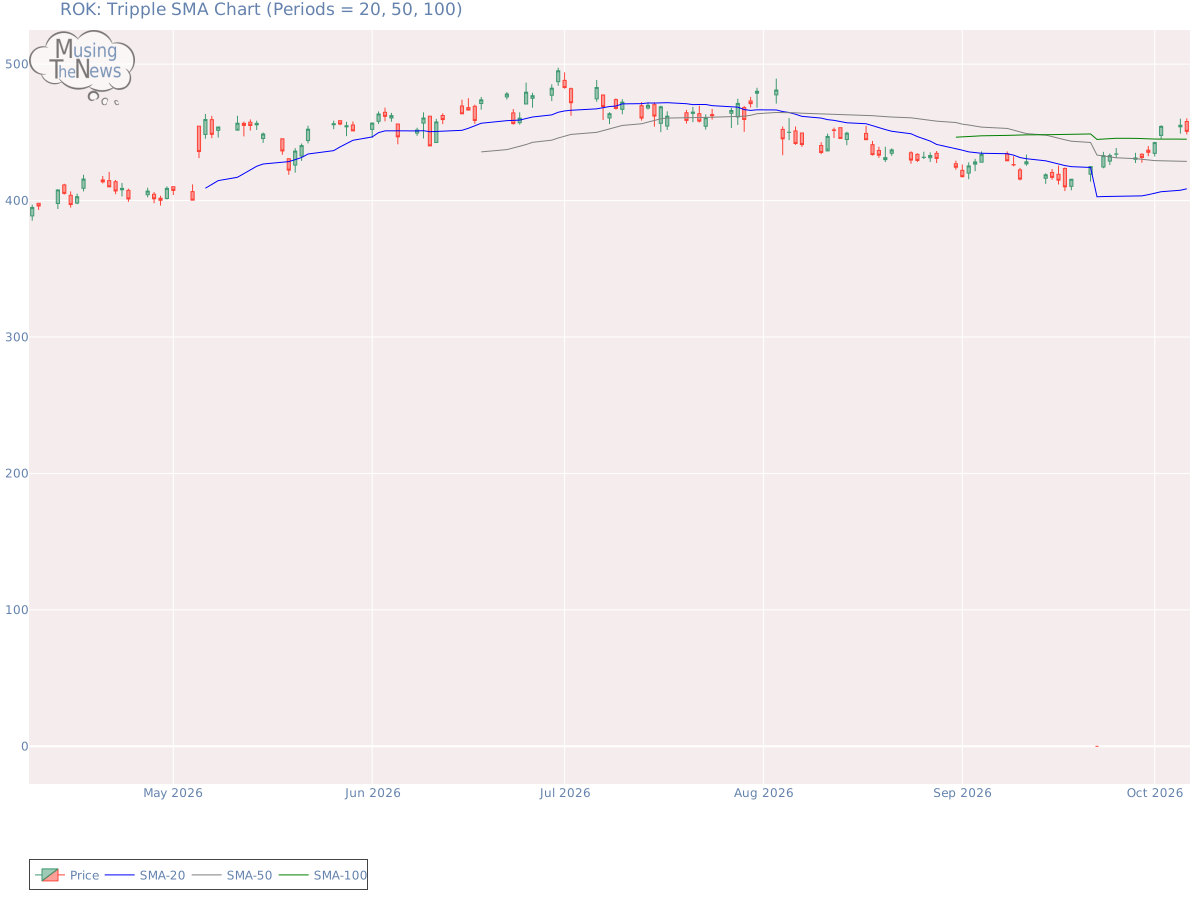
Support and Resistance: The current price of 450.74 is supported at 440.07, with resistance at 459.35. This suggests that the price for ROK might remain between these levels, where 440.07 acts as a floor and 459.35 as a ceiling in the market.Support/Resistance for ROKAroon: The Aroon indicator continues to show a bullish trend for Rockwell Automation, Inc., with Aroon Up holding at the 100 level. This suggests strong upward momentum, but the trend should be examined further using other indicators to confirm its strength and potential for continuation.Aroon chart for Rockwell Automation, Inc.Bol. Bands: The BOLL BANDS is currently in a neutral position, offering no clear indication of movement up or down. This suggests that the market may be experiencing a period of equilibrium, with no strong trend in play.Bolinger Bands chart for Rockwell Automation, Inc.Parabolic SAR: The PSAR remains bullish, reinforcing a significant support level. This steady support suggests that the market's upward trend may continue, providing a solid foundation for potential gains for ROK. Investors might see this as an opportunity to capitalize on the ongoing bullish sentiment.Parabolic Stop and Reverse chart for Rockwell Automation, Inc.Stochastic: The K-line has slipped below the D-line on the stochastic indicator while staying above 80, suggesting the onset of a bearish price move. This pattern may indicate that the market's upward momentum is starting to fade, which could lead to a reversal. Investors should be mindful of this possible shift for ROK.Stochastic chart for Rockwell Automation, Inc.Tripple Moving Agerage: The Tripple MOVING AVG is in a neutral stance, with no clear signals for movement up or down. This neutral position indicates a potential period of consolidation or uncertainty in the market.Tripple SMA chart for Rockwell Automation, Inc. A company's technical data, including stock price and trading volume, can provide valuable insights when considered alongside its fundamentals. These include financial performance, market share, and growth strategy, as well as broader industry dynamics. Examining these factors helps investors or analysts make more informed decisions, as the company's fundamentals offer context for understanding how and why certain technical patterns may emerge in the market.