Technicals for Public Service Enterprise Group Incorporated
The AROON indicator is showing a significant bullish trend, as the Aroon Up has risen and the Aroon Oscillator has reversed. This suggests a potential reversal to an upward...
By MusingTheNews
Updated 2026-10-07 23:26:48
Overall Technical outlook
Price Summary
In today's trading, Public Service Enterprise Group Incorporated's stock jumped by 3.78%, showcasing an impressive market day. On 2026-10-06, Public Service Enterprise Group Incorporated's stock opened at 69.12, reached 71.87, hit a low of 69.12, and rose 3.78% to close at 71.73, with 8796500 shares traded. The stock's highest value over the last 52 weeks is 86.95, and the lowest value is 0.0.
Technicals
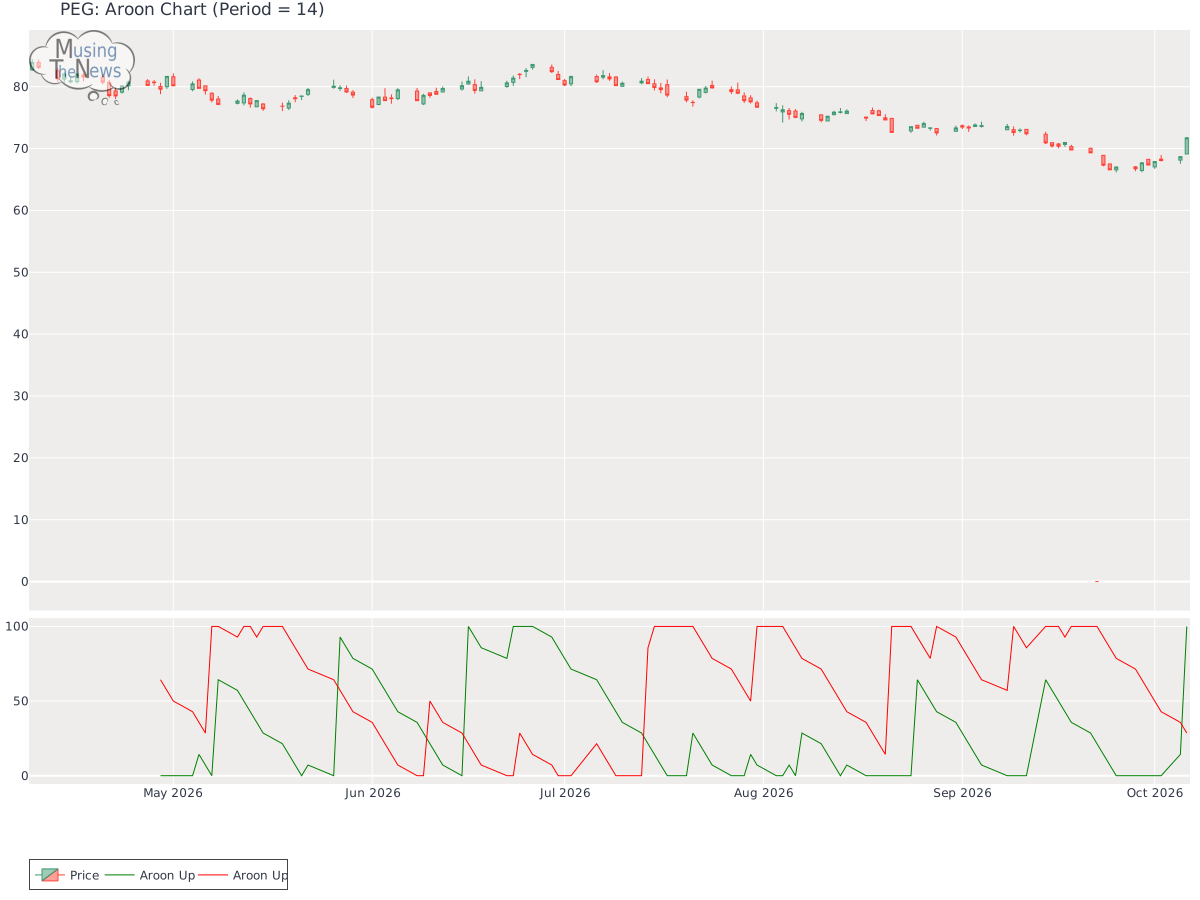
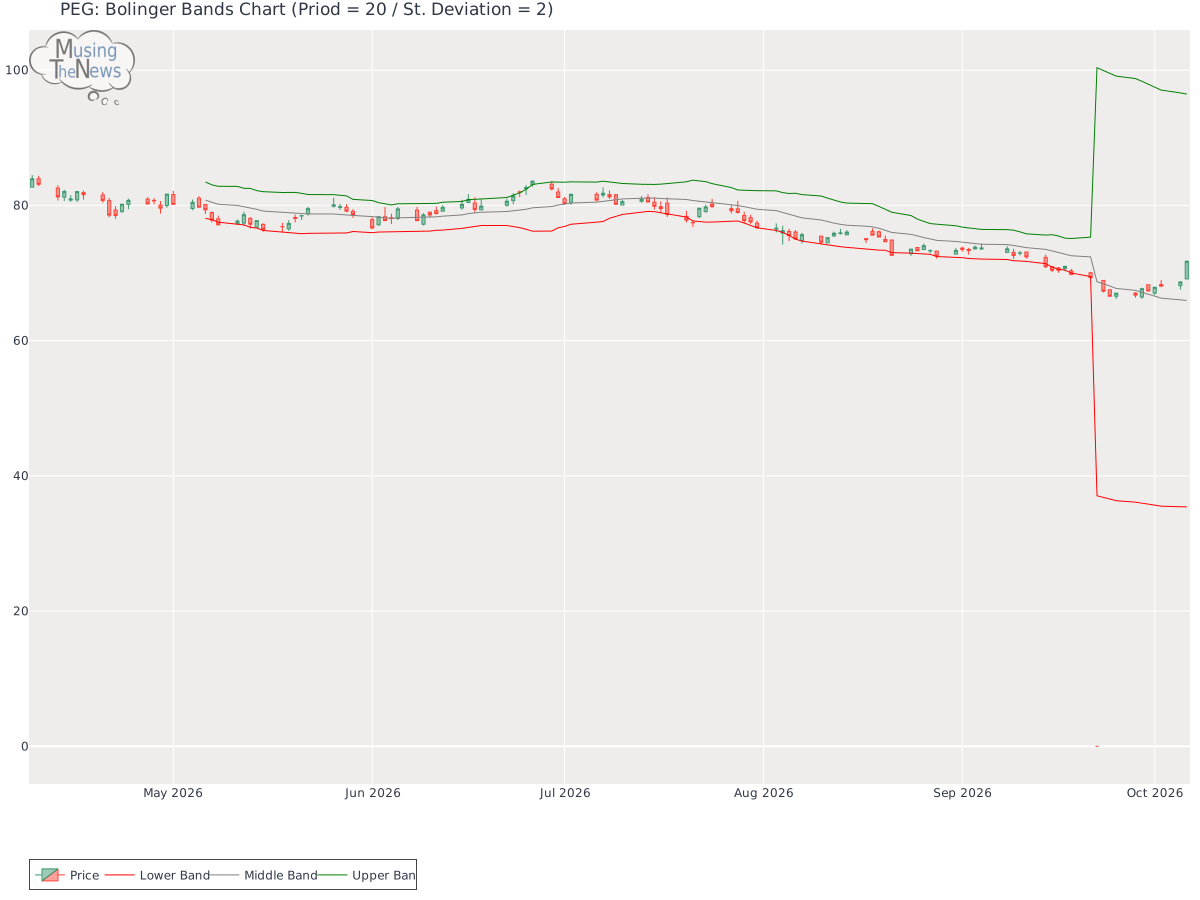
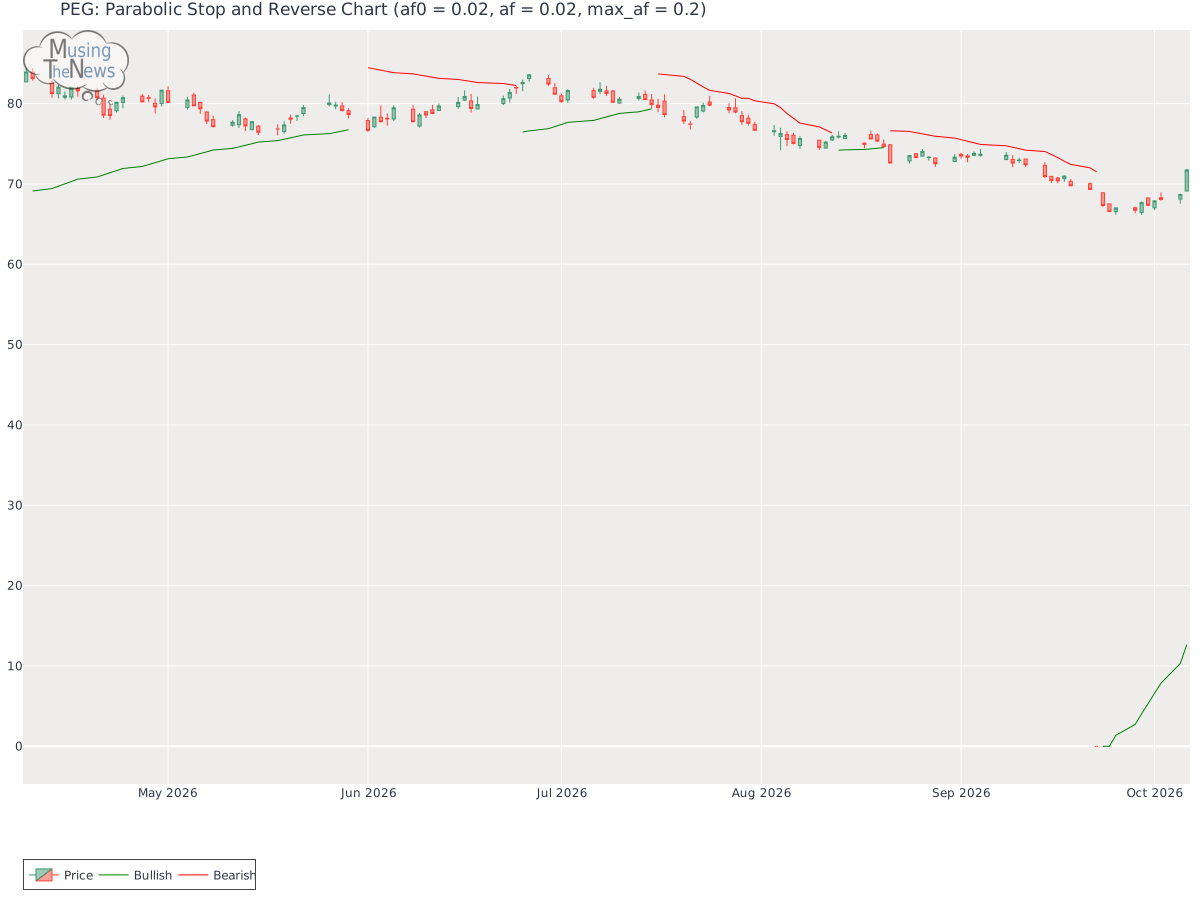
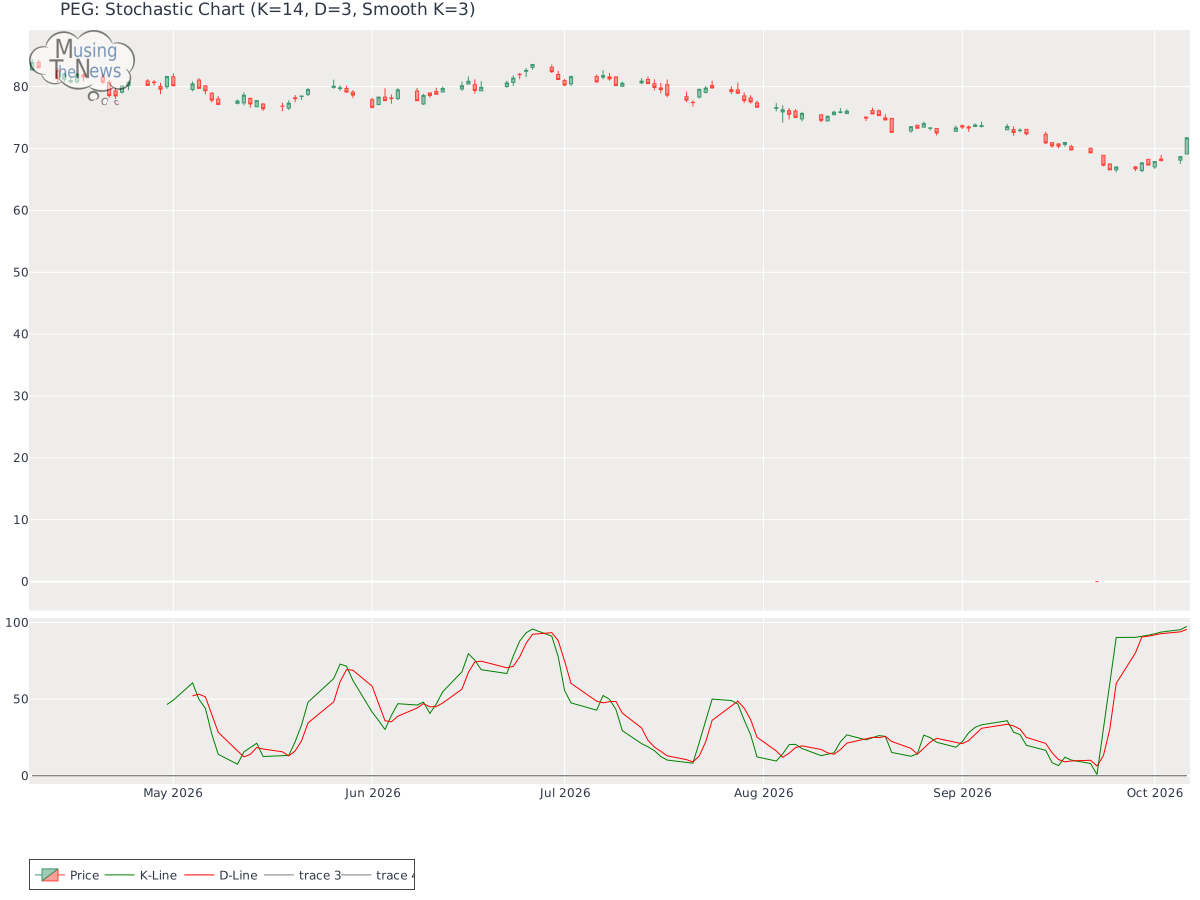
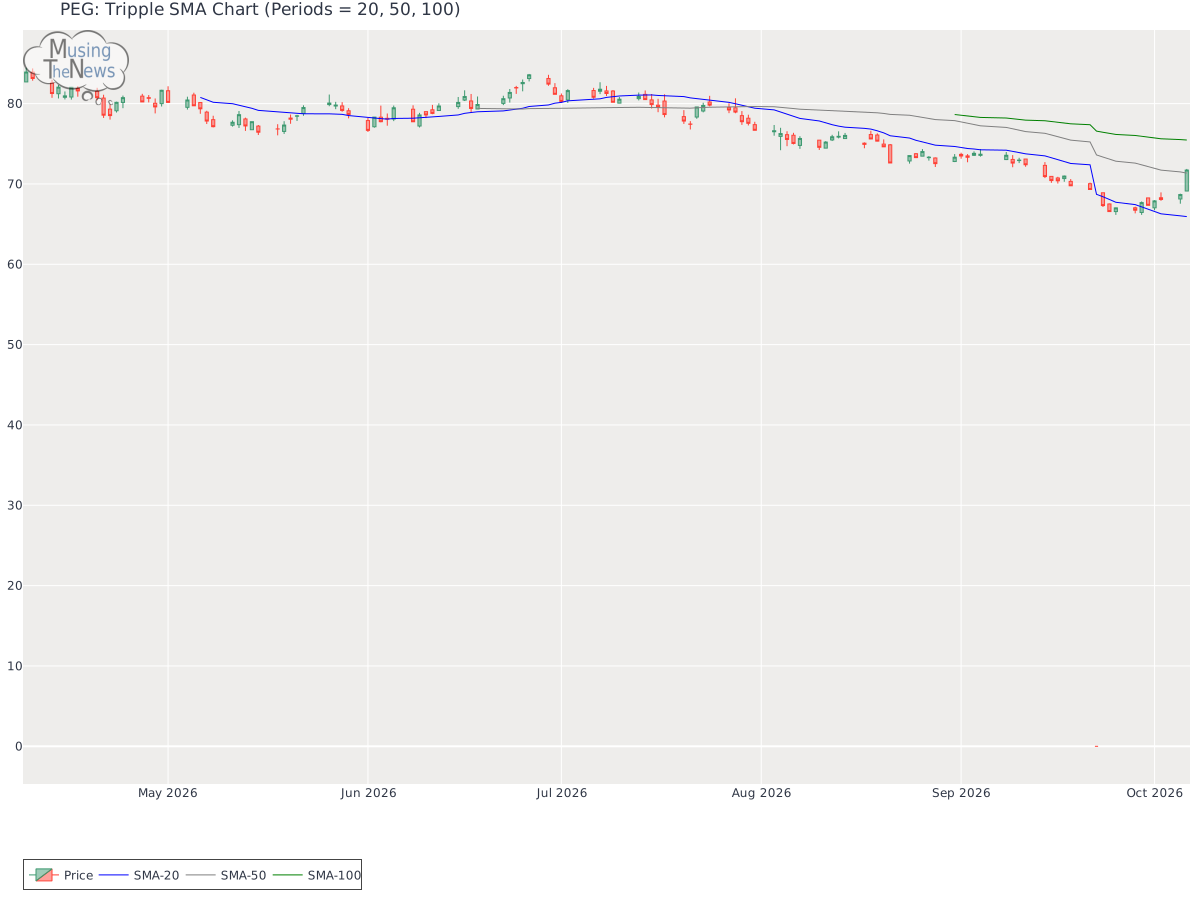
Aroon: The AROON indicator is showing a significant bullish trend, as the Aroon Up has risen and the Aroon Oscillator has reversed. This suggests a potential reversal to an upward trend, indicating that market sentiment is becoming more optimistic. Investors may anticipate continued upward momentum, with the market likely to experience further gains.Aroon chart for Public Service Enterprise Group IncorporatedBol. Bands: The BOLL BANDS is neutral, showing no definitive signals of a trend either upward or downward. This neutral stance indicates a period of market indecision, where the direction is unclear.Bolinger Bands chart for Public Service Enterprise Group IncorporatedParabolic SAR: The PSAR maintains its bullish stance, setting a significant support level that could help sustain the market's upward movement. This strong support suggests that Public Service Enterprise Group Incorporated is likely to continue trending higher, providing investors with confidence in the ongoing bullish momentum.Parabolic Stop and Reverse chart for Public Service Enterprise Group IncorporatedStochastic: With the K-line above both the D-line and the 80 mark, the stochastic indicator signals a bullish trend. This configuration suggests that the market is experiencing strong upward momentum, likely leading to further gains. Investors may see this as a favorable condition for potential growth.Stochastic chart for Public Service Enterprise Group IncorporatedTripple Moving Agerage: The 20-50-100 period moving averages are aligned for a bullish trend, but the slopes of the faster averages suggest that this strength may be fading for PEG. The weakening momentum in these shorter-term averages hints that a reversal could be approaching, signaling that the current trend might not hold much longer.Tripple SMA chart for Public Service Enterprise Group Incorporated When evaluating a company's technical data, such as stock price charts or volume, it is essential to first consider its fundamentals. These fundamentals include financial stability, growth potential, and competitive advantages. Additionally, understanding the broader industry in which the company operates offers context that helps to make sense of technical patterns. By examining both the company's internal strengths and external environment, one can make more accurate and meaningful conclusions about its stock performance.
Public Service Enterprise Group IncorporatedPEG share pricePEG technical chartPEG stock chartPEG techncal analysisPEG price trendsPEG stock signalsPEG stock pricestock marketNSE stock chart