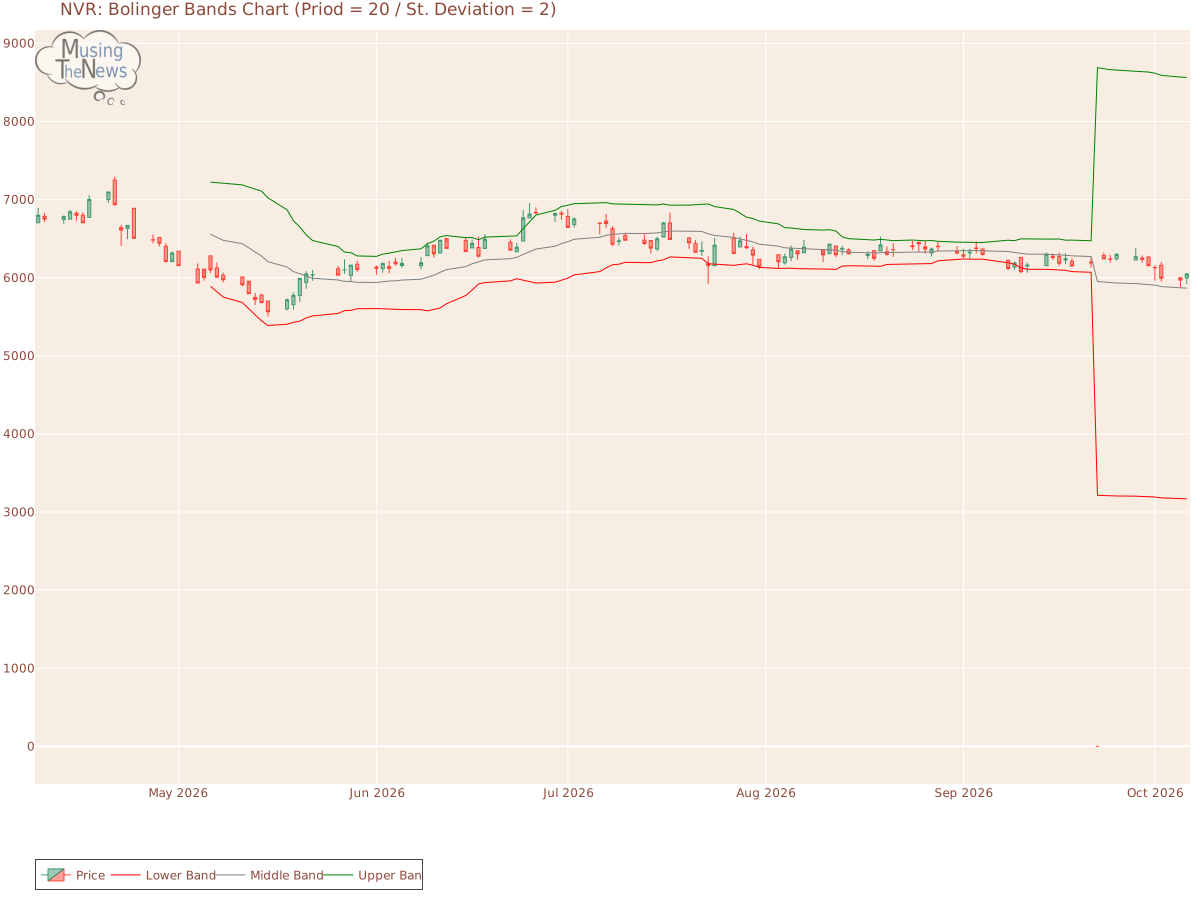
The BOLL BANDS is currently neutral, showing no clear bias toward an upward or downward trend. This suggests that the market may be in a phase of indecision or consolidatio...
By MusingTheNews
Updated 2026-10-07 23:26:42
Overall Technical outlook
Price Summary
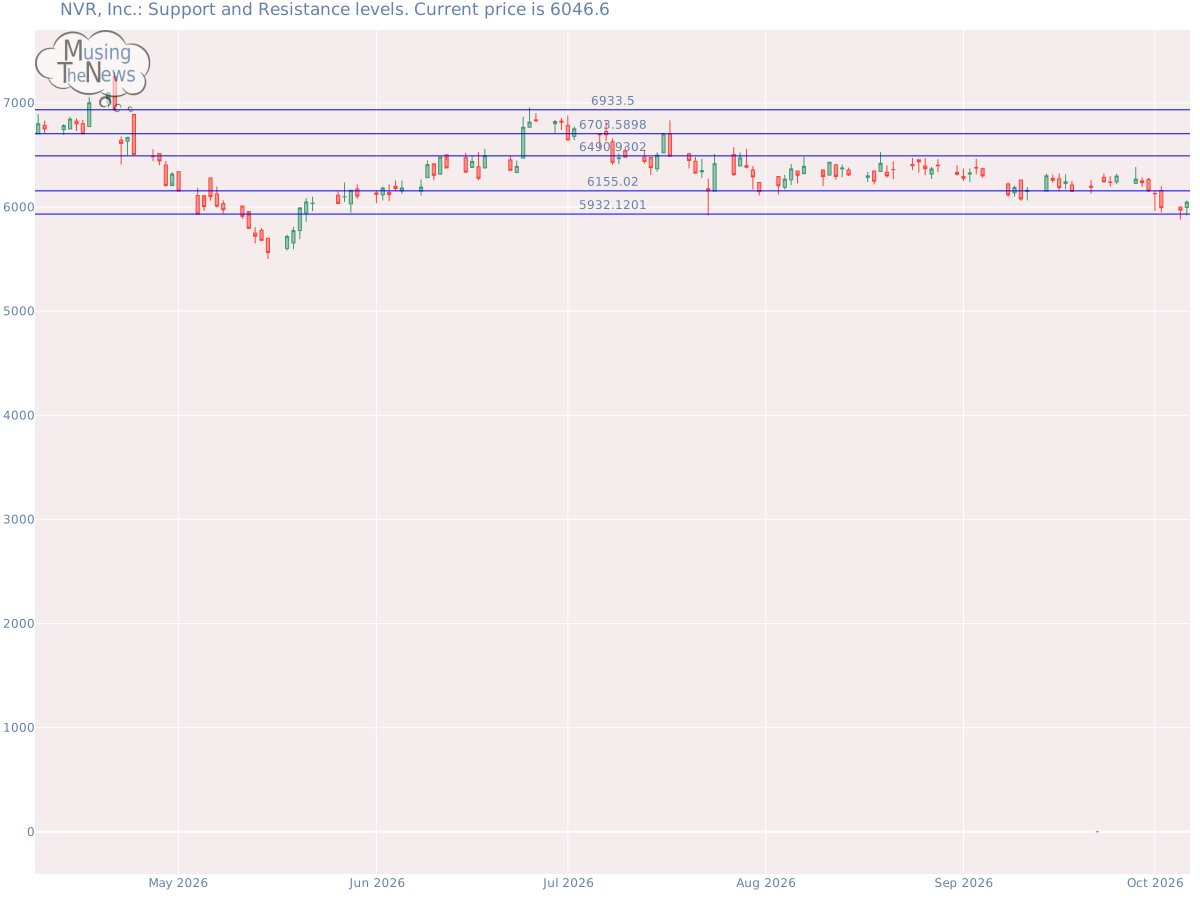
2026-10-06, saw NVR's stock open at 5996.1, hit a peak of 6062.0, fall to a low of 5919.95, and close up 0.84% at 6046.6, with 32400 shares changing hands. Over the previous 52 weeks, the stock reached a high of 8097.25 and a low of 0.0.
Technicals
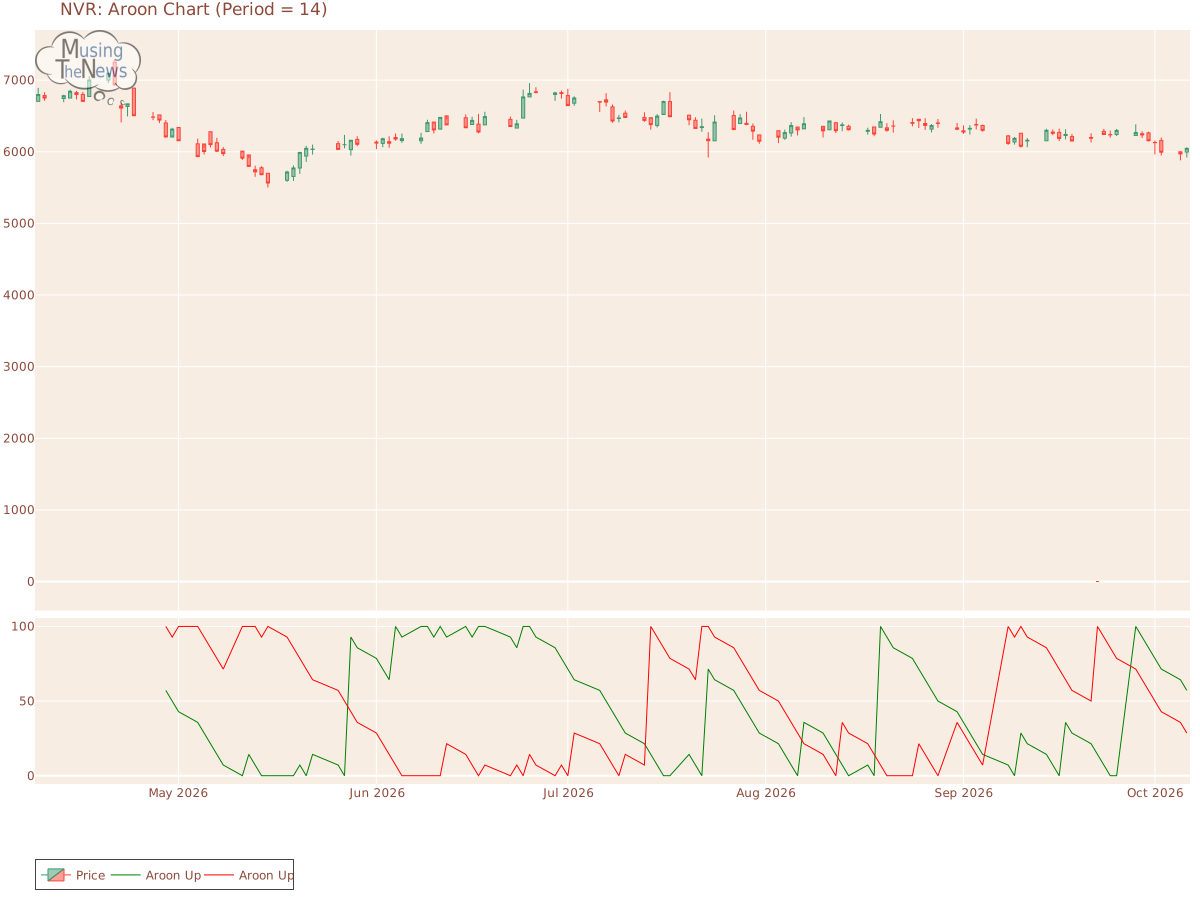
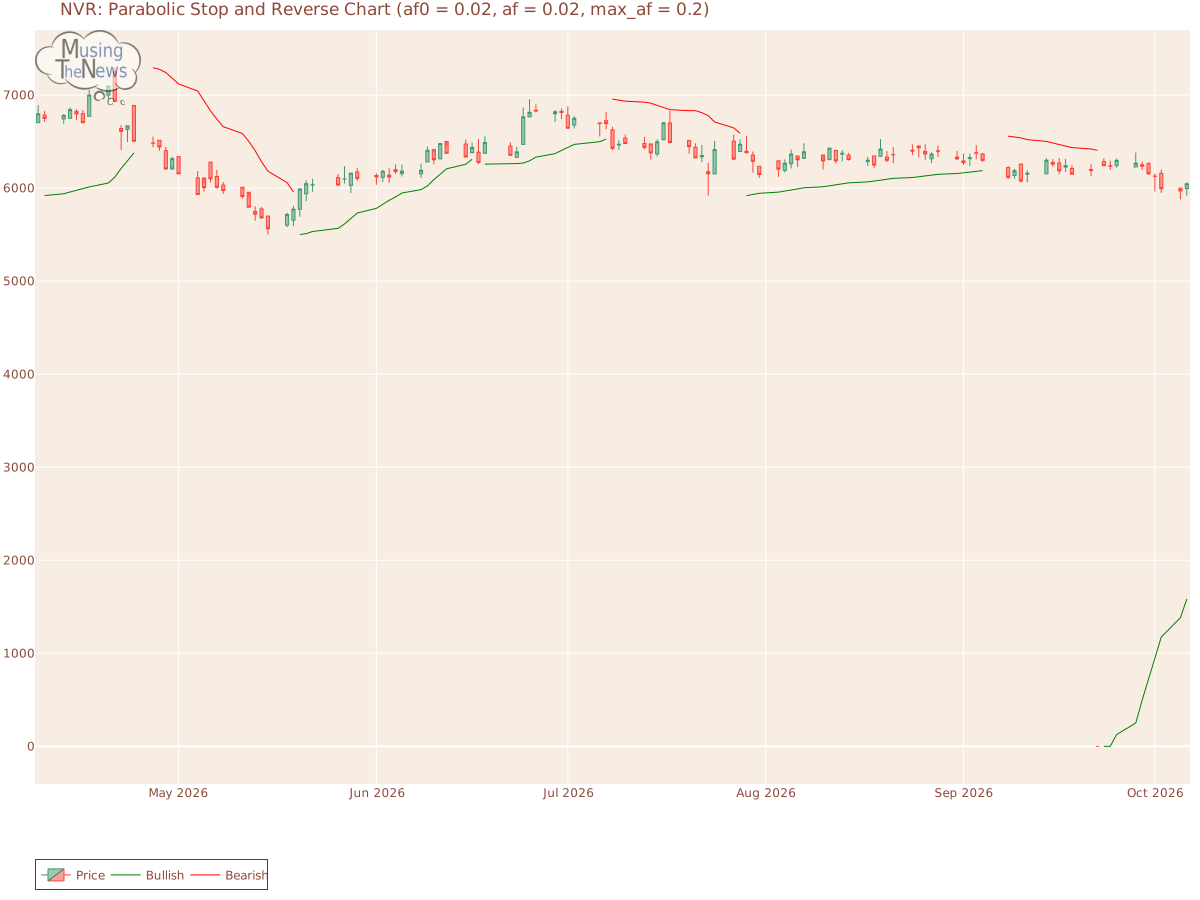
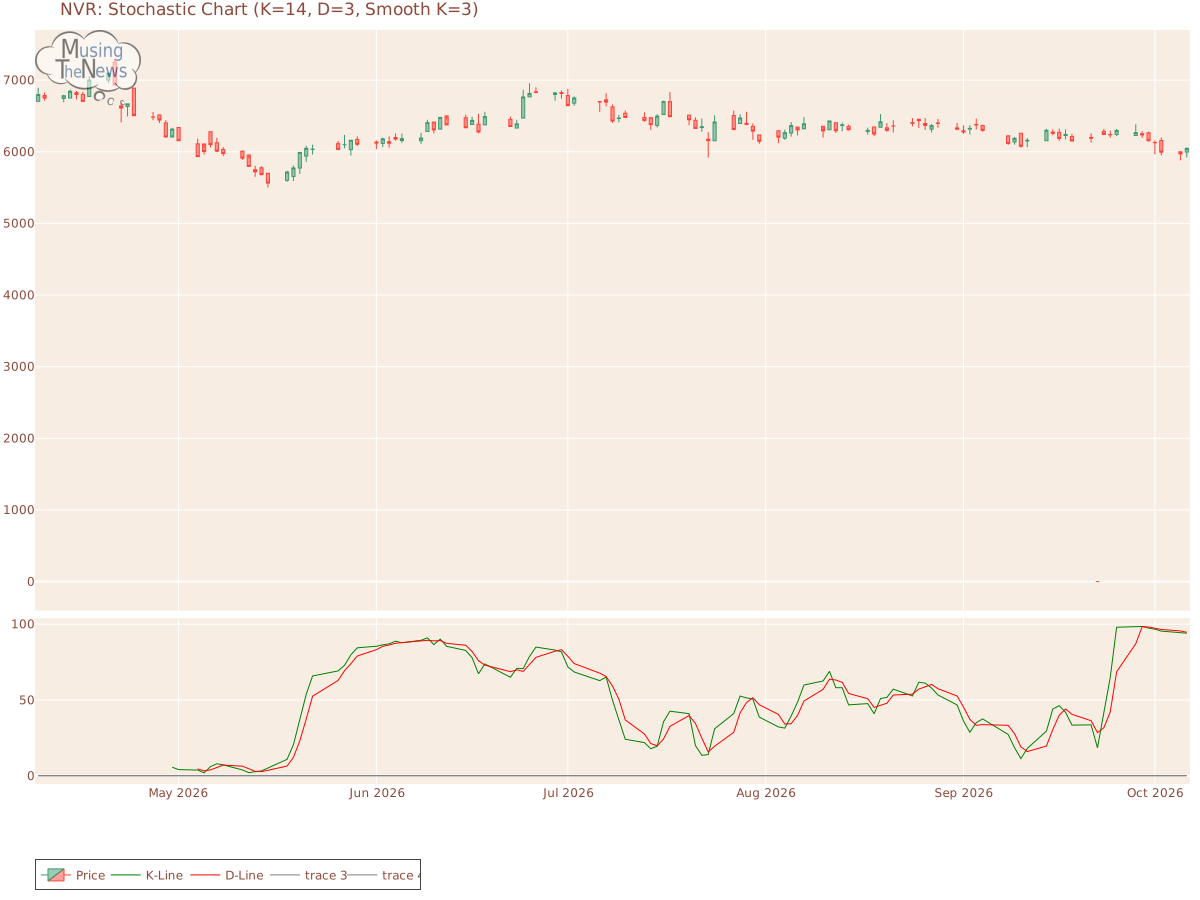
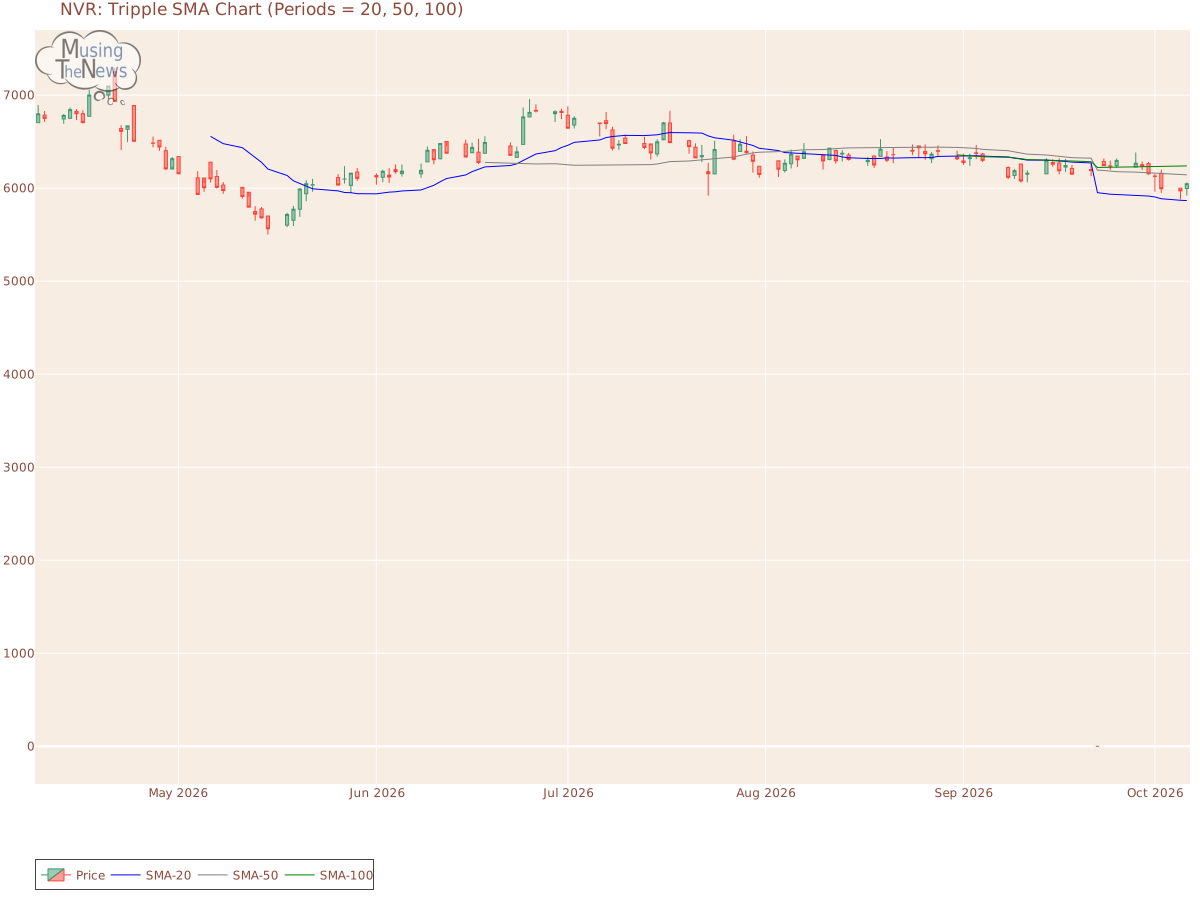
Support and Resistance: At 6046.6, the price is held up by support at 5932.12 and faces resistance at 6155.02 for NVR. This suggests a trading range where 5932.12 provides a base and 6155.02 limits upward movement.Support/Resistance for NVRAroon: The AROON is showing a neutral reading, with no clear direction indicated for upward or downward movement. This neutral position suggests a possible period of consolidation.Aroon chart for NVR, Inc.Bol. Bands: The BOLL BANDS is currently neutral, showing no clear bias toward an upward or downward trend. This suggests that the market may be in a phase of indecision or consolidation.Bolinger Bands chart for NVR, Inc.Parabolic SAR: The PSAR continues to signal a bullish outlook, establishing a key support level that reinforces the market's upward momentum. This support could serve as a base for continued gains, suggesting that the bullish trend is likely to persist.Parabolic Stop and Reverse chart for NVR, Inc.Stochastic: The stochastic indicator reflects the K-line falling below the D-line, though it remains above 80, hinting at the possible start of a bearish price move. This suggests that the market may be losing its recent strength, with a potential decline ahead. Traders should be on the lookout for further evidence of a bearish trend for NVR, Inc..Stochastic chart for NVR, Inc.Tripple Moving Agerage: The current alignment of the 20, 50, and 100 moving averages suggests a bullish trend, but the slopes of the 20 and 50 SMAs are beginning to lose momentum. This decline in strength could indicate that the current uptrend is losing steam, with a potential bearish reversal in price action likely to occur soon as the market approaches a turning point.Tripple SMA chart for NVR, Inc. When analyzing a company, its fundamentals—such as earnings, management efficiency, and strategic initiatives—must be considered alongside technical data. The context of the industry in which the company operates also plays a key role, as market trends and competitive dynamics can significantly impact performance. By taking a comprehensive approach, combining both fundamental and technical analysis, one can gain a deeper understanding of the company's potential for growth or risk.