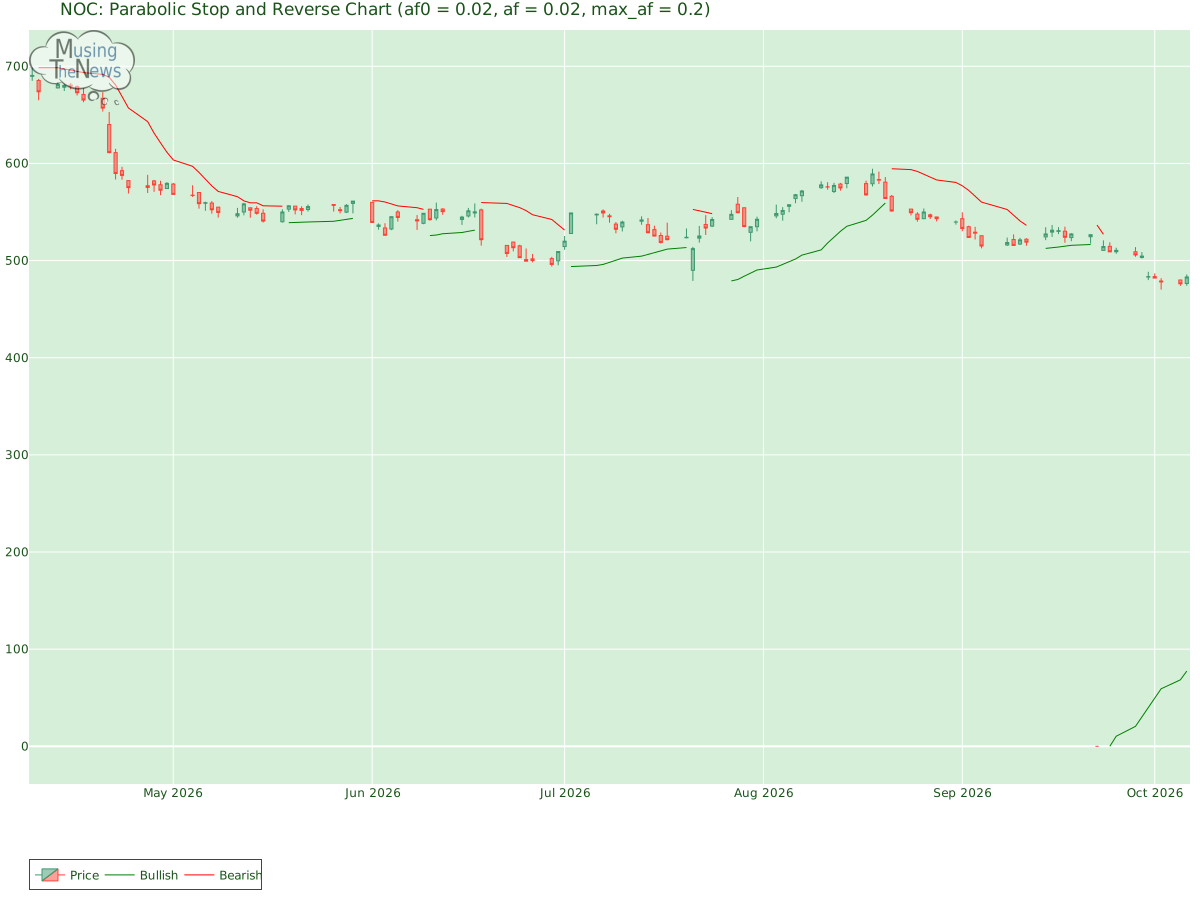
The PSAR for NOC maintains its bullish outlook, setting a strong support level that could underpin further gains. This suggests that the market is likely to continue its up...
By MusingTheNews
Updated 2026-10-07 23:26:41
Overall Technical outlook
Price Summary
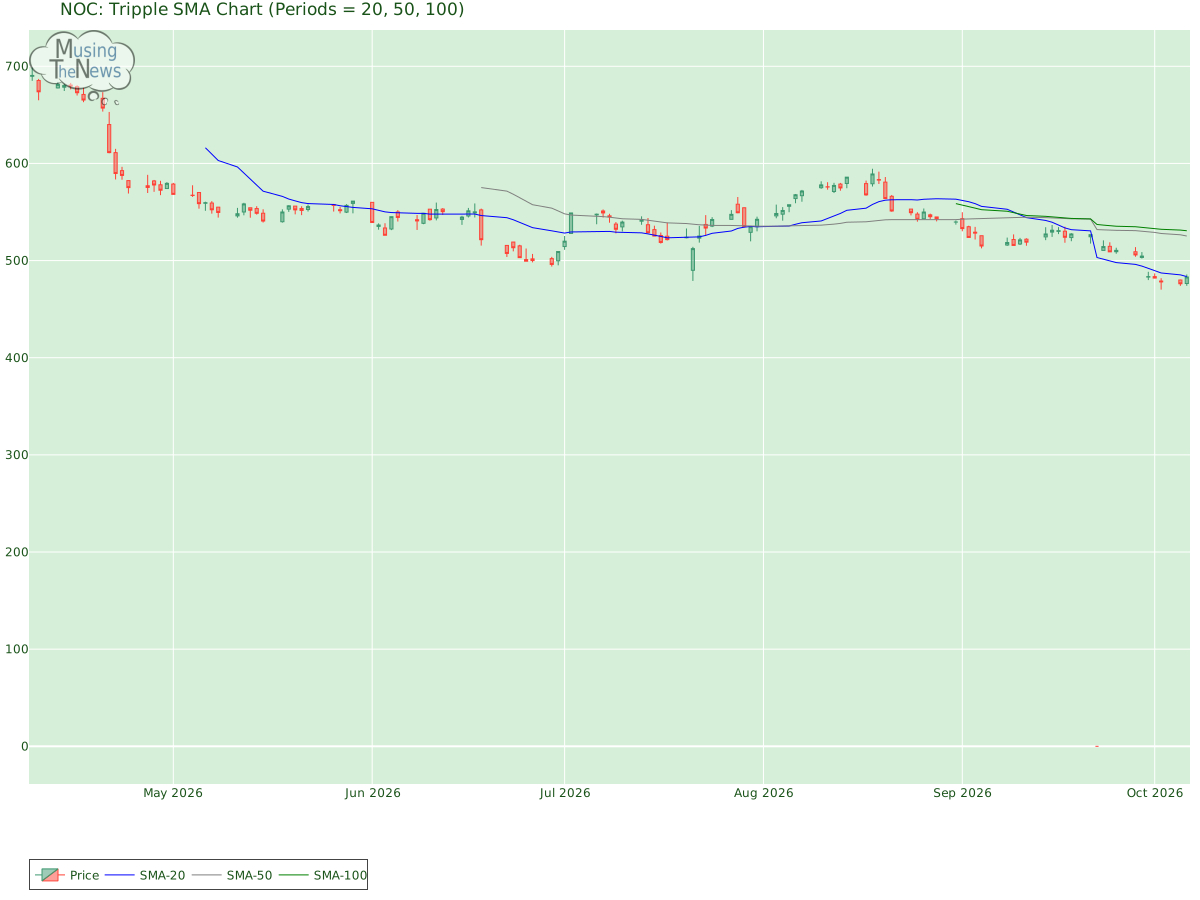
Northrop Grumman Corporation's stock opened at 476.39 on 2026-10-06, surged to 485.7, dropped to 474.0, and ended 1.41% up at 483.11, with 1010600 shares traded. During the 52-week span, the stock hit a high of 768.02 and a low of 0.0.
Technicals
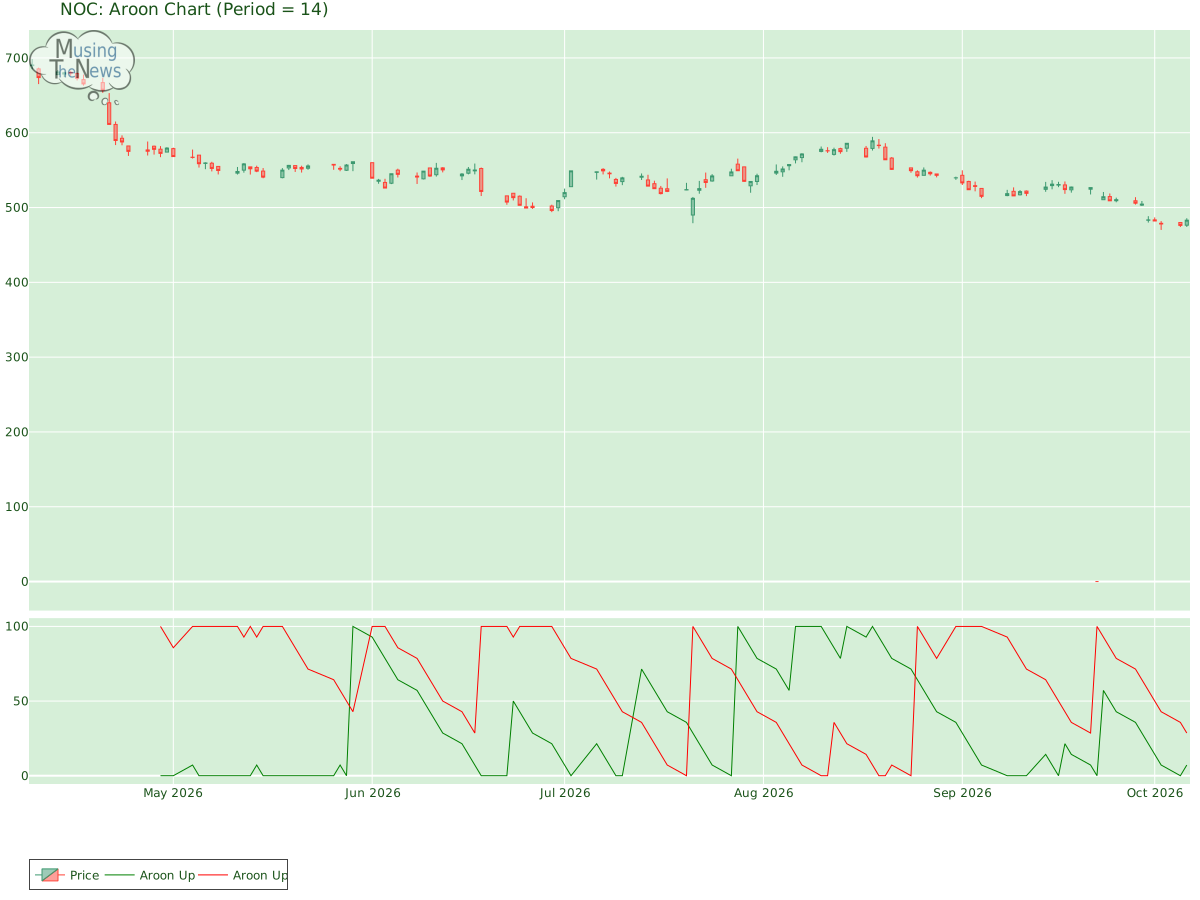
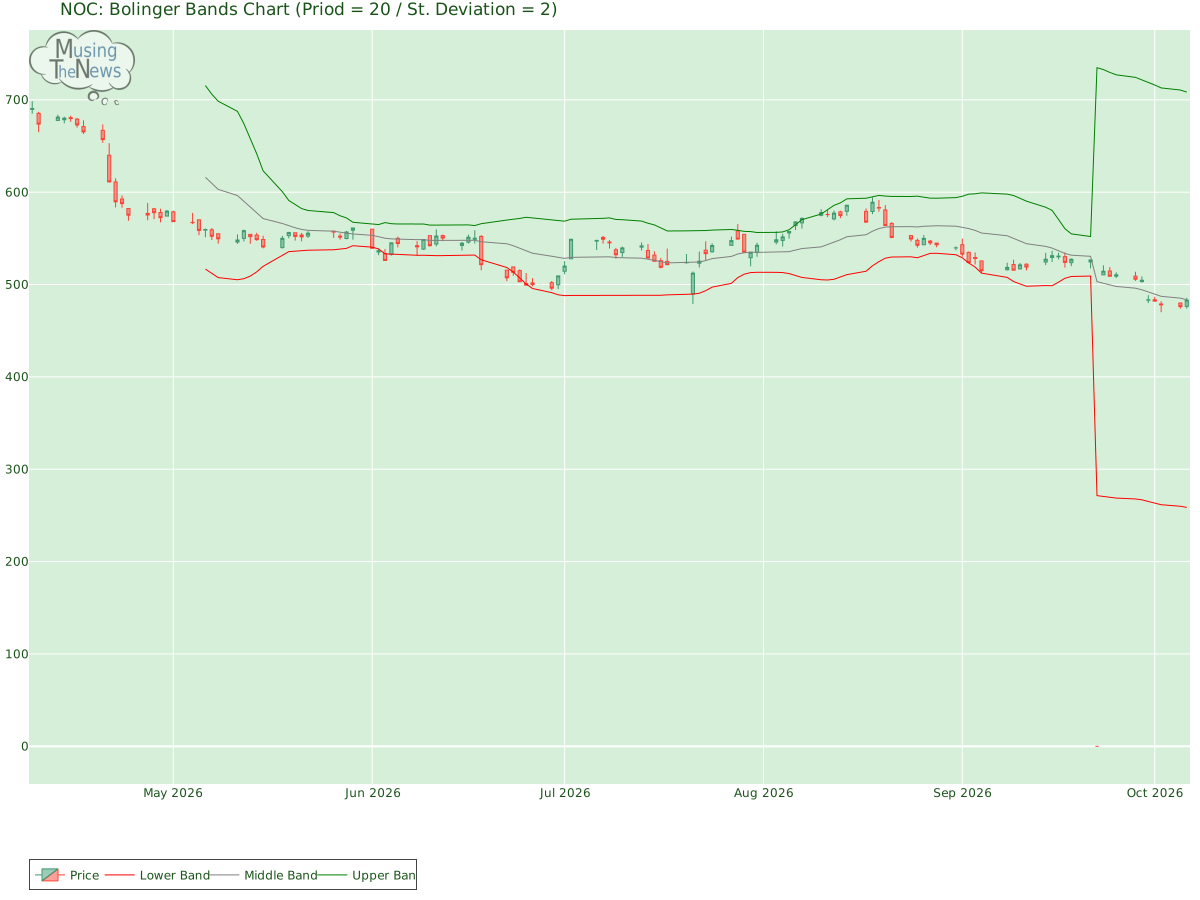
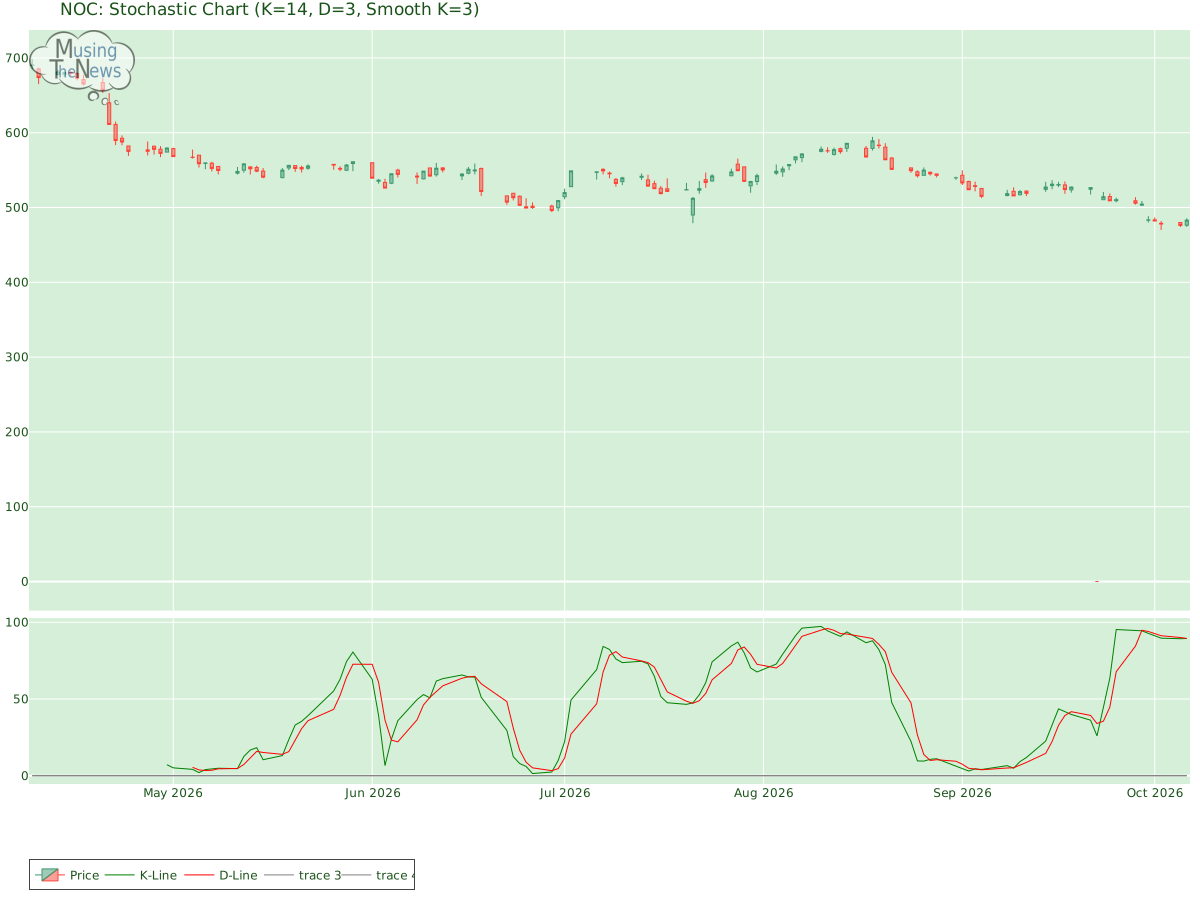
Aroon: The AROON is currently neutral, offering no clear guidance on market direction. This suggests that the market may be in a state of pause, with no strong trend emerging.Aroon chart for Northrop Grumman CorporationBol. Bands: The BOLL BANDS is in a neutral stance, with no clear direction indicated for the market. This lack of clarity suggests that the market may be in a state of equilibrium for NOC, with no strong trend emerging.Bolinger Bands chart for Northrop Grumman CorporationParabolic SAR: The PSAR for NOC maintains its bullish outlook, setting a strong support level that could underpin further gains. This suggests that the market is likely to continue its upward trajectory, with the established support providing a safety net for ongoing bullish momentum.Parabolic Stop and Reverse chart for Northrop Grumman CorporationStochastic: The stochastic indicator shows the K-line dropping below the D-line but staying above 80, indicating the possible start of a bearish price move. This setup may signal that the market's recent momentum is waning, which could result in a downturn. Traders should remain vigilant for additional signs of weakness for Northrop Grumman Corporation.Stochastic chart for Northrop Grumman CorporationTripple Moving Agerage: The alignment of the 20-50-100 period moving averages suggests a bullish trend, but the slopes of the faster averages hint at a potential reversal. The weakening signals from these shorter-term averages indicate that the current upward momentum may be fading, suggesting that a change in direction could be near.Tripple SMA chart for Northrop Grumman Corporation The technical analysis of a company's stock performance is valuable, but only when considered in conjunction with the company's fundamentals. These fundamentals, including financial strength, earnings growth, and leadership, provide a foundation for understanding market movements. Additionally, industry trends and competitive pressures play an important role. By integrating both fundamental and technical analysis, one can better evaluate the company's true potential and make more informed investment decisions.