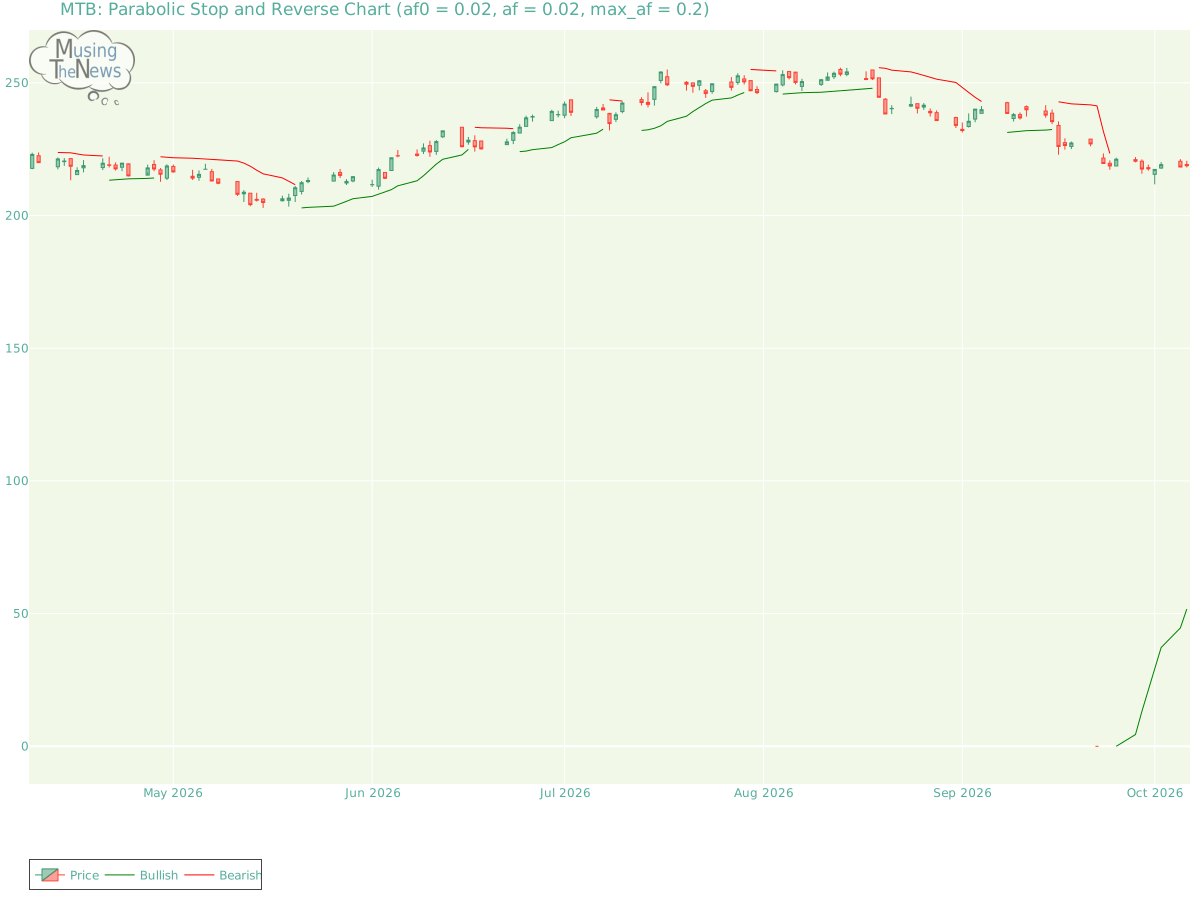
The PSAR remains bullish in its outlook, reinforcing a key support level that could help sustain the market's upward movement for MTB. This support suggests that the bullis...
By MusingTheNews
Updated 2026-10-07 23:26:34
Overall Technical outlook
Price Summary
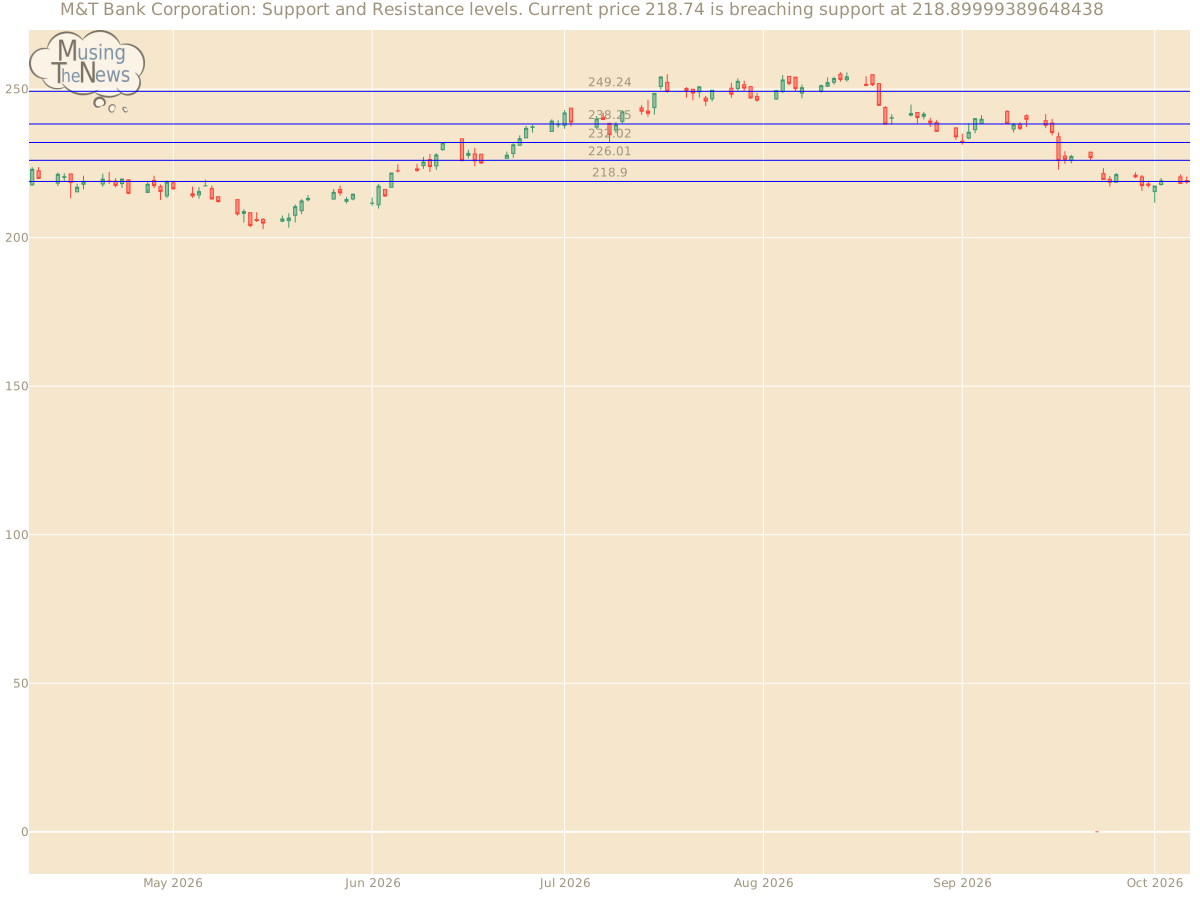
On 2026-10-06, M&T Bank Corporation's shares started at 219.21, peaked at 220.61, bottomed out at 218.09, and ended -0.21% lower at 218.74, with 832200 shares traded. Over the past year, the stock's highest price was 254.09, and its lowest was 0.0.
Technicals
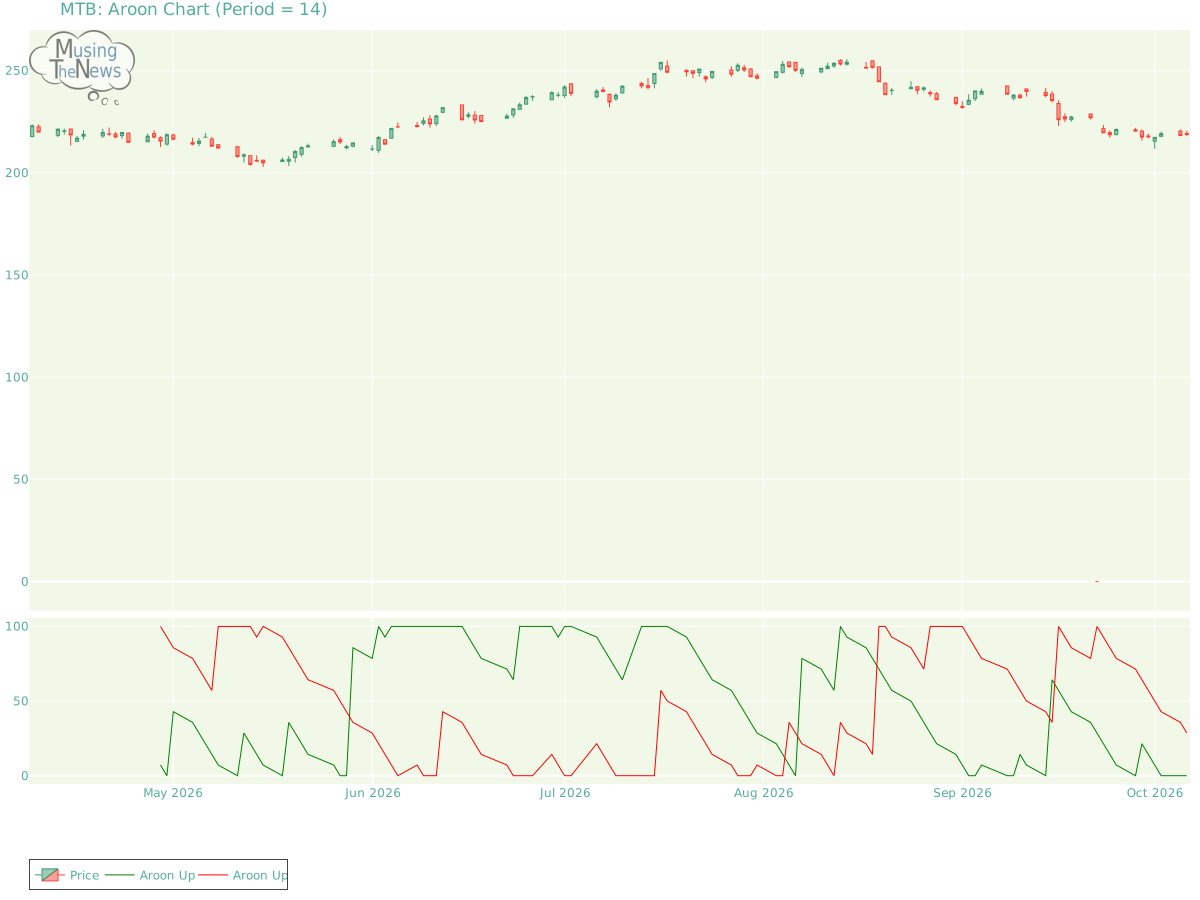
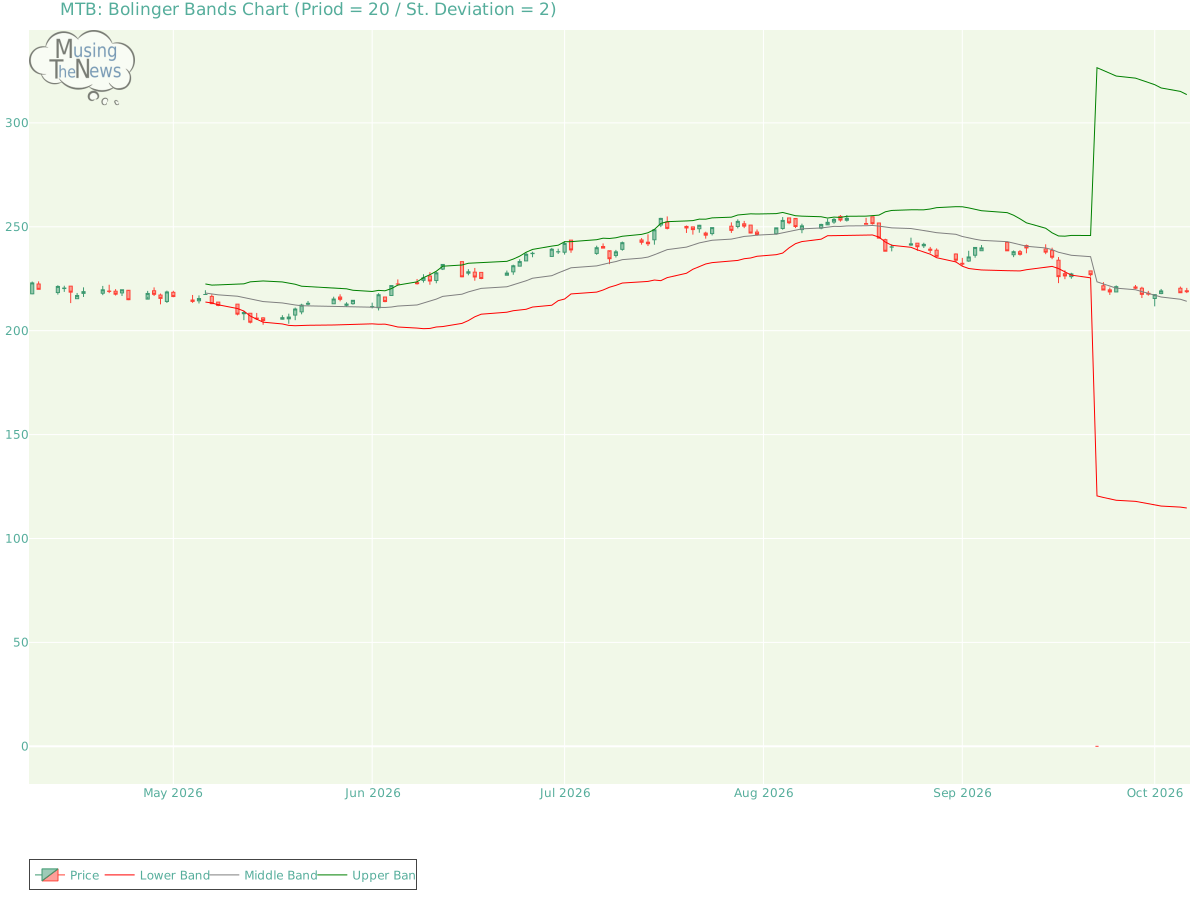
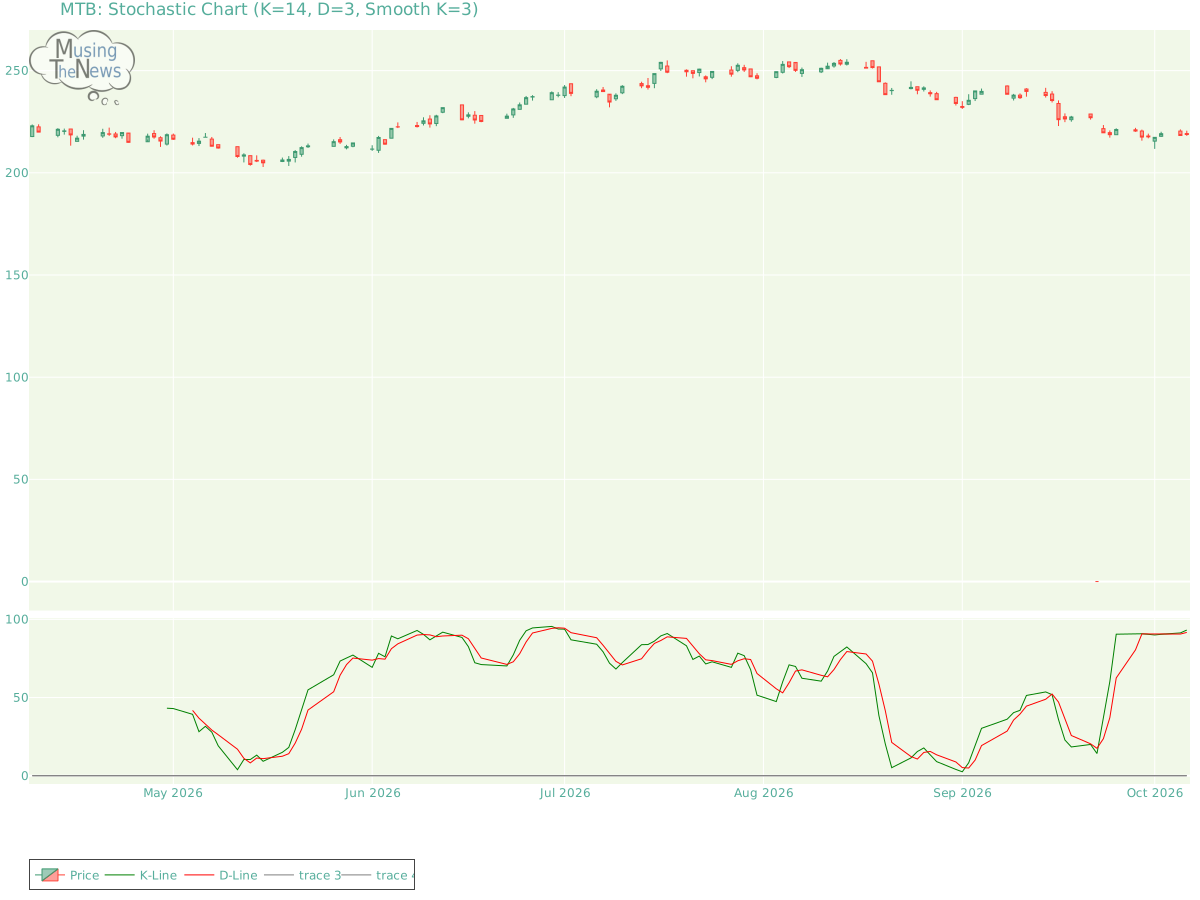
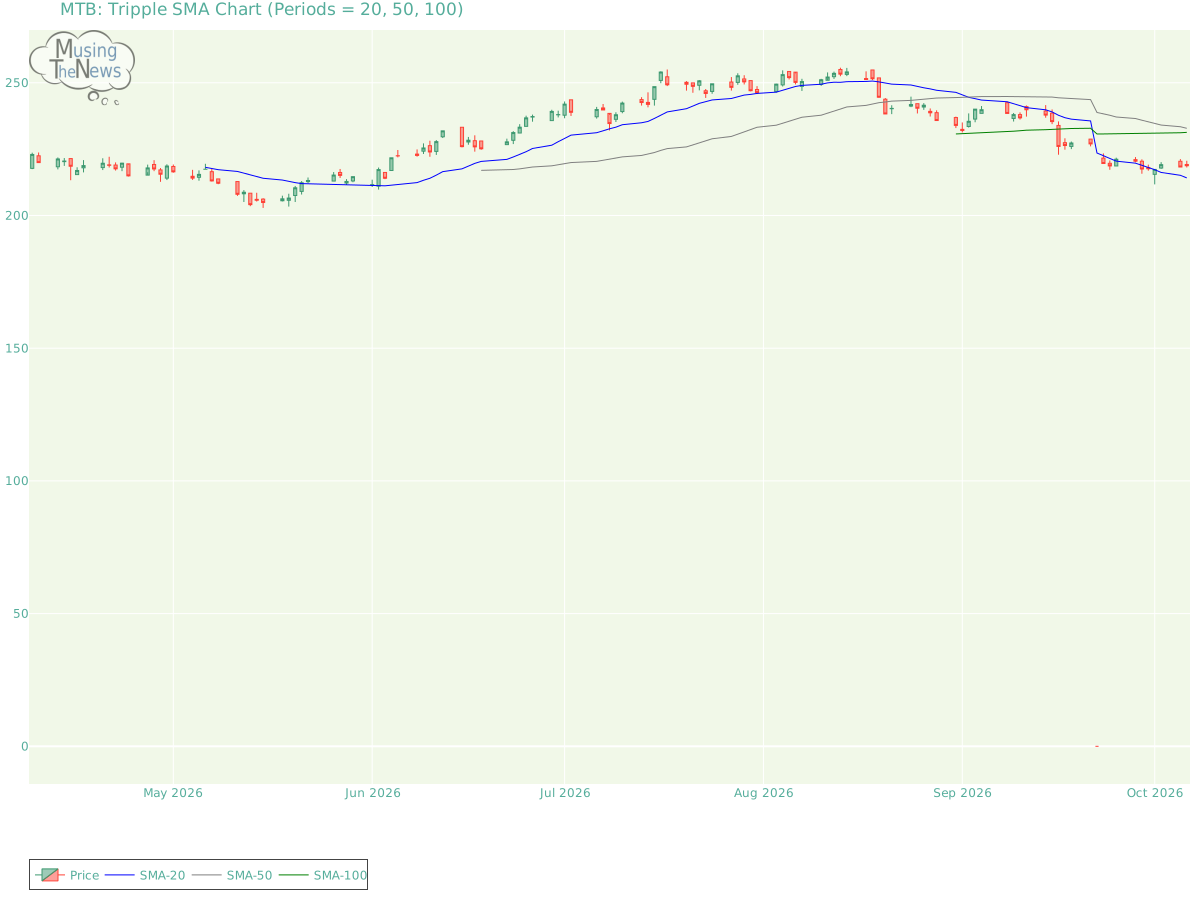
Support and Resistance: The price is currently at 218.74, supported by 218.9 and resisted by 218.9. This indicates a range where 218.9 may provide a base for the price, while 218.9 serves as a cap on further upward movement for MTB.Support/Resistance for MTBAroon: The AROON is neutral, showing no definitive signals of a trend either upward or downward. This neutral stance indicates a period of market indecision, where the direction is unclear.Aroon chart for M&T Bank CorporationBol. Bands: The BOLL BANDS is in a neutral stance, with no clear direction indicated for the market. This lack of clarity suggests that the market may be in a state of equilibrium for MTB, with no strong trend emerging.Bolinger Bands chart for M&T Bank CorporationParabolic SAR: The PSAR remains bullish in its outlook, reinforcing a key support level that could help sustain the market's upward movement for MTB. This support suggests that the bullish momentum is likely to persist, offering a foundation for further growth.Parabolic Stop and Reverse chart for M&T Bank CorporationStochastic: The stochastic indicator shows bullish conditions, with the K-line positioned above the D-line and exceeding the 80 level. This setup suggests strong upward momentum, indicating that the market may continue to rise. Investors might view this as a favorable sign for continued growth.Stochastic chart for M&T Bank CorporationTripple Moving Agerage: The current reading of the Tripple MOVING AVG indicator suggests a neutral stance, with no clear signals indicating an upward or downward direction. This lack of directional bias suggests the market may be in a period of consolidation or uncertainty.Tripple SMA chart for M&T Bank Corporation When assessing a company's technical performance, such as stock price fluctuations and trading volume, it is crucial to first examine its fundamentals. These fundamentals include financial health, profitability, and growth potential. Additionally, understanding the industry's dynamics, including competitive pressures and market trends, is key to contextualizing the company's performance. By integrating these factors, a more comprehensive and meaningful analysis can be conducted, leading to more informed investment decisions.