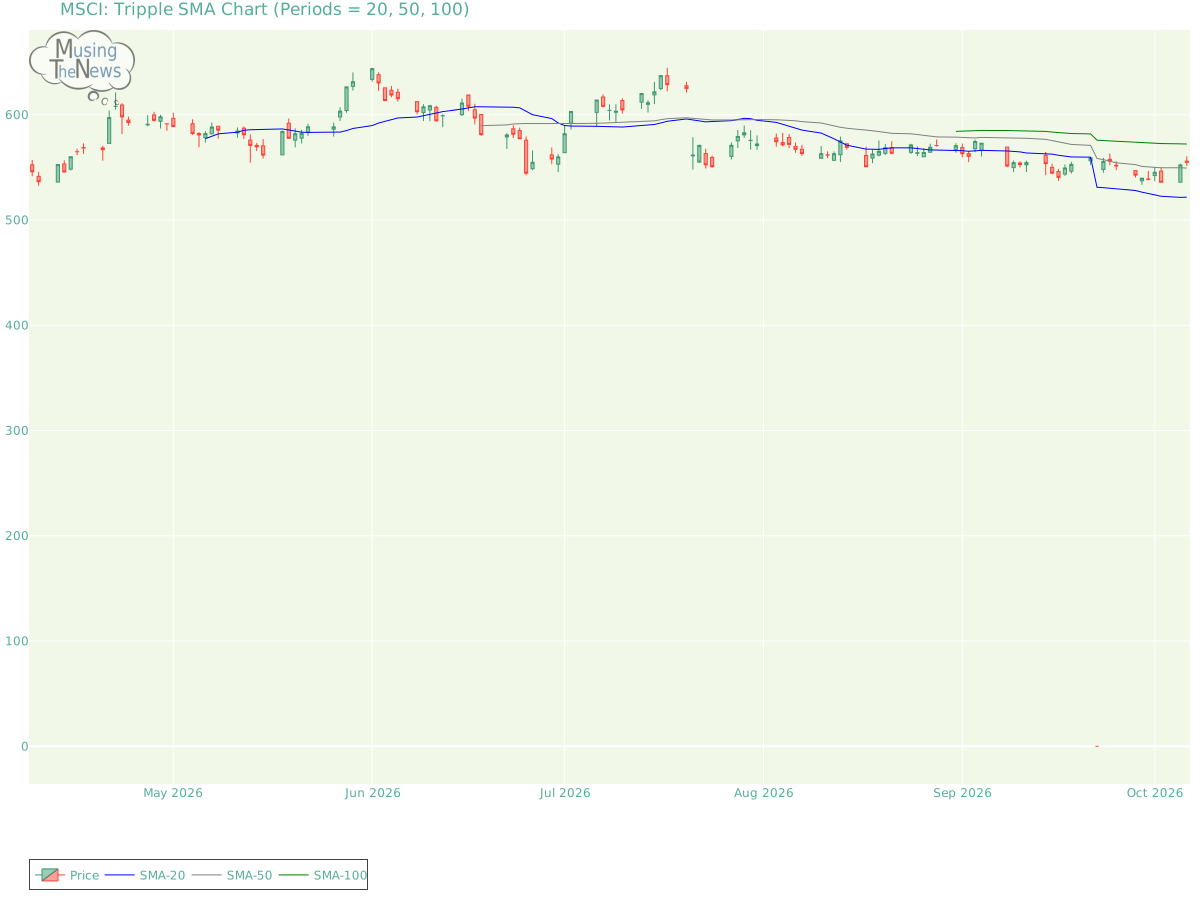
The moving averages for MSCI for the 20-50-100 periods point to a bullish trend, but the slopes of the faster averages suggest this strength may be waning. The potential fo...
By MusingTheNews
Updated 2026-10-07 23:26:39
Overall Technical outlook
Price Summary
On 2026-10-06, MSCI Inc.'s shares started at 556.0, peaked at 560.62, bottomed out at 551.41, and ended -0.19% down at 554.92, with 576700 shares traded. The stock's highest price in the past 52 weeks is 643.83, while its lowest price during the same period is 0.0.
Technicals
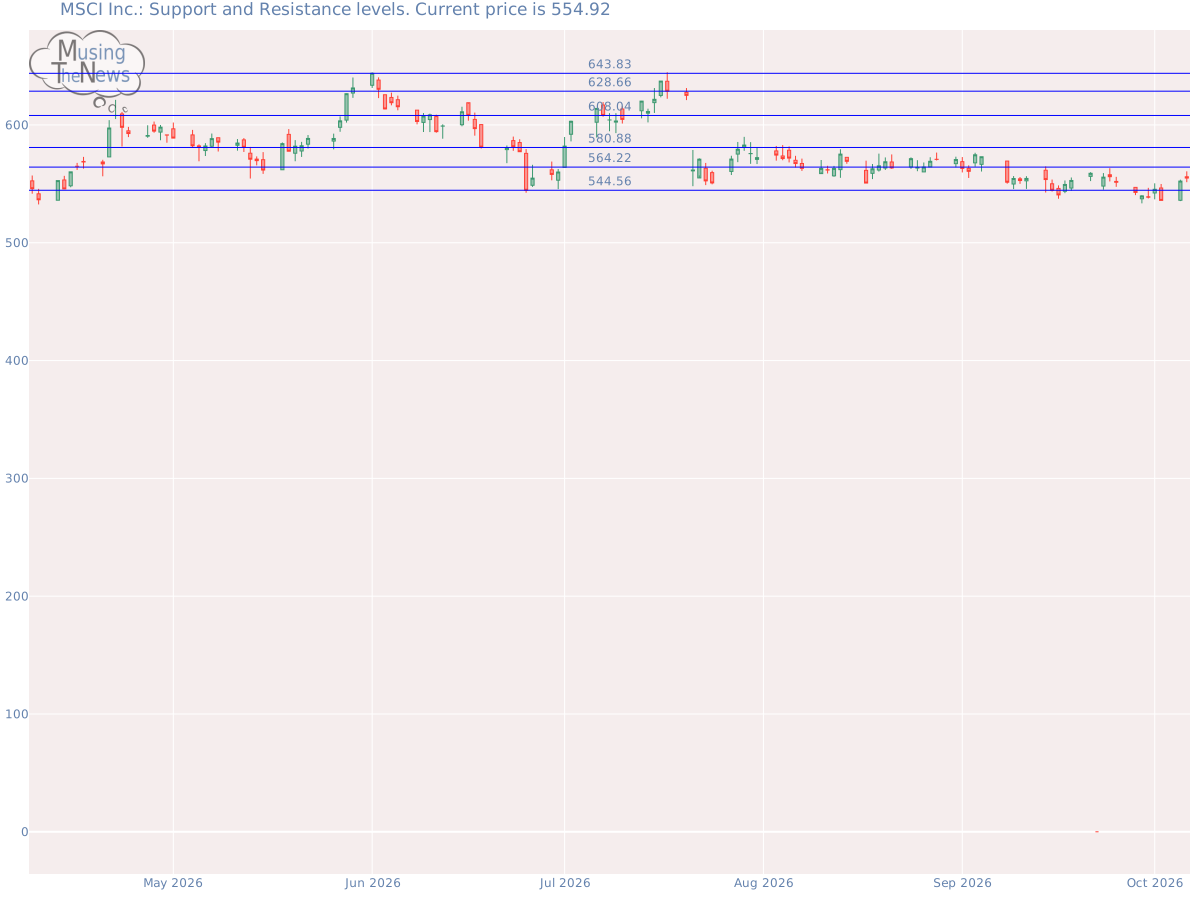
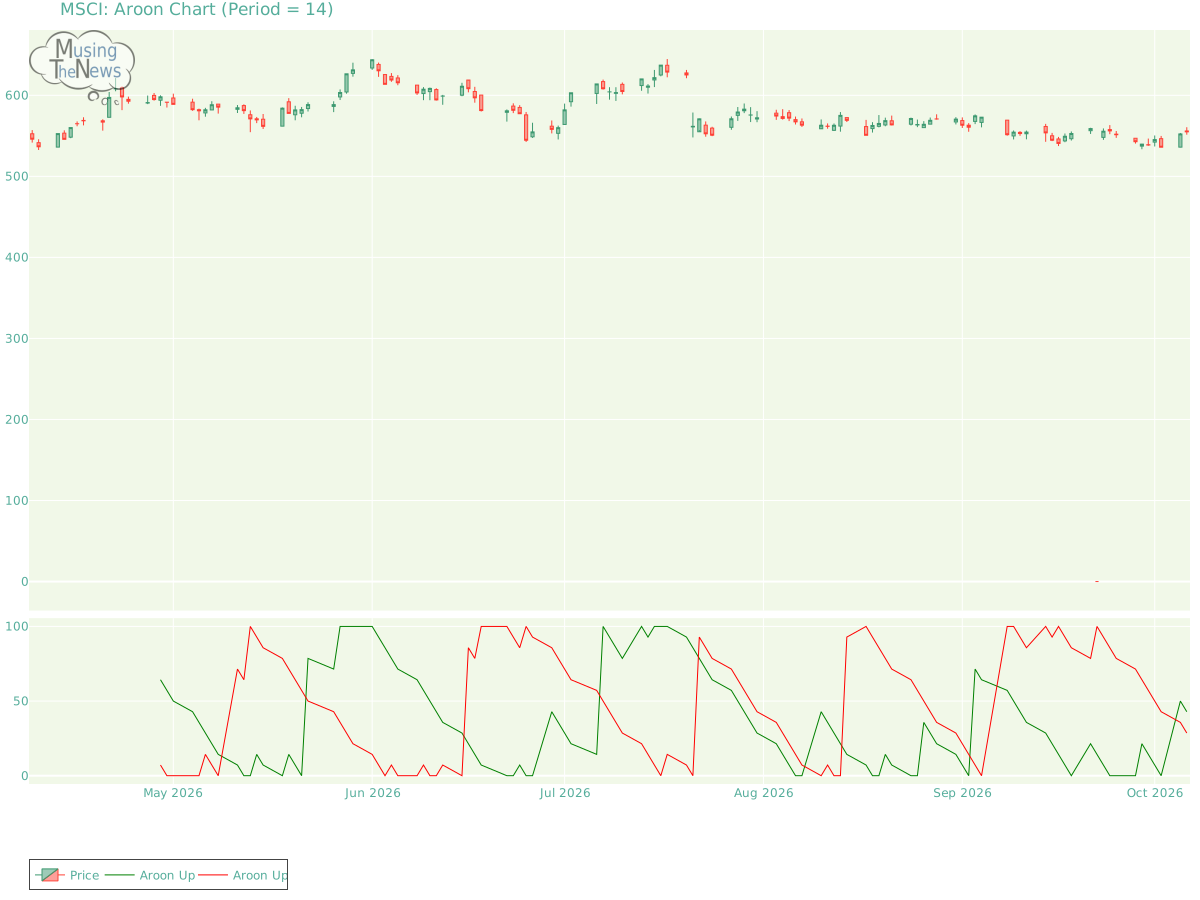
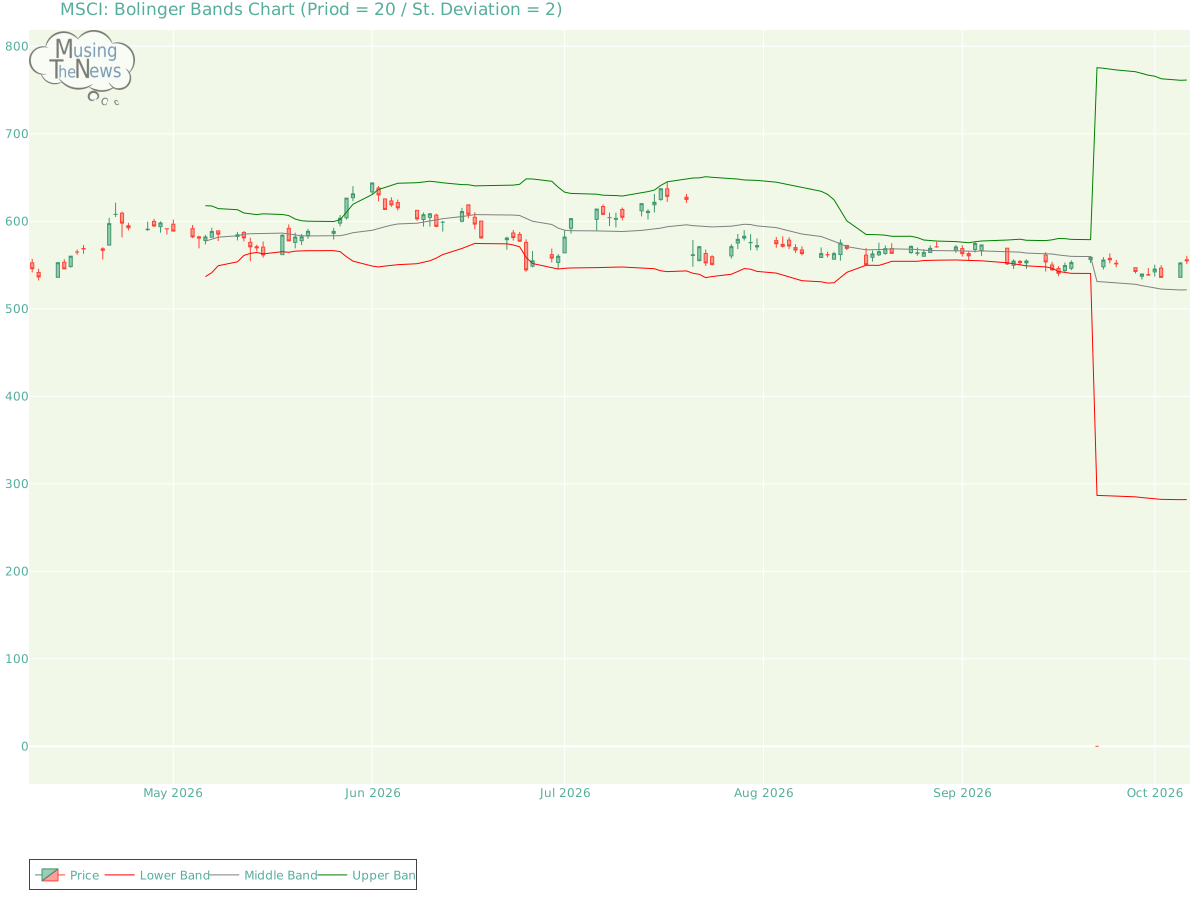
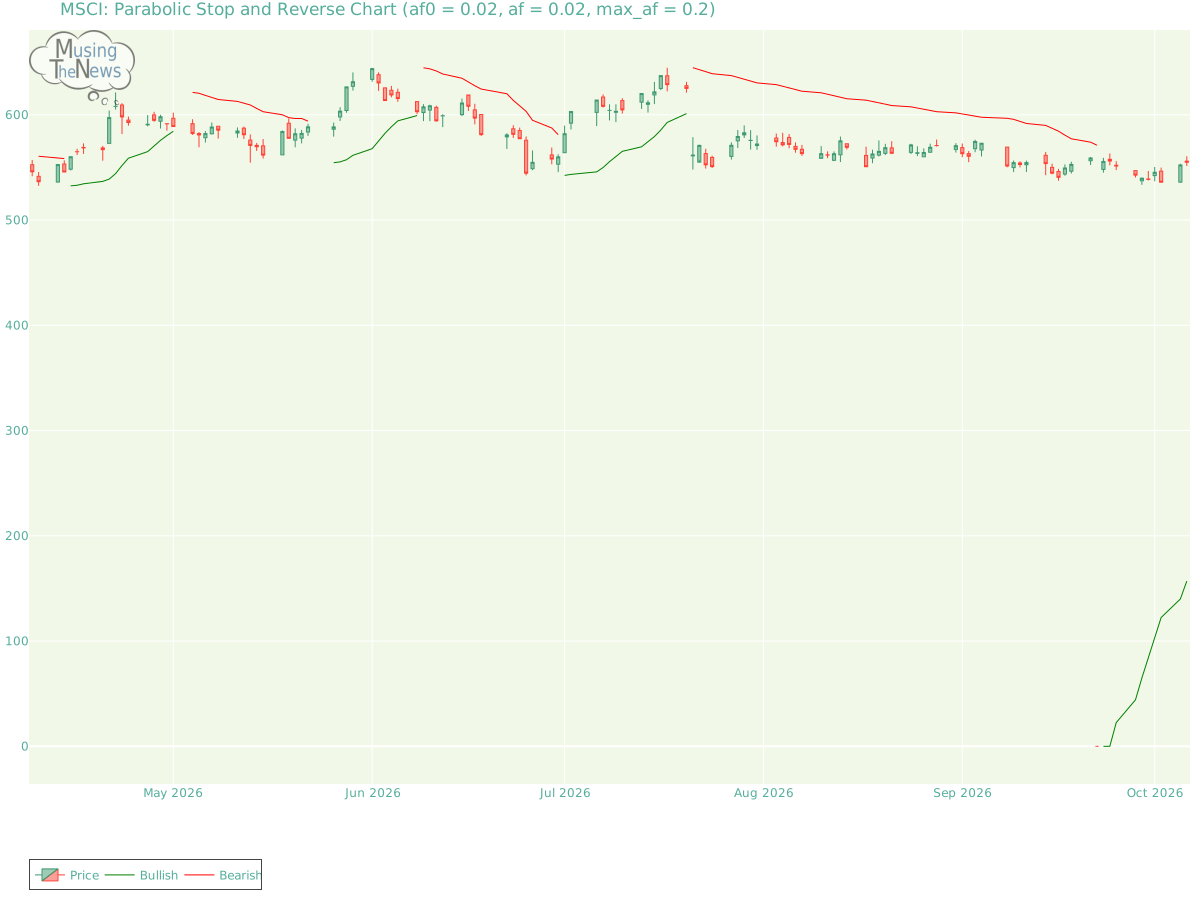
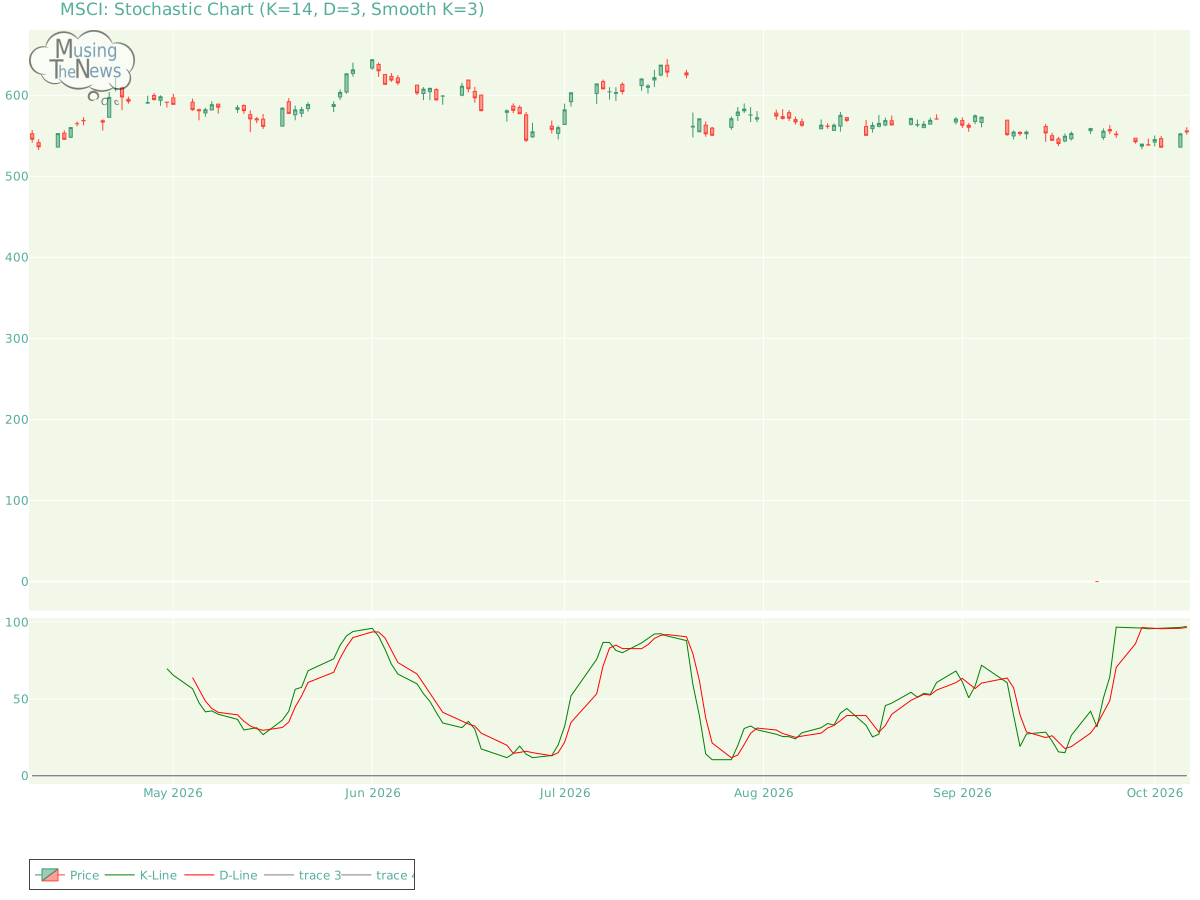
Support and Resistance: The price of 554.92 is supported at 544.56 and faces resistance at 564.22. This range suggests key levels for MSCI where the price may stabilize, with 544.56 acting as a support and 564.22 as a cap on gains.Support/Resistance for MSCIAroon: The AROON is currently neutral, showing no clear bias toward an upward or downward trend. This suggests that the market may be in a phase of indecision or consolidation.Aroon chart for MSCI Inc.Bol. Bands: The current state of the BOLL BANDS is neutral, providing no clear signals for either an upward or downward movement. This indicates that the market may be in a state of equilibrium, with no strong momentum in either direction.Bolinger Bands chart for MSCI Inc.Parabolic SAR: The PSAR for MSCI continues to be bullish, establishing a crucial support level that may help maintain the current upward trend. This level of support suggests that the market is poised to continue its positive trajectory, offering a foundation for further growth.Parabolic Stop and Reverse chart for MSCI Inc.Stochastic: The stochastic indicator reflects bullish conditions, with the K-line above both the D-line and the 80 mark. This setup suggests that the market has strong upward momentum, likely leading to further gains. Traders may consider this a signal of continued strength in the market.Stochastic chart for MSCI Inc.Tripple Moving Agerage: The moving averages for MSCI for the 20-50-100 periods point to a bullish trend, but the slopes of the faster averages suggest this strength may be waning. The potential for a reversal is becoming apparent, as the shorter-term averages indicate that the upward momentum could be weakening, signaling a possible trend change.Tripple SMA chart for MSCI Inc. Before focusing on a company's technical data, such as stock price movements, it's essential to analyze its fundamentals. These include factors like profitability, cash flow, and debt management. Additionally, considering the broader industry landscape—including market trends, competition, and regulatory changes—offers deeper insights. This comprehensive approach allows for a more meaningful interpretation of the company's technical indicators, providing a clearer picture of its financial health and future prospects.