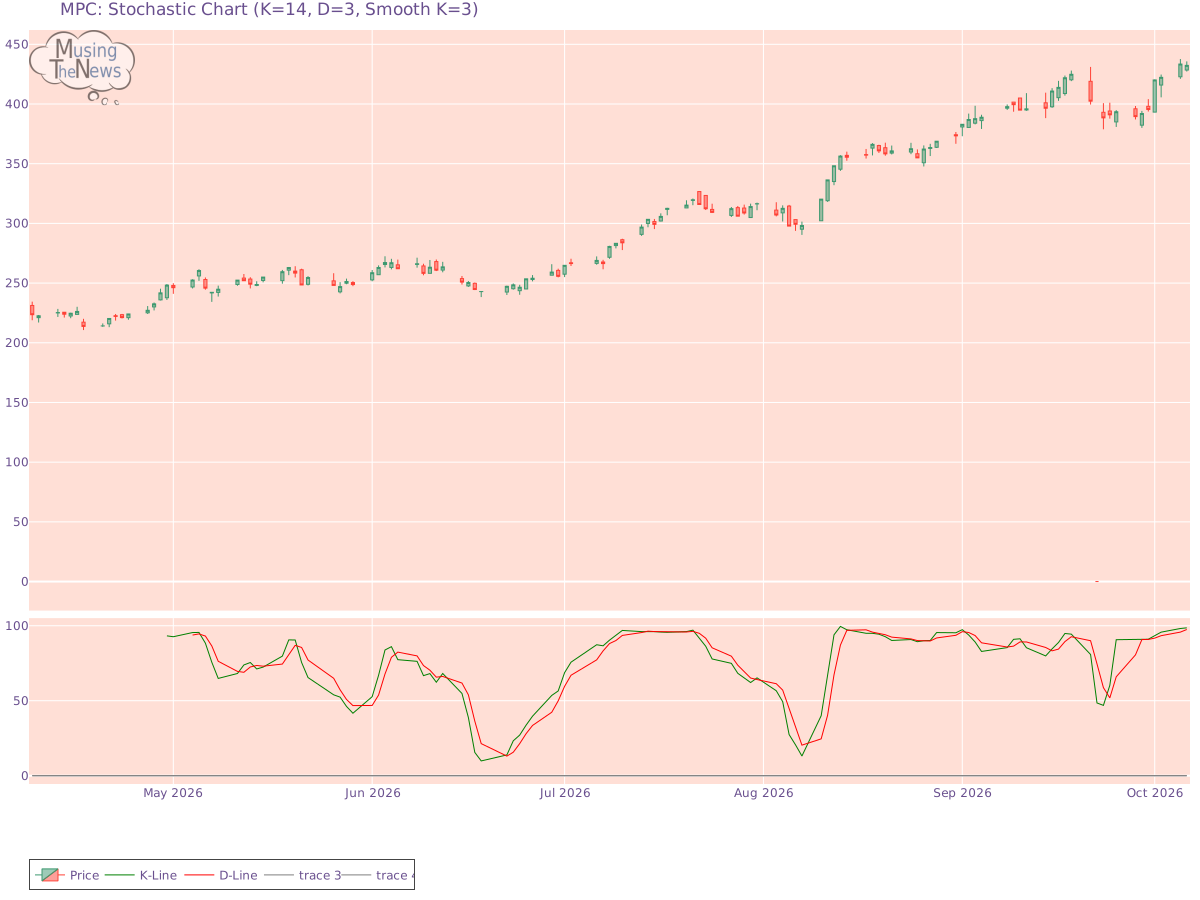
The stochastic indicator shows a bullish trend for MPC, with the K-line positioned above the D-line and surpassing the 80 level. This setup indicates strong upward momentum...
By MusingTheNews
Updated 2026-10-07 23:26:34
Overall Technical outlook
Price Summary
2026-10-06, saw MPC's stock open at 428.45, hit a peak of 435.69, fall to a low of 427.2, and close up 0.91% at 432.36, with 1570100 shares changing hands. The top price for the stock in the last 52 weeks is 433.47, with the bottom price being 0.0.
Technicals
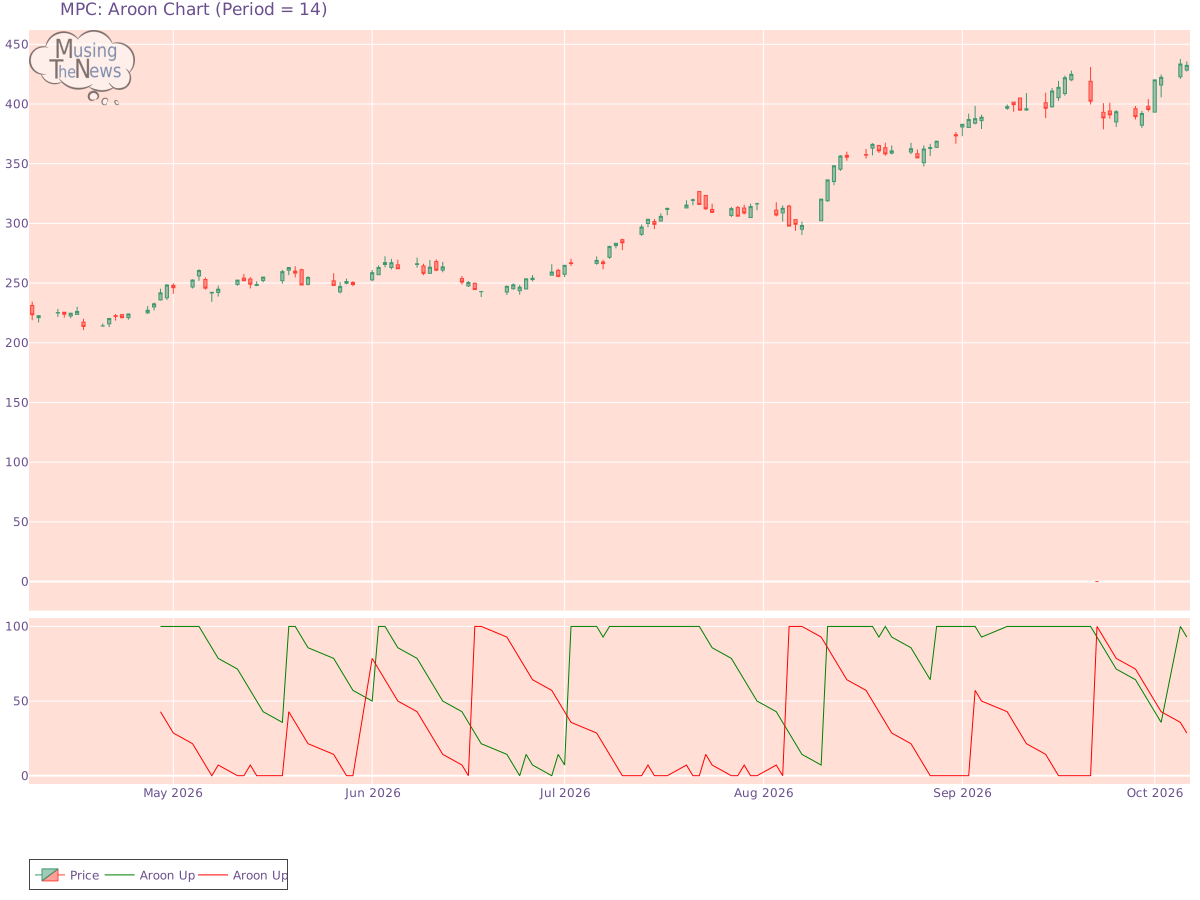
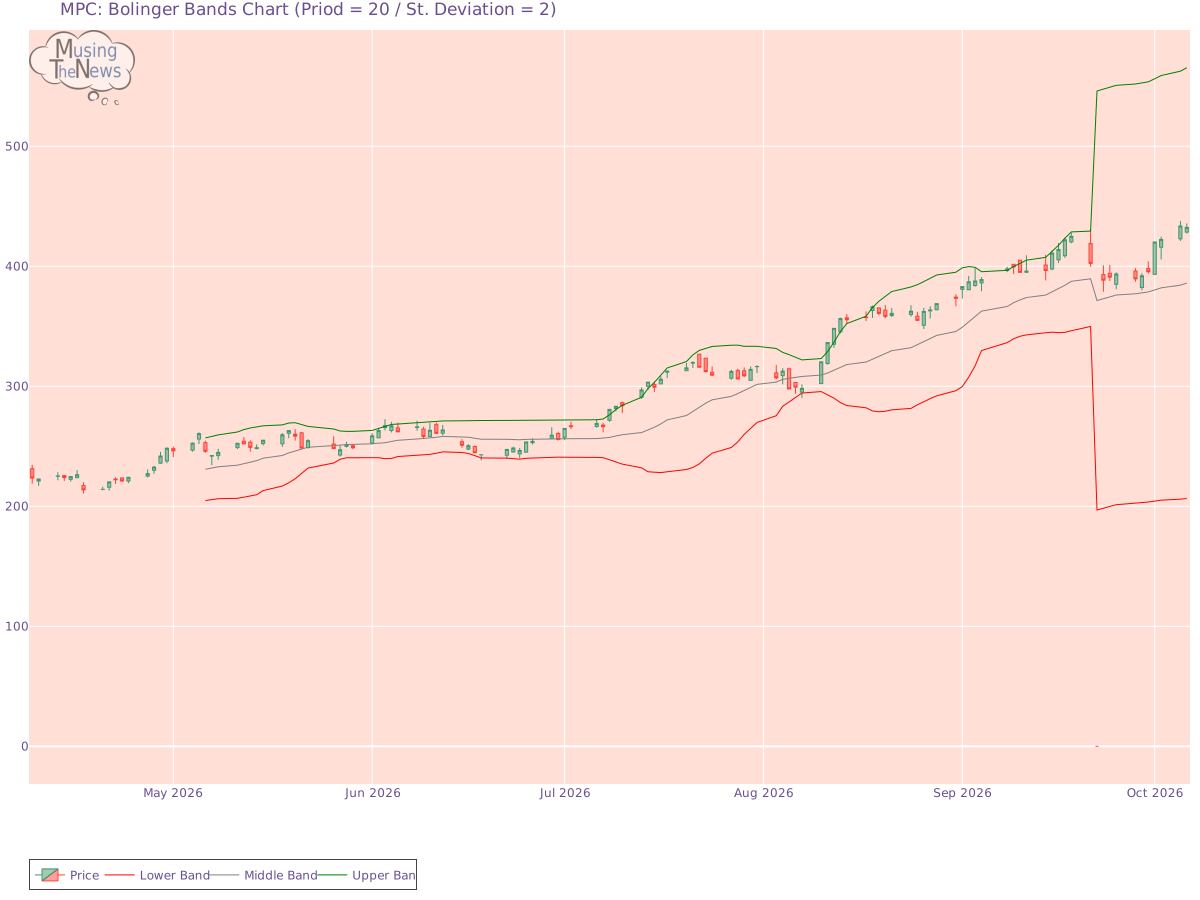
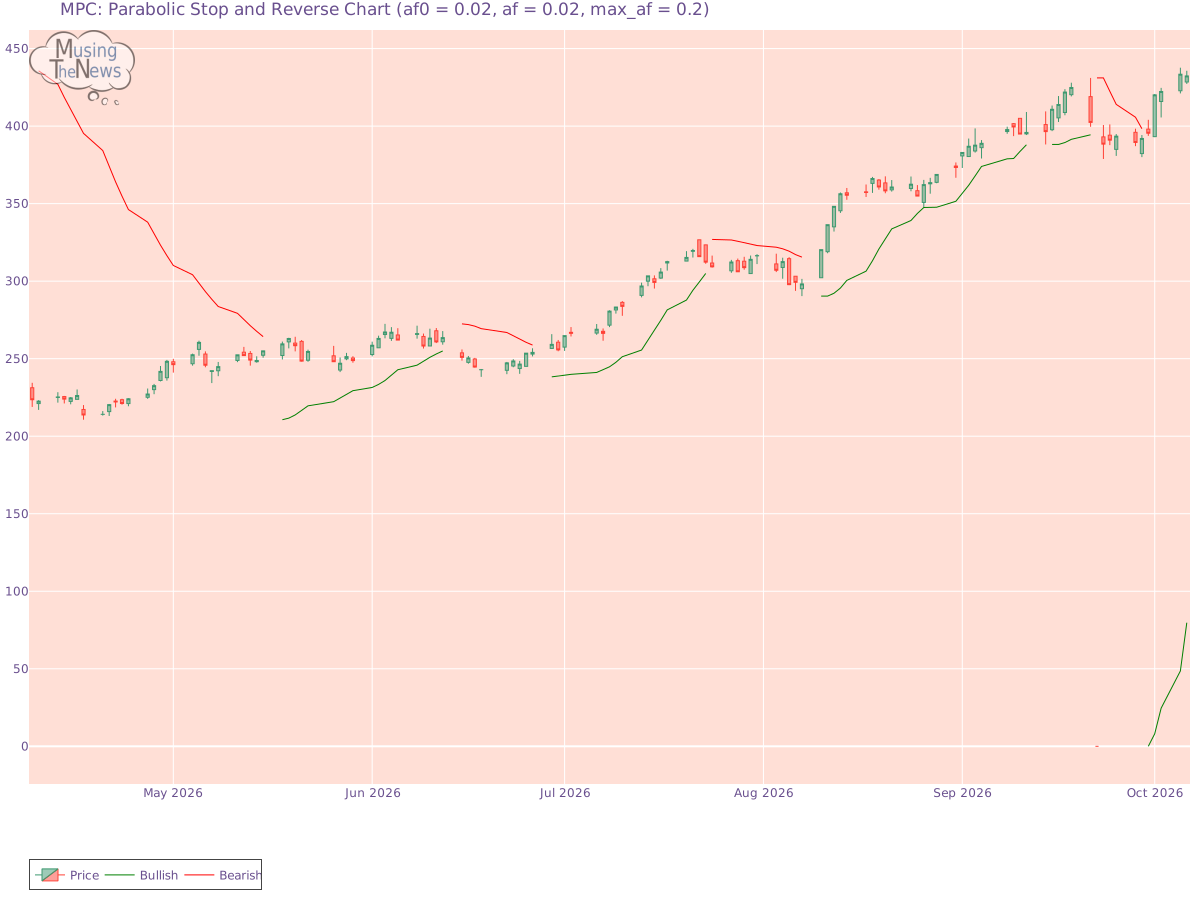
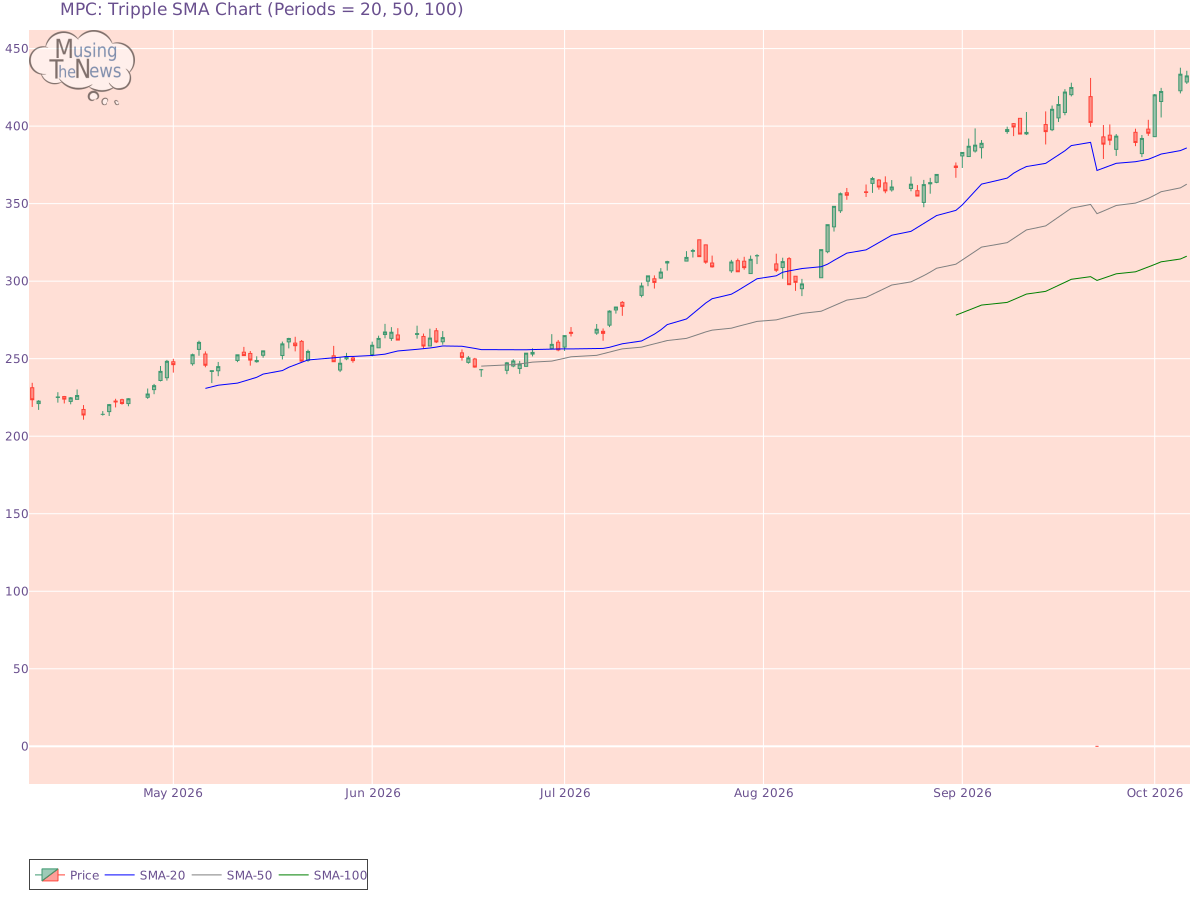
Aroon: The AROON is currently neutral, offering no clear guidance on market direction. This suggests that the market may be in a state of pause, with no strong trend emerging.Aroon chart for Marathon Petroleum CorporationBol. Bands: The BOLL BANDS is in a neutral stance, with no clear signals for movement up or down. This neutral position indicates a potential period of consolidation or uncertainty in the market.Bolinger Bands chart for Marathon Petroleum CorporationParabolic SAR: The PSAR for MPC continues to signal a bullish outlook, establishing a crucial support level that may help sustain the current upward momentum. This level of support suggests that the market is likely to continue trending higher, providing a foundation for ongoing bullish movement.Parabolic Stop and Reverse chart for Marathon Petroleum CorporationStochastic: The stochastic indicator shows a bullish trend for MPC, with the K-line positioned above the D-line and surpassing the 80 level. This setup indicates strong upward momentum, suggesting that the market may continue its positive trajectory. Traders might view this as a sign of ongoing strength in the market.Stochastic chart for Marathon Petroleum CorporationTripple Moving Agerage: The alignment of the 20, 50, and 100 moving averages suggests a bearish trend, but the wavering slopes of the 20 and 50 SMAs hint at a potential shift. This weakening momentum could indicate that the bearish trend for MPC is losing steam, possibly leading to a bullish reversal in the near future. Investors should watch for signs of a market turnaround as the current downtrend shows signs of faltering.Tripple SMA chart for Marathon Petroleum Corporation When assessing a company's technical performance, such as stock price fluctuations and trading volume, it is crucial to first examine its fundamentals. These fundamentals include financial health, profitability, and growth potential. Additionally, understanding the industry's dynamics, including competitive pressures and market trends, is key to contextualizing the company's performance. By integrating these factors, a more comprehensive and meaningful analysis can be conducted, leading to more informed investment decisions.