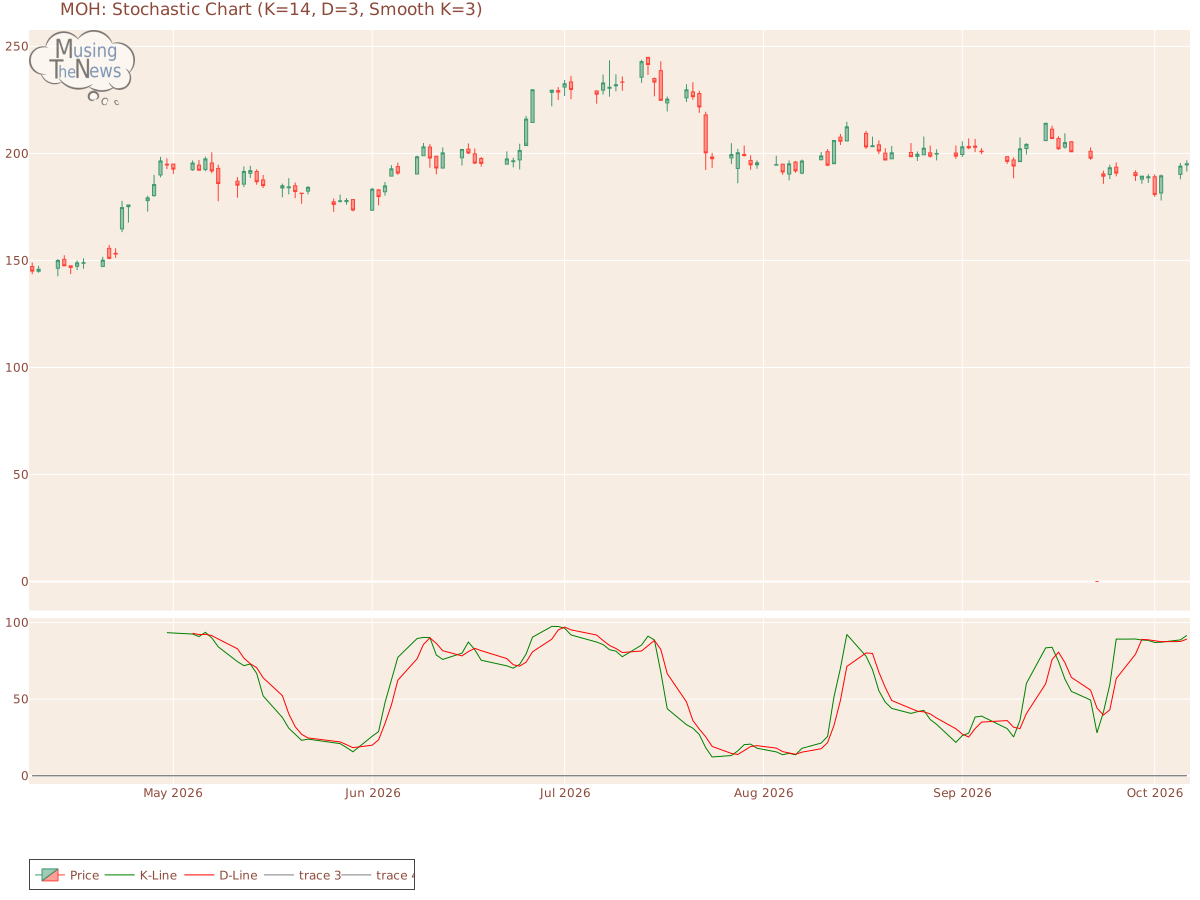
The stochastic indicator shows a bullish signal, with the K-line exceeding both the D-line and the 80 mark. This setup suggests strong upward momentum, implying that the ma...
By MusingTheNews
Updated 2026-10-07 23:26:38
Overall Technical outlook
Price Summary
2026-10-06, saw MOH's stock open at 194.66, hit a peak of 196.79, fall to a low of 191.58, and close up 0.26% at 195.17, with 470900 shares changing hands. The stock reached its highest price of 242.88 and lowest price of 0.0 over the last 52 weeks.
Technicals
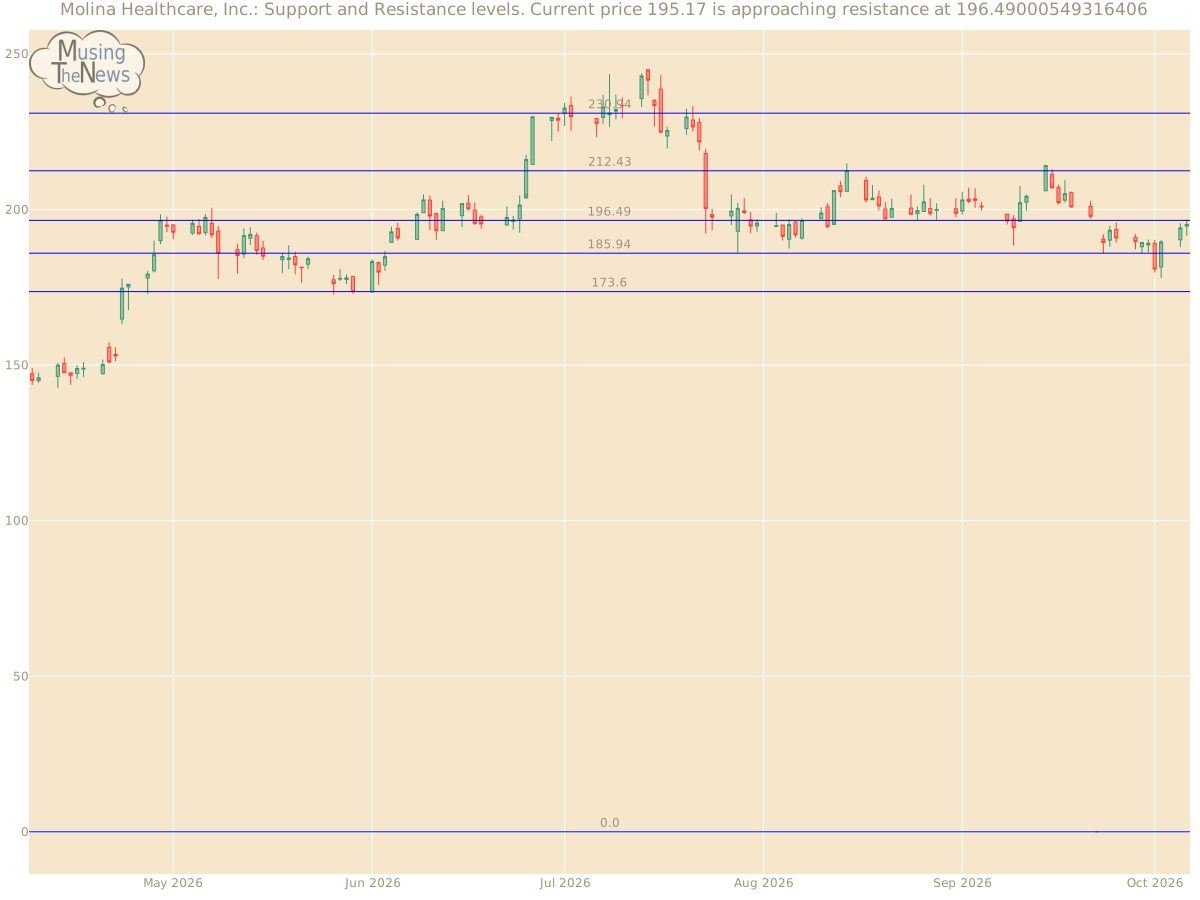
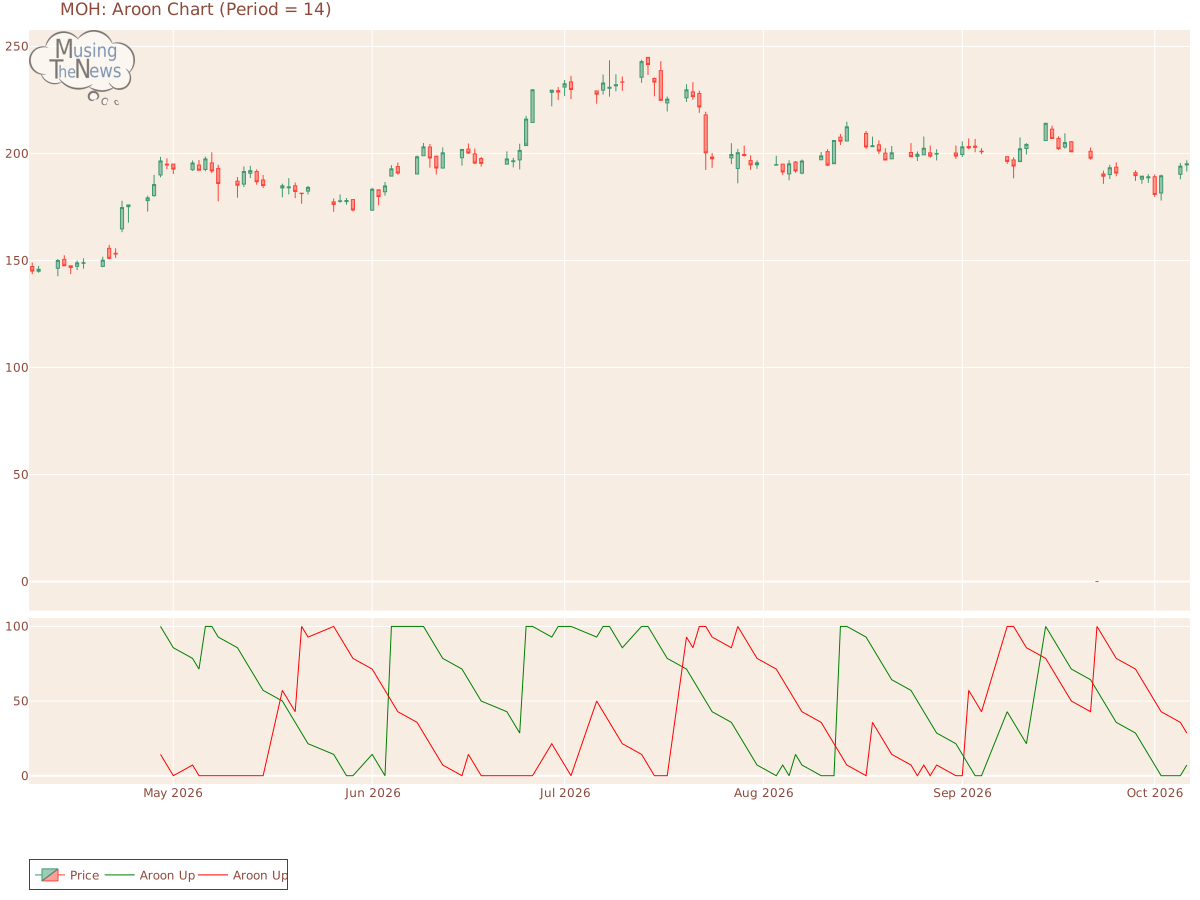
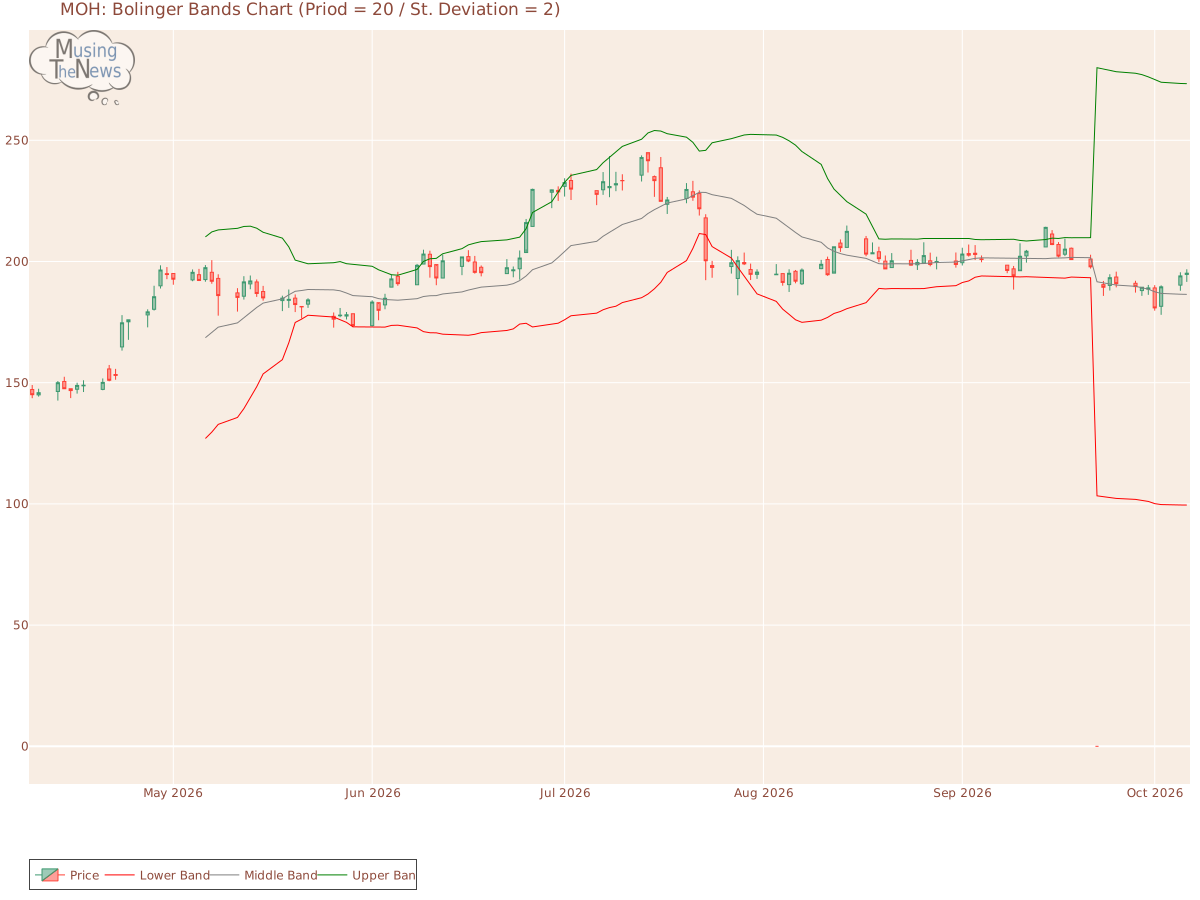
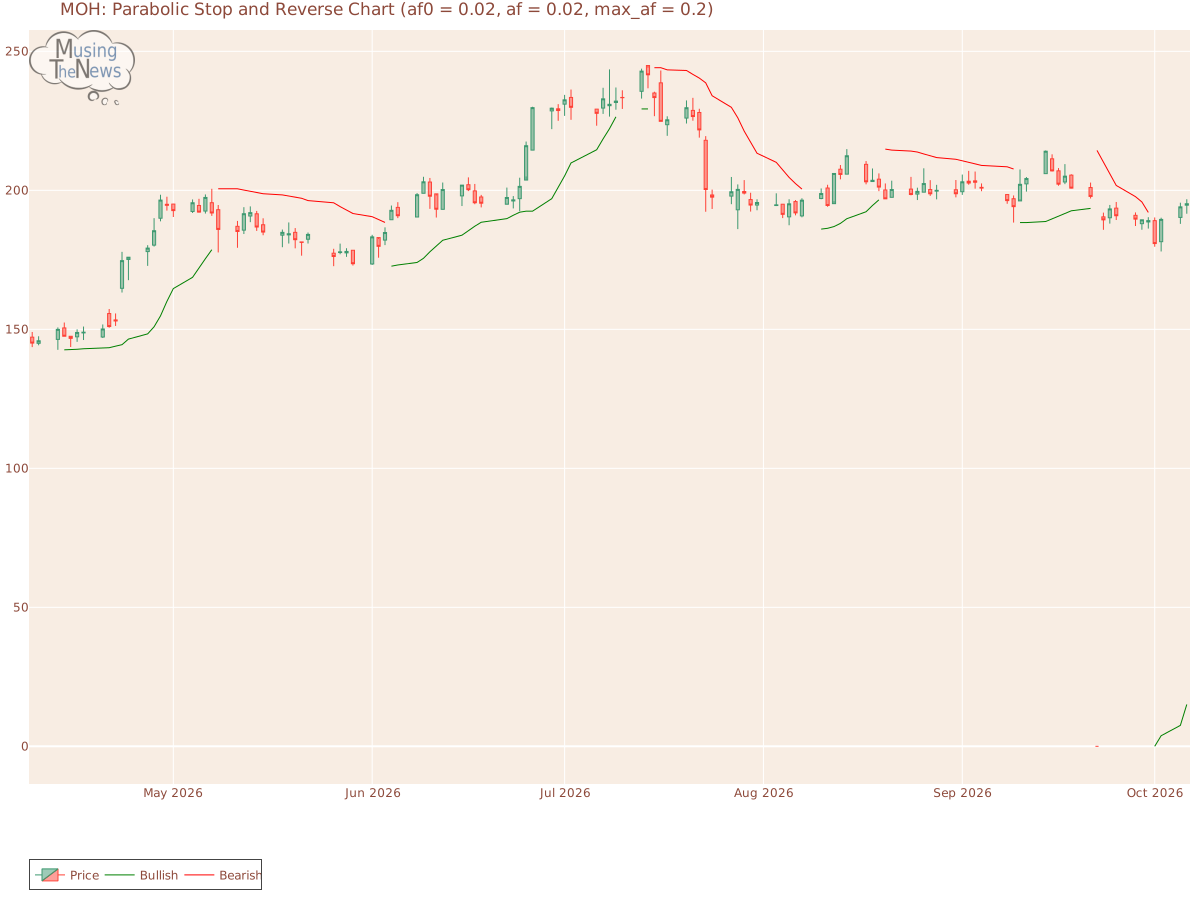
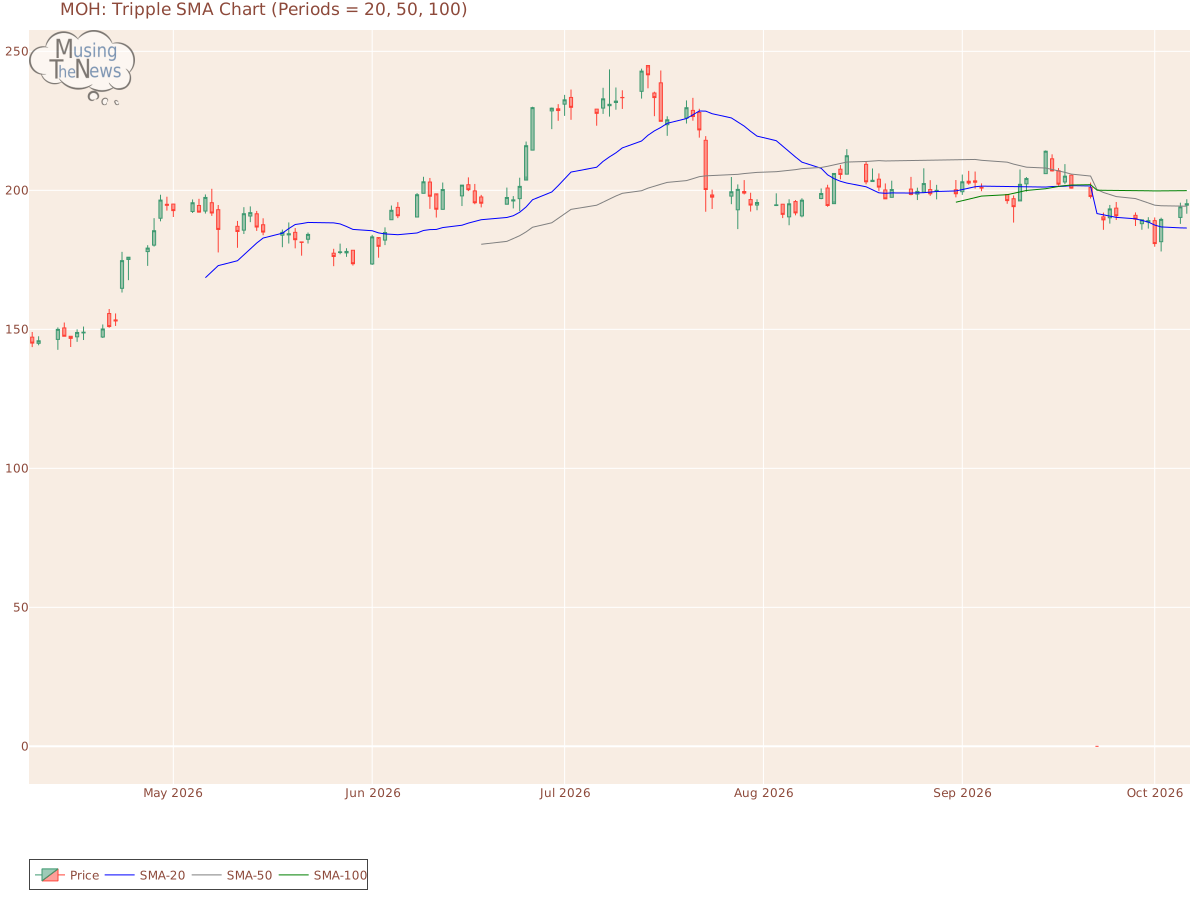
Support and Resistance: The current price sits at 195.17, supported at 185.94 and capped by resistance at 196.49. These levels define a range for MOH where the price might stabilize, with 185.94 as a floor and 196.49 as a ceiling.Support/Resistance for MOHAroon: The AROON is in a neutral stance, with no clear signals for movement up or down. This neutral position indicates a potential period of consolidation or uncertainty in the market.Aroon chart for Molina Healthcare, Inc.Bol. Bands: The BOLL BANDS is in a neutral stance, not pointing to a clear trend in either direction. This suggests that the market may be lacking strong momentum, making it difficult to predict the next move.Bolinger Bands chart for Molina Healthcare, Inc.Parabolic SAR: The PSAR remains bullish, establishing a key support level that could help uphold the market's upward trajectory. This persistent bullish outlook suggests that the market may continue to rise, with the support providing a foundation for further gains.Parabolic Stop and Reverse chart for Molina Healthcare, Inc.Stochastic: The stochastic indicator shows a bullish signal, with the K-line exceeding both the D-line and the 80 mark. This setup suggests strong upward momentum, implying that the market may continue to rise. Investors could consider this a favorable sign for continued market growth for Molina Healthcare, Inc..Stochastic chart for Molina Healthcare, Inc.Tripple Moving Agerage: The current alignment of the 20, 50, and 100 moving averages shows a bullish trend, but the slopes of the 20 and 50 SMAs are losing strength. This weakening momentum could indicate that a trend reversal is imminent, potentially leading to a bearish shift in price action. Investors should be cautious as the market's upward trend may soon come to an end.Tripple SMA chart for Molina Healthcare, Inc. When evaluating a company's technical data, such as stock price charts or volume, it is essential to first consider its fundamentals. These fundamentals include financial stability, growth potential, and competitive advantages. Additionally, understanding the broader industry in which the company operates offers context that helps to make sense of technical patterns. By examining both the company's internal strengths and external environment, one can make more accurate and meaningful conclusions about its stock performance.