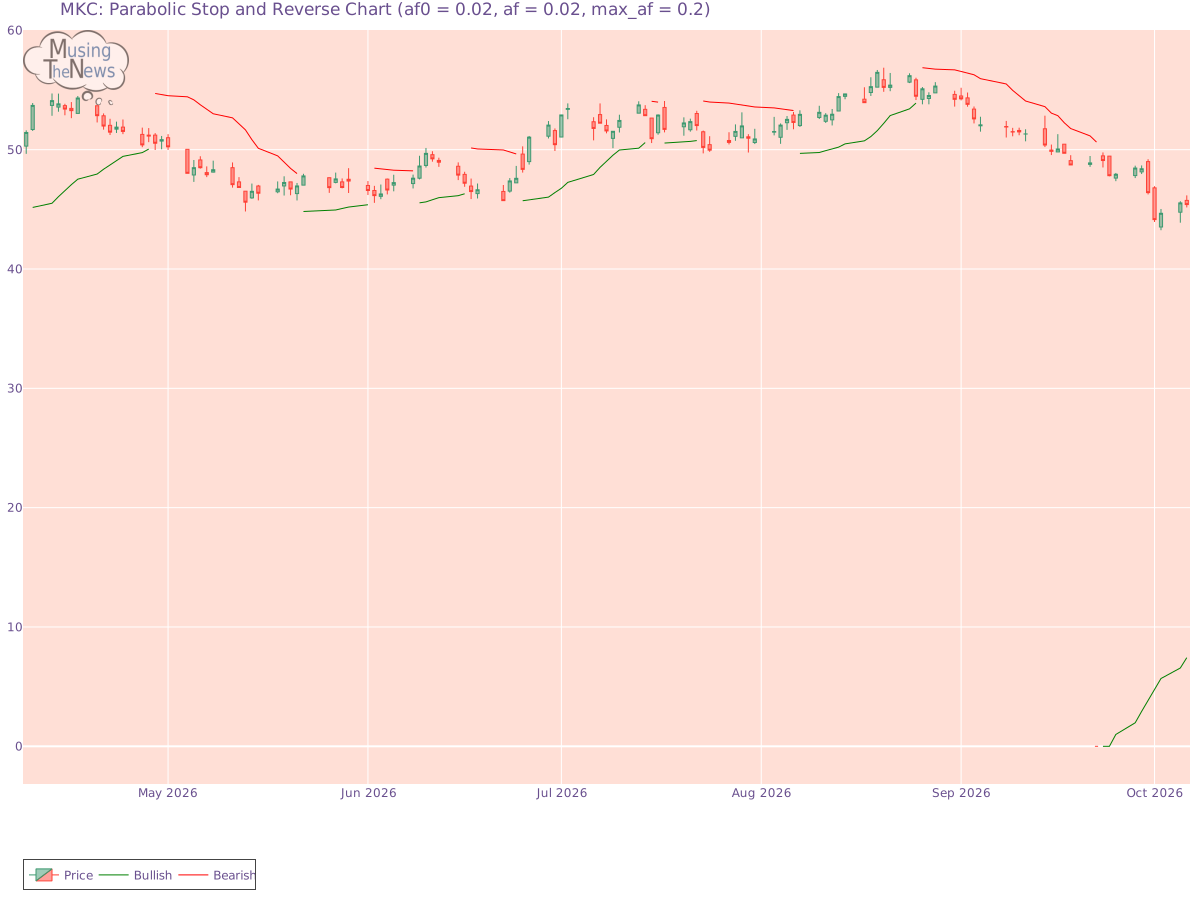
The PSAR continues its bullish outlook, reinforcing a crucial support level that may help sustain the current upward trend. This support suggests that the market is likely ...
By MusingTheNews
Updated 2026-10-07 23:26:35
Overall Technical outlook
Price Summary
On 2026-10-06, McCormick & Company, Incorporated's stock opened at 45.75, reached a high of 46.17, dropped to a low of 45.16, and closed lower -0.77% at 45.4, with a trading volume of 4102800 shares. Over the previous 52 weeks, the stock reached a high of 71.65 and a low of 0.0.
Technicals
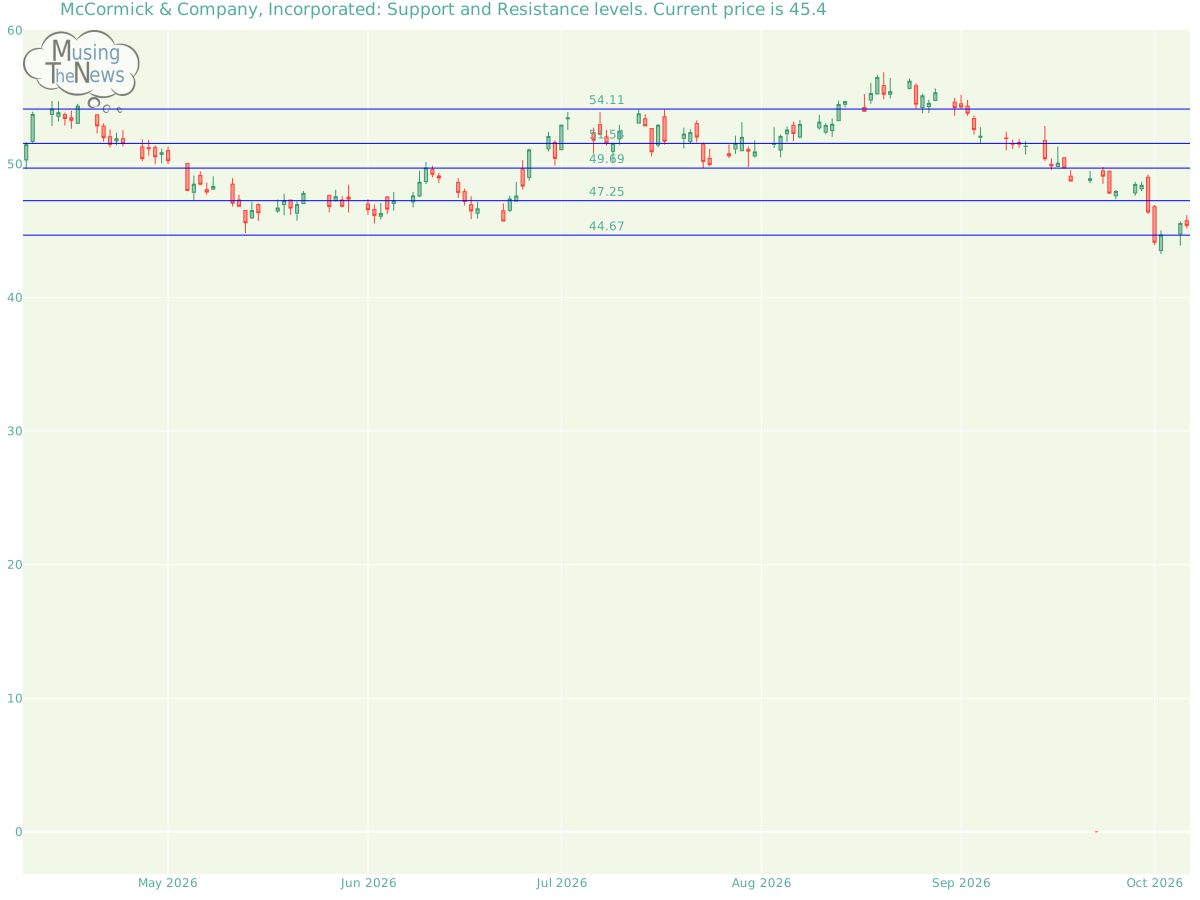
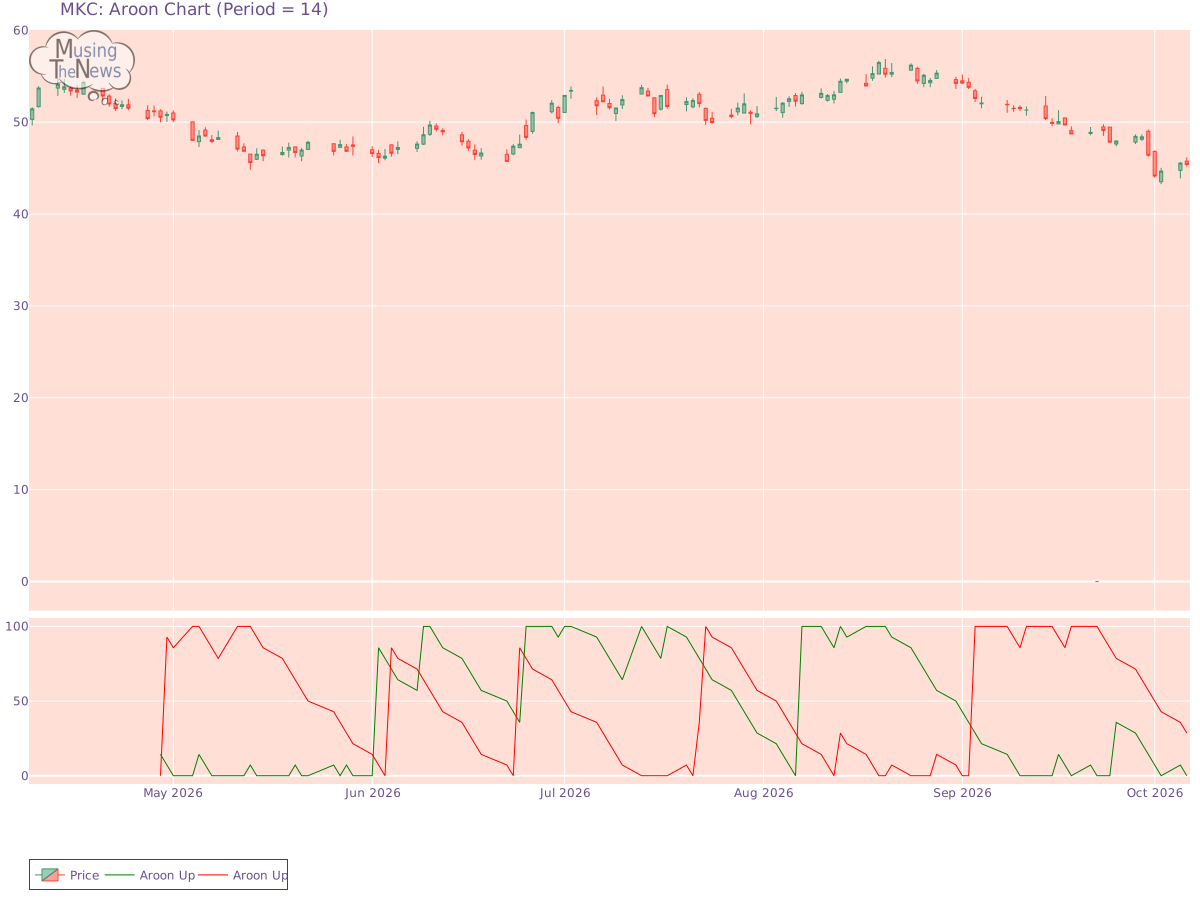
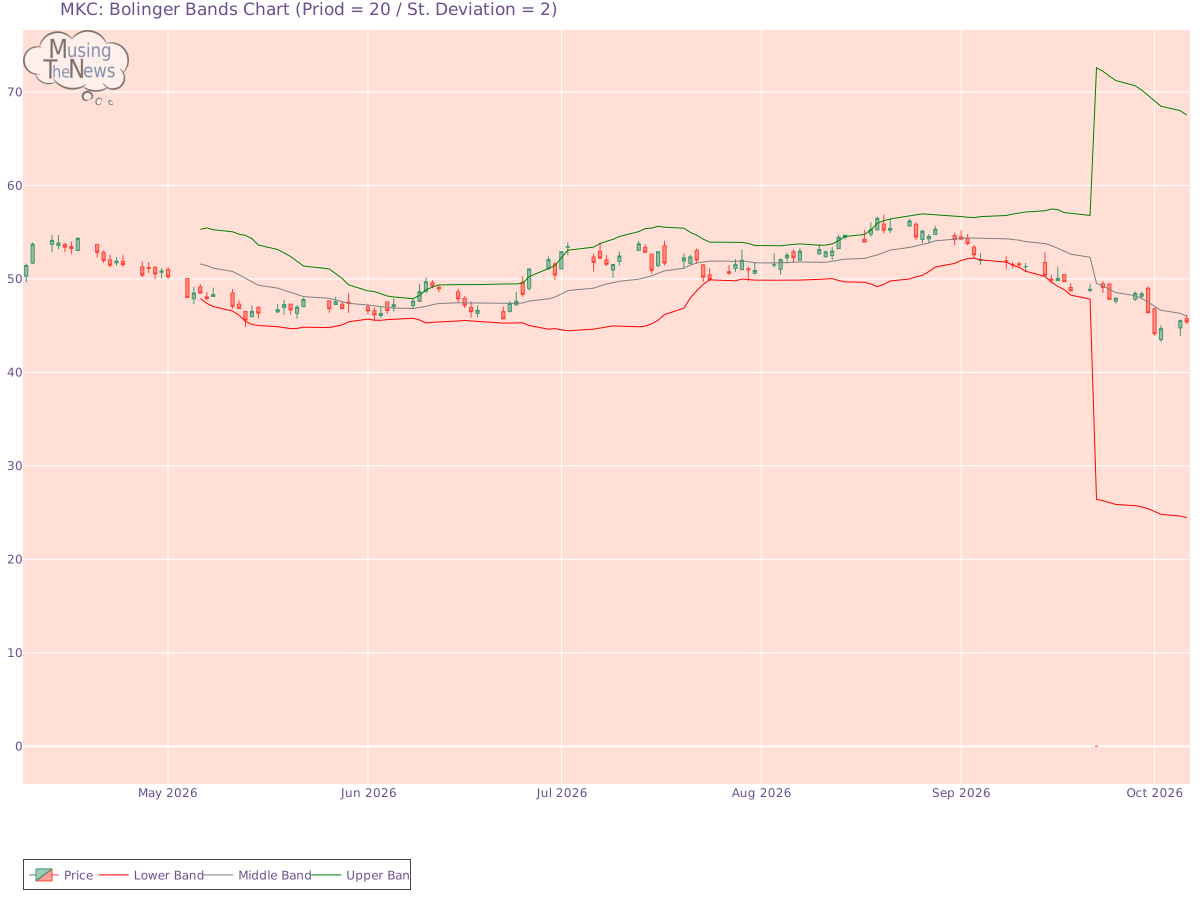
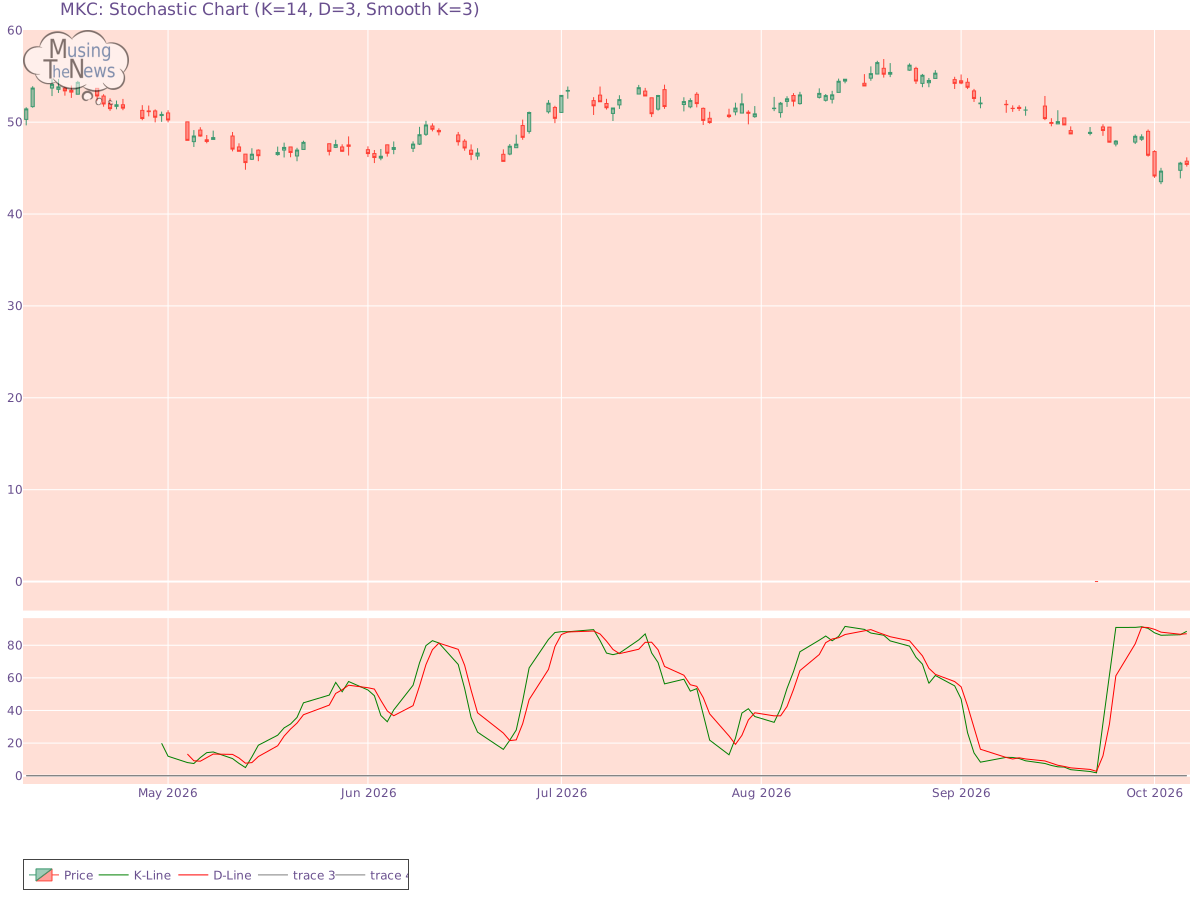
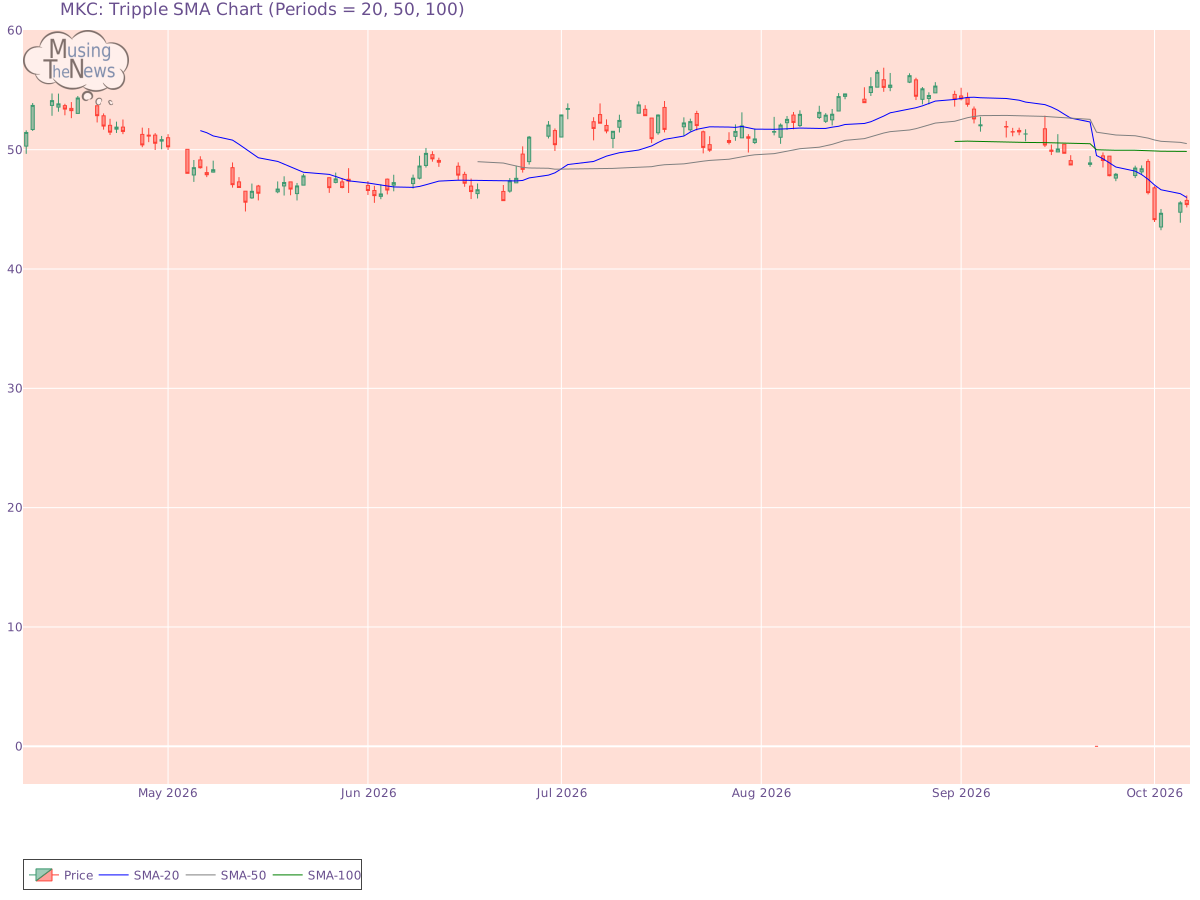
Support and Resistance: The current price of 45.4 is supported at 44.67, with resistance at 47.25. This suggests that the price for MKC might remain between these levels, where 44.67 acts as a floor and 47.25 as a ceiling in the market.Support/Resistance for MKCAroon: The AROON is in a neutral stance, with no clear signals for movement up or down. This neutral position indicates a potential period of consolidation or uncertainty in the market.Aroon chart for McCormick & Company, IncorporatedBol. Bands: The BOLL BANDS is currently in a neutral position, offering no clear indication of movement up or down. This suggests that the market may be experiencing a period of equilibrium, with no strong trend in play.Bolinger Bands chart for McCormick & Company, IncorporatedParabolic SAR: The PSAR continues its bullish outlook, reinforcing a crucial support level that may help sustain the current upward trend. This support suggests that the market is likely to continue climbing, with the bullish momentum remaining strong.Parabolic Stop and Reverse chart for McCormick & Company, IncorporatedStochastic: The stochastic indicator shows bullish conditions, with the K-line positioned above the D-line and exceeding the 80 level. This setup suggests strong upward momentum, indicating that the market may continue to rise. Investors might view this as a favorable sign for continued growth.Stochastic chart for McCormick & Company, IncorporatedTripple Moving Agerage: The Tripple MOVING AVG is showing a neutral reading, with no clear direction indicated for upward or downward movement. This neutral position suggests a possible period of consolidation.Tripple SMA chart for McCormick & Company, Incorporated When assessing a company's technical performance, such as stock price fluctuations and trading volume, it is crucial to first examine its fundamentals. These fundamentals include financial health, profitability, and growth potential. Additionally, understanding the industry's dynamics, including competitive pressures and market trends, is key to contextualizing the company's performance. By integrating these factors, a more comprehensive and meaningful analysis can be conducted, leading to more informed investment decisions.