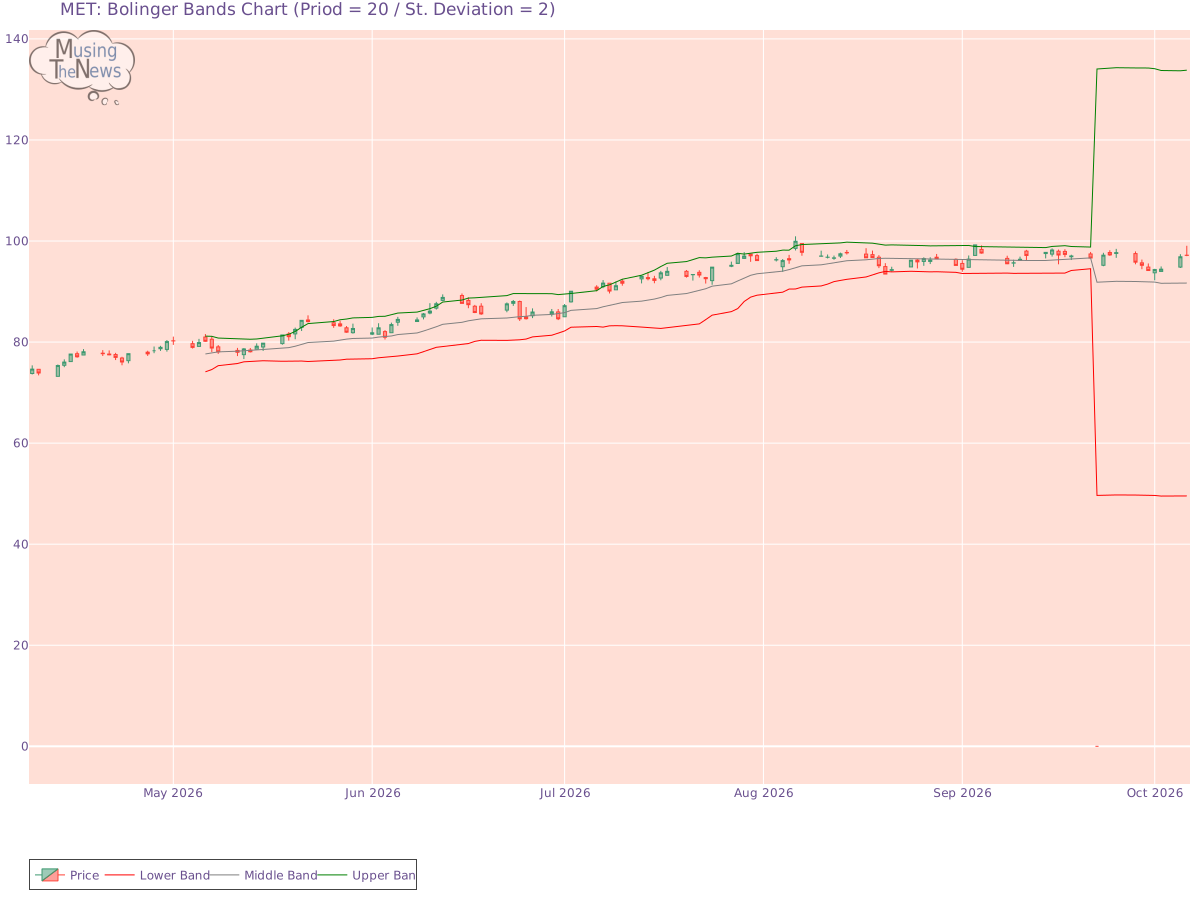
The BOLL BANDS is showing a neutral stance, not indicating a clear upward or downward trend for MetLife, Inc.. This suggests a period of market balance, where neither side ...
By MusingTheNews
Updated 2026-10-07 23:26:36
Overall Technical outlook
Price Summary
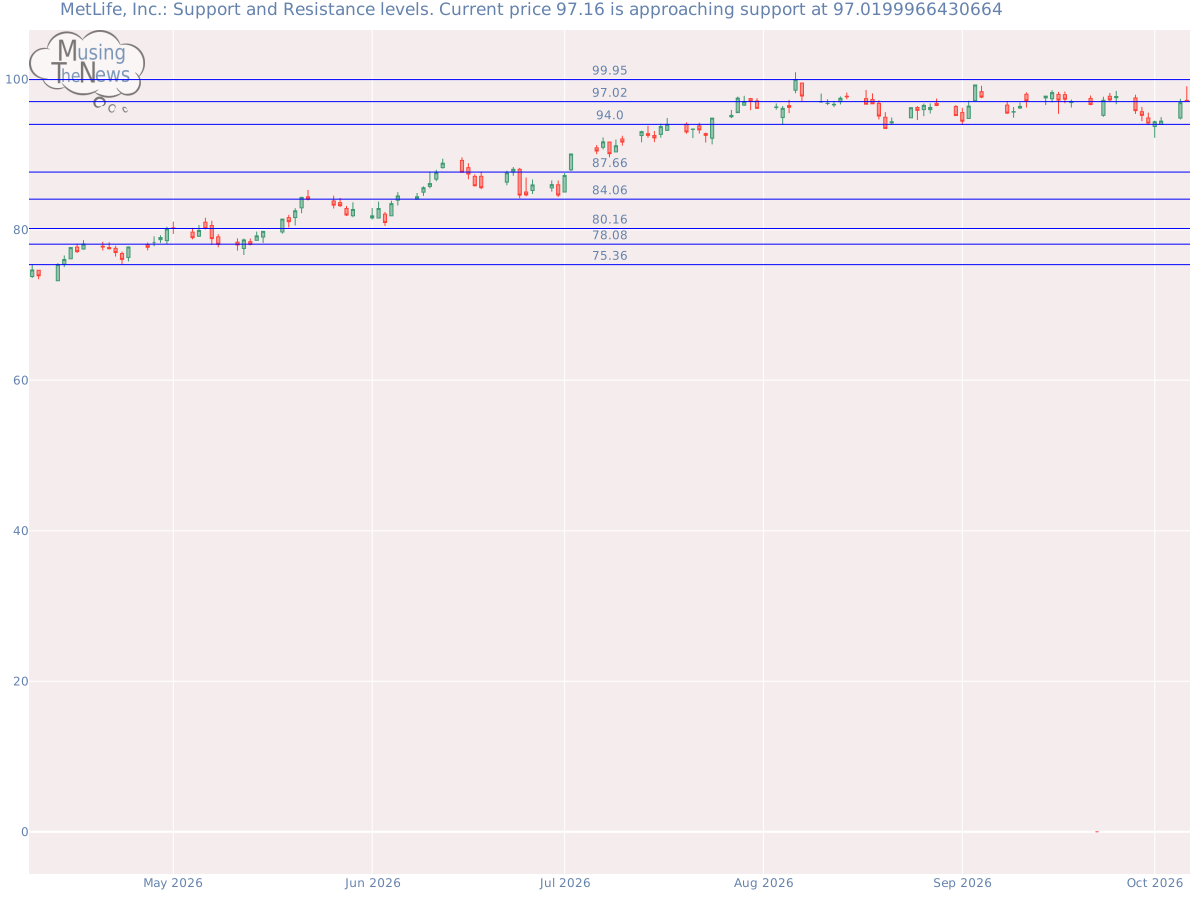
On 2026-10-06, MetLife, Inc.'s stock began at 97.19, peaked at 99.06, declined to 97.0, and ended the day -0.03% lower at 97.16, with 4300200 shares traded. In the last 52 weeks, the stock's top price was 99.95 and the bottom price was 0.0.
Technicals
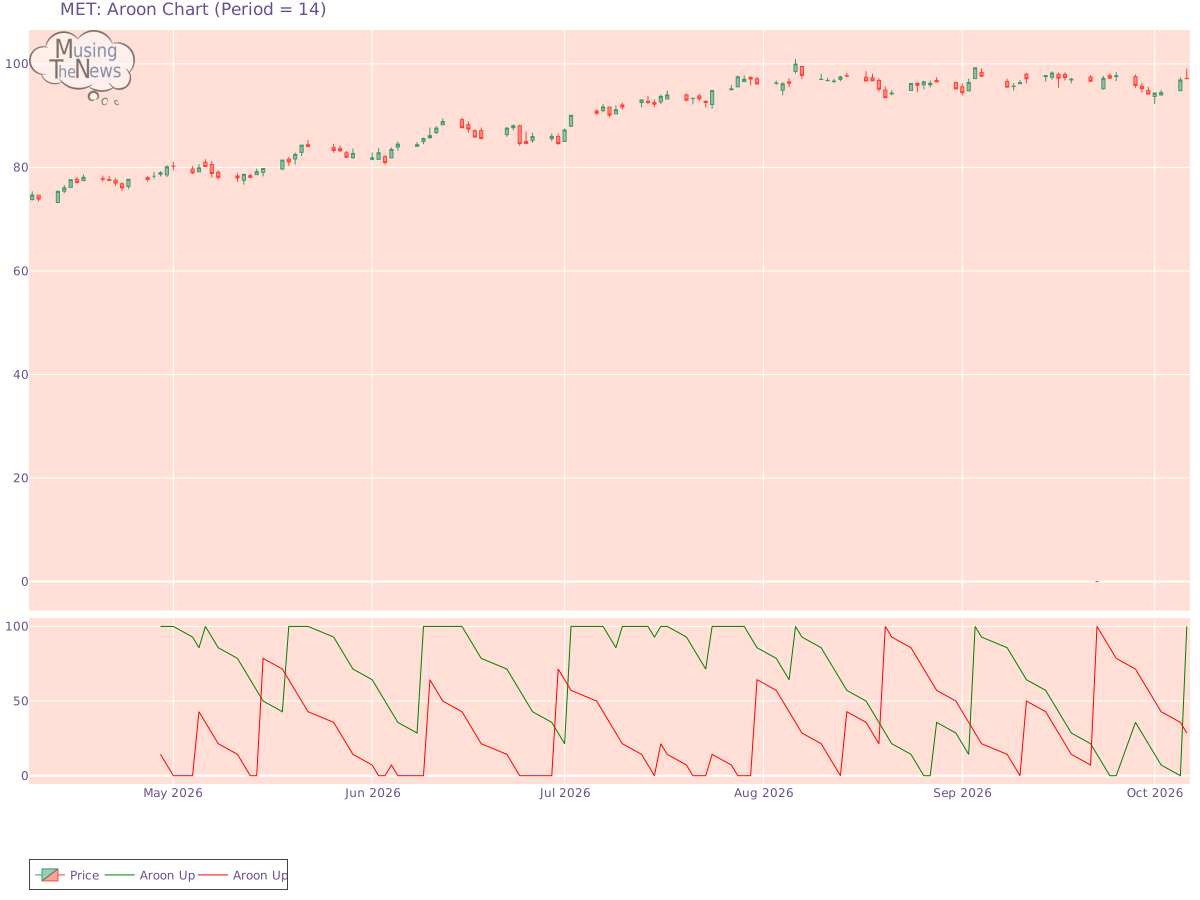
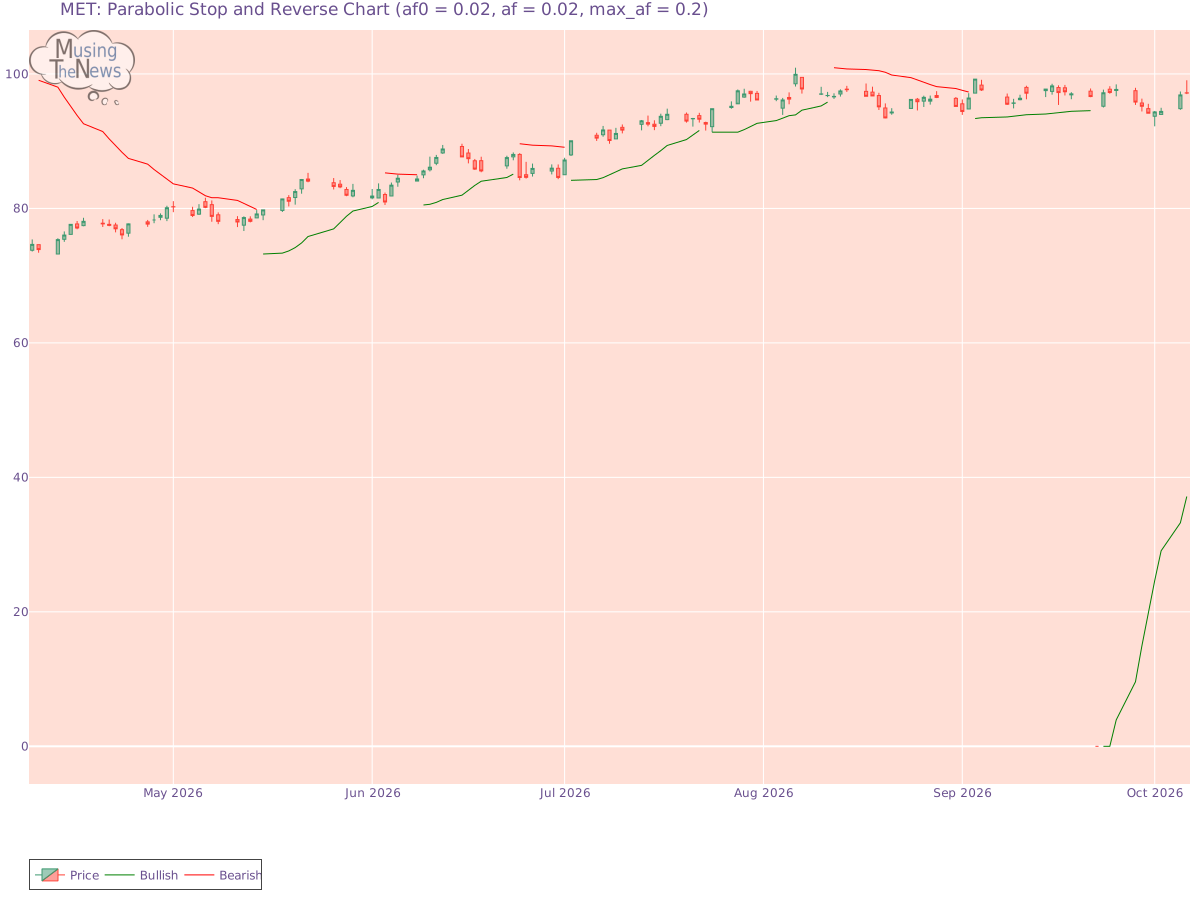
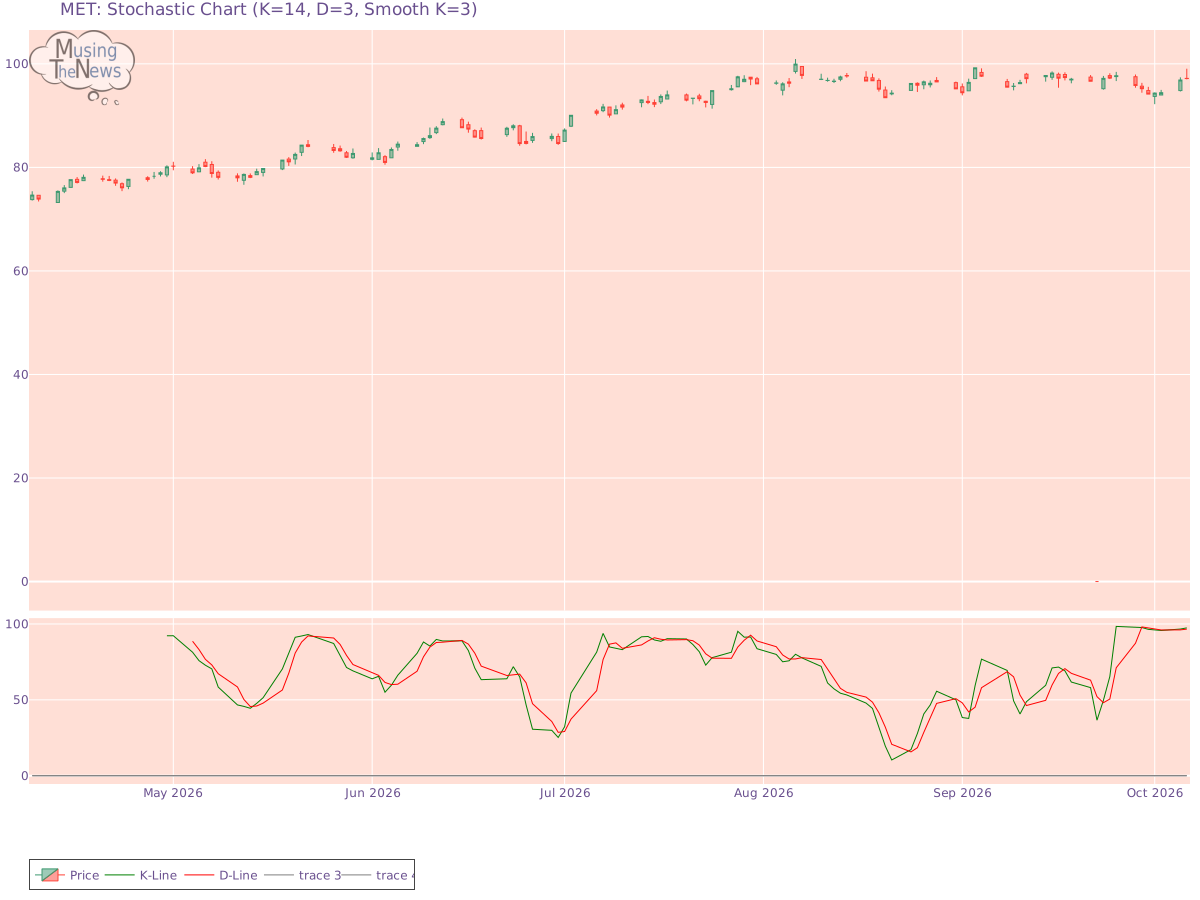
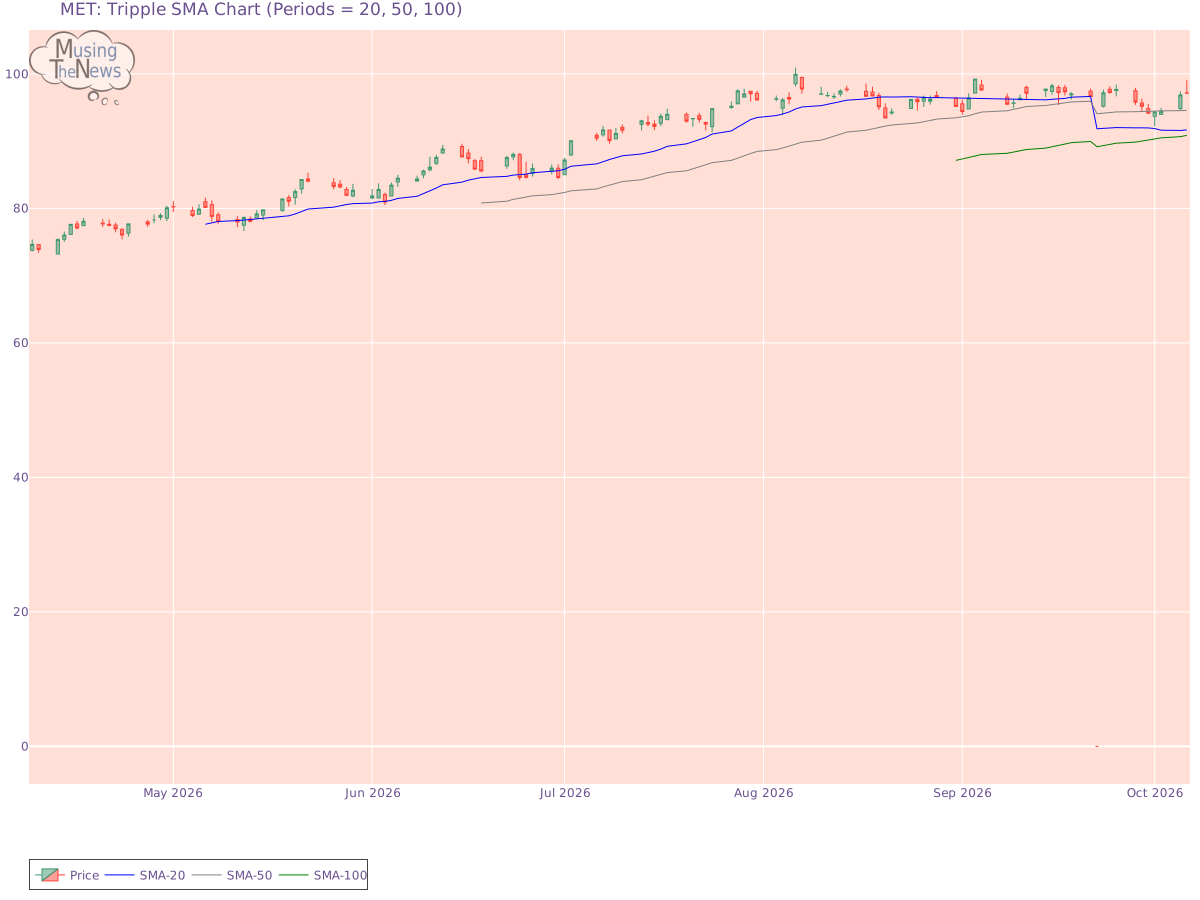
Support and Resistance: The price of 97.16 is supported at 97.02 and faces resistance at 99.95. This range suggests key levels for MET where the price may stabilize, with 97.02 acting as a support and 99.95 as a cap on gains.Support/Resistance for METAroon: The AROON indicator is showing a significant bullish trend, as the Aroon Up has risen and the Aroon Oscillator has reversed. This suggests a potential reversal to an upward trend, indicating that market sentiment is becoming more optimistic. Investors may anticipate continued upward momentum, with the market likely to experience further gains.Aroon chart for MetLife, Inc.Bol. Bands: The BOLL BANDS is showing a neutral stance, not indicating a clear upward or downward trend for MetLife, Inc.. This suggests a period of market balance, where neither side is showing dominance.Bolinger Bands chart for MetLife, Inc.Parabolic SAR: The PSAR continues to indicate a bullish outlook, establishing a key support level that could sustain the market's upward trend. This support suggests that the bullish momentum is likely to persist, offering a foundation for further growth.Parabolic Stop and Reverse chart for MetLife, Inc.Stochastic: The stochastic indicator is currently bullish, with the K-line exceeding both the D-line and the 80 level. This configuration indicates robust upward momentum, suggesting that the market may experience further gains. Investors may interpret this as a positive signal for continued upward movement.Stochastic chart for MetLife, Inc.Tripple Moving Agerage: The Tripple MOVING AVG is currently neutral, showing no clear bias toward a rising or falling trend. This lack of directional clarity suggests that the market may be in a holding pattern, awaiting further developments.Tripple SMA chart for MetLife, Inc. When evaluating a company, it is crucial to examine its fundamentals, including its financial statements, management structure, and market position. Additionally, understanding the broader industry trends, competition, and regulatory landscape helps to create a well-rounded view. By assessing both the company's internal factors and the external environment in which it operates, you can extract more valuable insights from its technical performance, such as stock price movements and trading patterns.