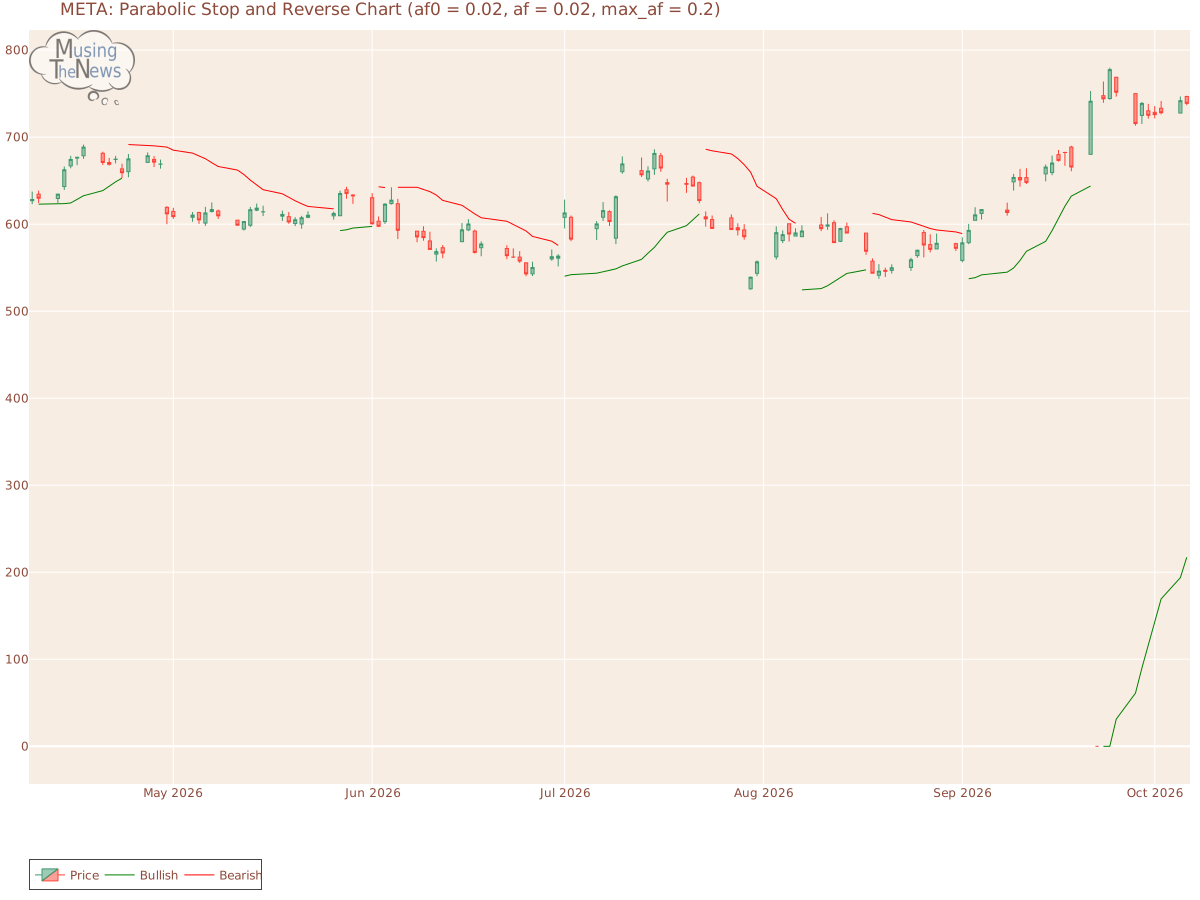
The PSAR remains bullish in its outlook, setting a key support level that could sustain the ongoing upward trend. This strong support indicates that the market may continue...
By MusingTheNews
Updated 2026-10-07 23:26:36
Overall Technical outlook
Price Summary
On 2026-10-06, Meta Platforms, Inc.'s stock opened at 746.73, spiked to 747.6, declined to 736.69, and closed -1.05% lower at 738.88, with 12547300 shares traded. Over the past year, the stock's highest price was 777.59, and its lowest was 0.0.
Technicals
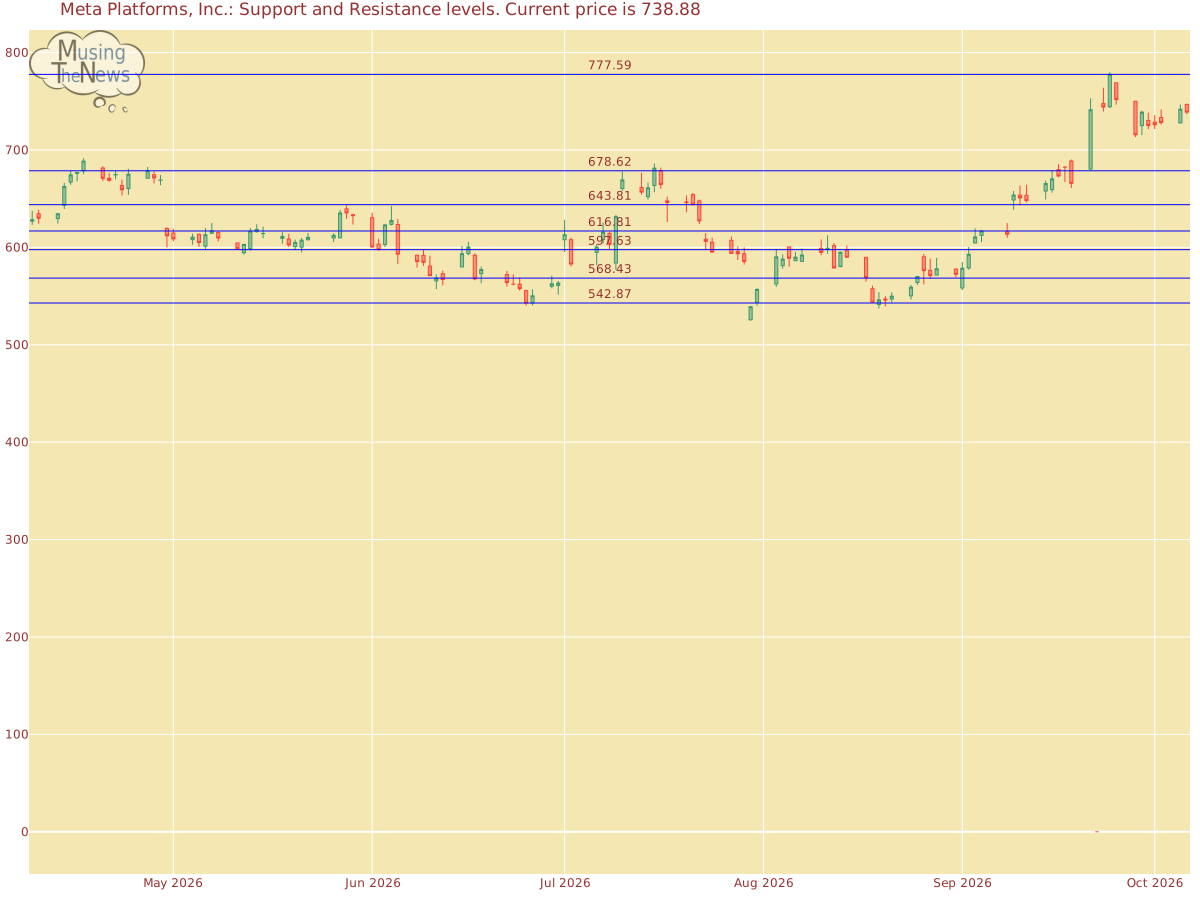
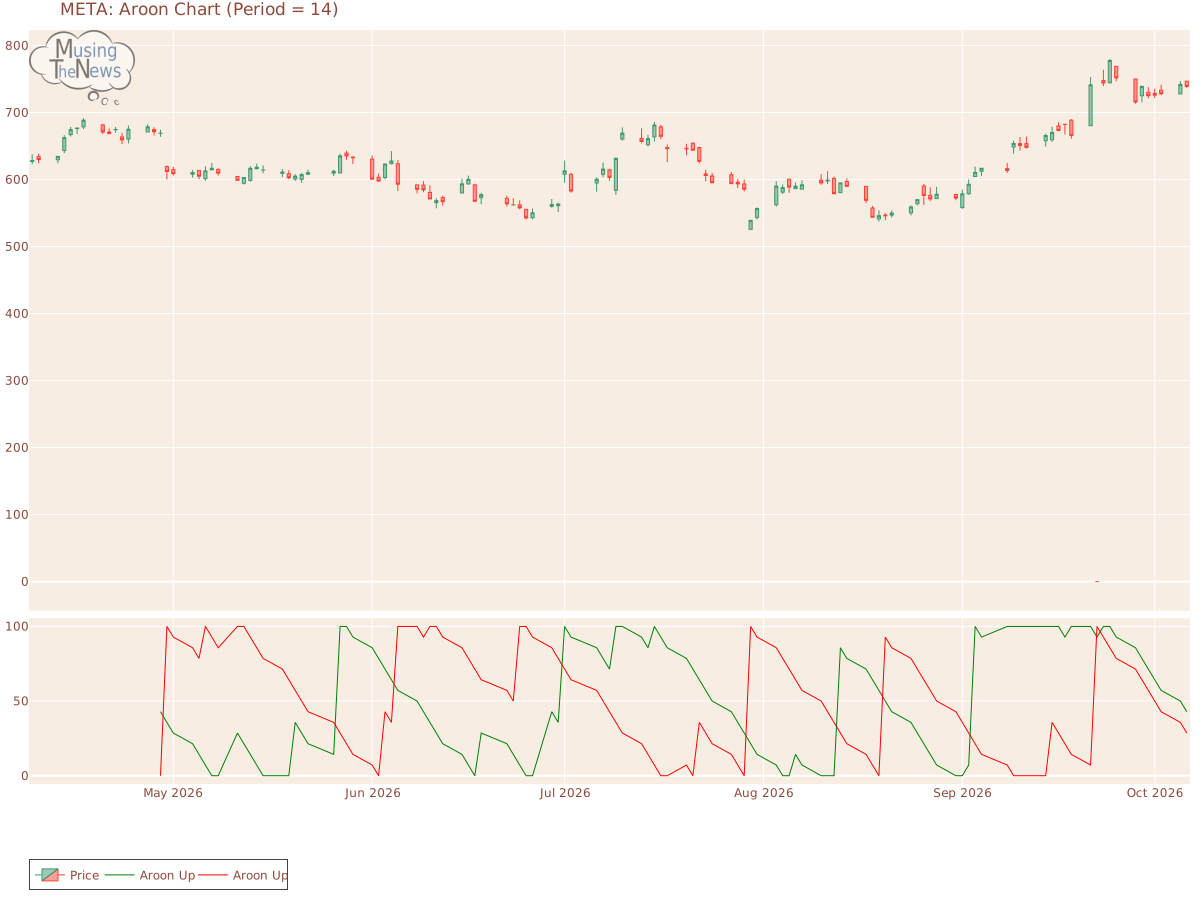
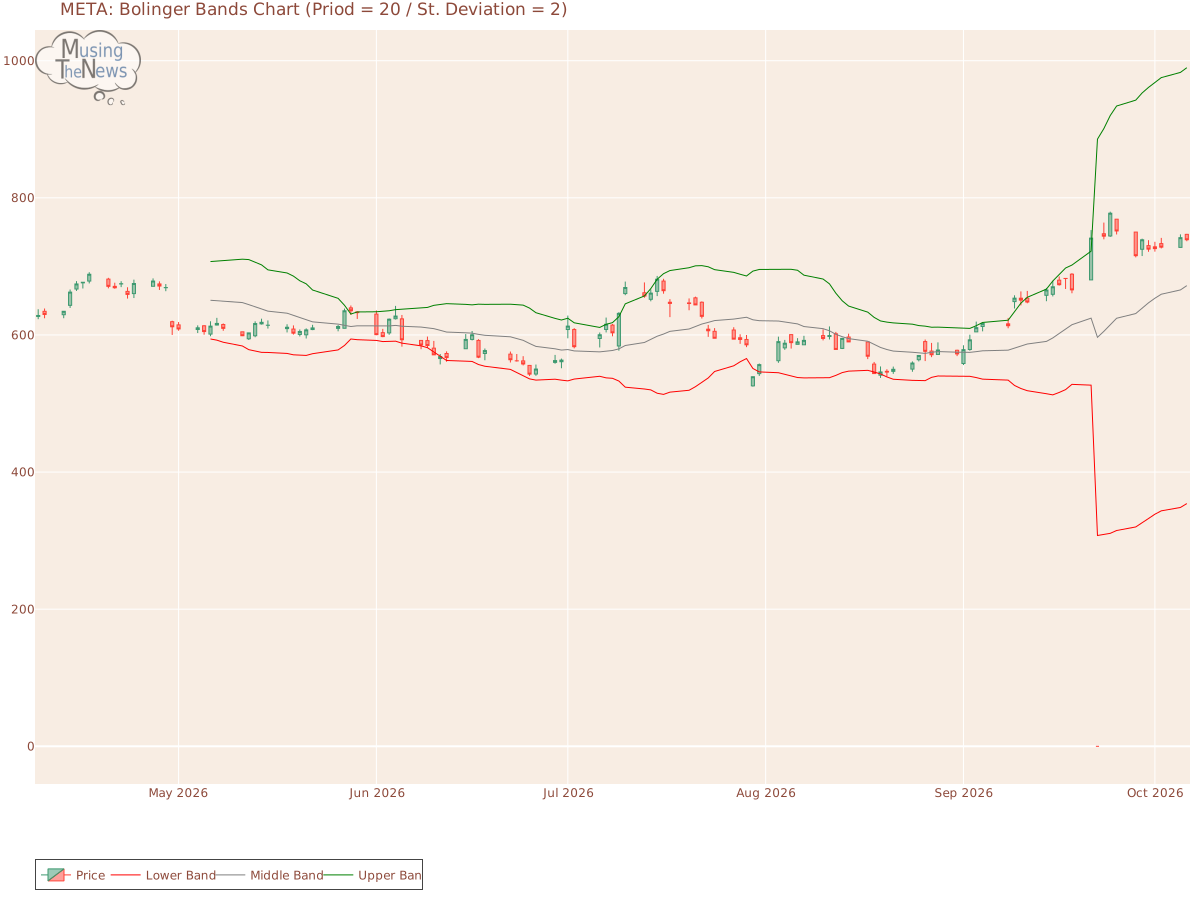
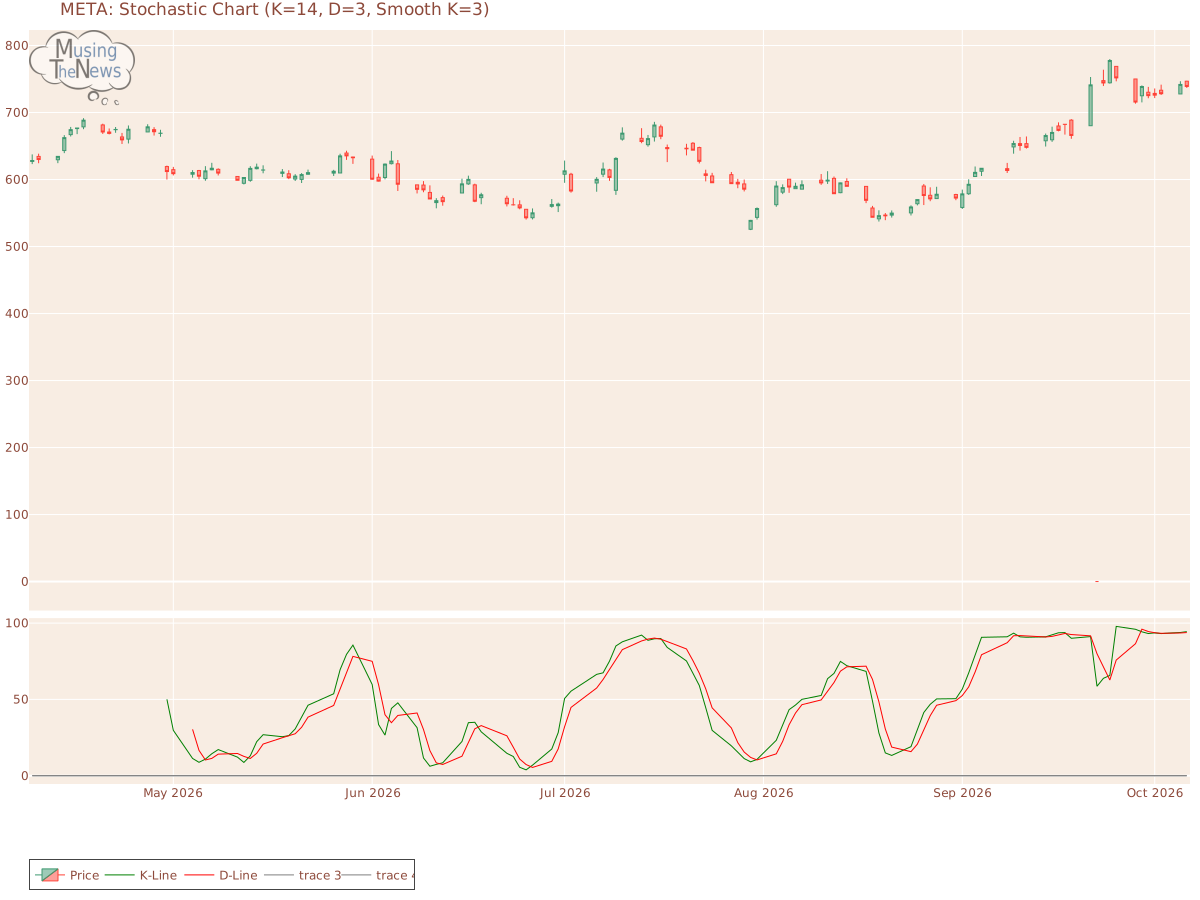
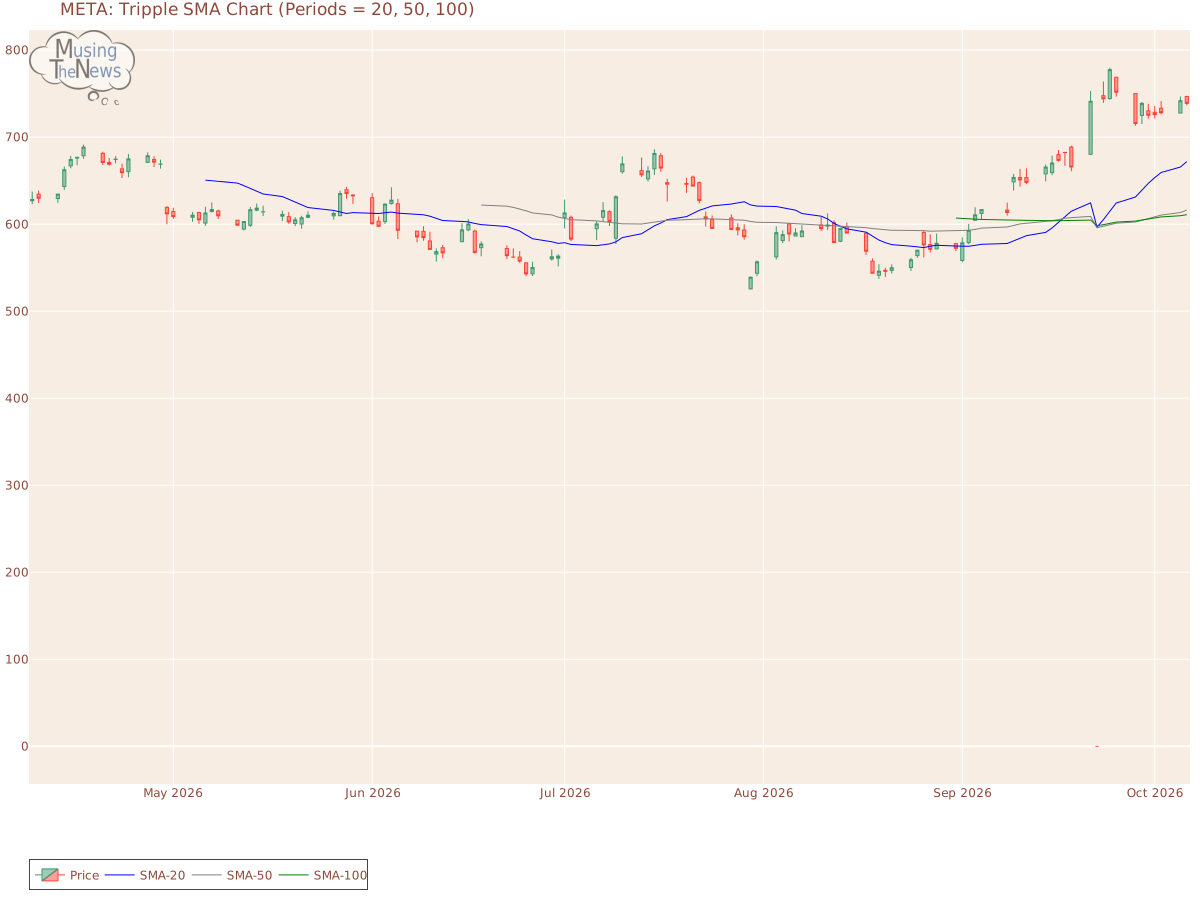
Support and Resistance: At 738.88, the price is supported at 678.62 and faces resistance at 777.59. This range suggests that the price for META might stay between these levels, with 678.62 acting as a floor and 777.59 as a ceiling.Support/Resistance for METAAroon: The current reading of the AROON indicator suggests a neutral stance, with no clear signals indicating an upward or downward direction. This lack of directional bias suggests the market may be in a period of consolidation or uncertainty.Aroon chart for Meta Platforms, Inc.Bol. Bands: The current state of the BOLL BANDS is neutral, providing no clear signals for either an upward or downward movement. This indicates that the market may be in a state of equilibrium, with no strong momentum in either direction.Bolinger Bands chart for Meta Platforms, Inc.Parabolic SAR: The PSAR remains bullish in its outlook, setting a key support level that could sustain the ongoing upward trend. This strong support indicates that the market may continue to rise, with the bullish momentum likely to persist for META.Parabolic Stop and Reverse chart for Meta Platforms, Inc.Stochastic: The stochastic indicator for META reflects a bullish outlook, with the K-line positioned above the D-line and surpassing the 80 mark. This setup suggests strong upward momentum, implying that the market may continue to rise. Investors may interpret this as a positive signal for further gains.Stochastic chart for Meta Platforms, Inc.Tripple Moving Agerage: The alignment of the 20, 50, and 100 moving averages points to a bearish trend, but the slopes of the 20 and 50 SMAs are starting to waver. This weakening of the bearish momentum could indicate that the market is approaching a turning point, with the possibility of a bullish reversal on the horizon. Investors should be alert for signs of a trend change as the current downtrend may be losing steam.Tripple SMA chart for Meta Platforms, Inc. A thorough analysis of a company involves looking beyond its stock price movements and trading patterns. You must also examine its fundamentals, which include profitability, growth prospects, and competitive advantages. Additionally, the industry in which the company operates provides important context, as factors like technological innovations, regulation, and market demand influence performance. By integrating this information with technical analysis, more accurate predictions about the company's future can be made.