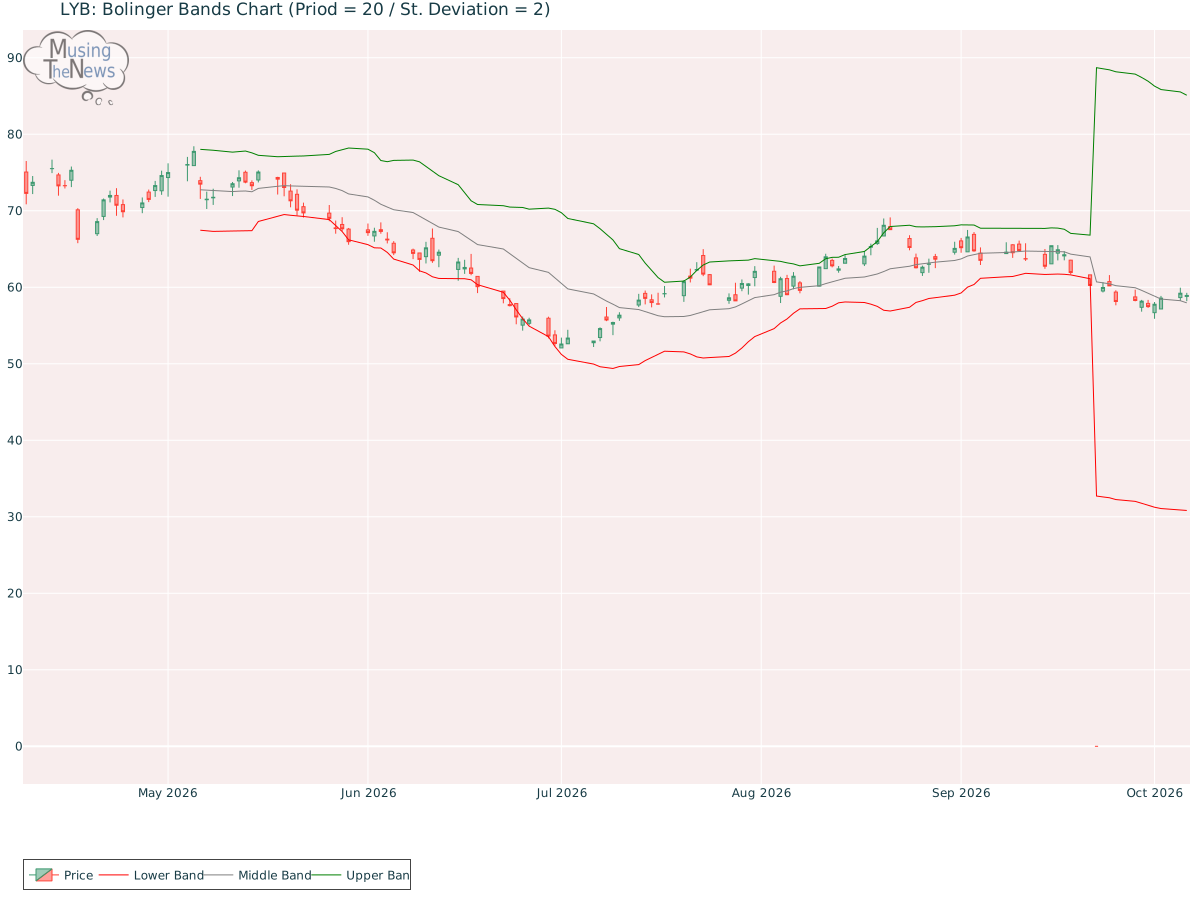
The BOLL BANDS is in a neutral stance, not pointing to a clear trend in either direction. This suggests that the market may be lacking strong momentum, making it difficult ...
By MusingTheNews
Updated 2026-10-07 23:26:34
Overall Technical outlook
Price Summary
LyondellBasell Industries N.V.'s stock opened at 58.8 on 2026-10-06, surged to 59.27, dropped to 58.18, and ended 0.22% higher at 58.93, with 2999800 shares traded. The stock reached its highest price of 82.38 and lowest price of 0.0 over the last 52 weeks.
Technicals
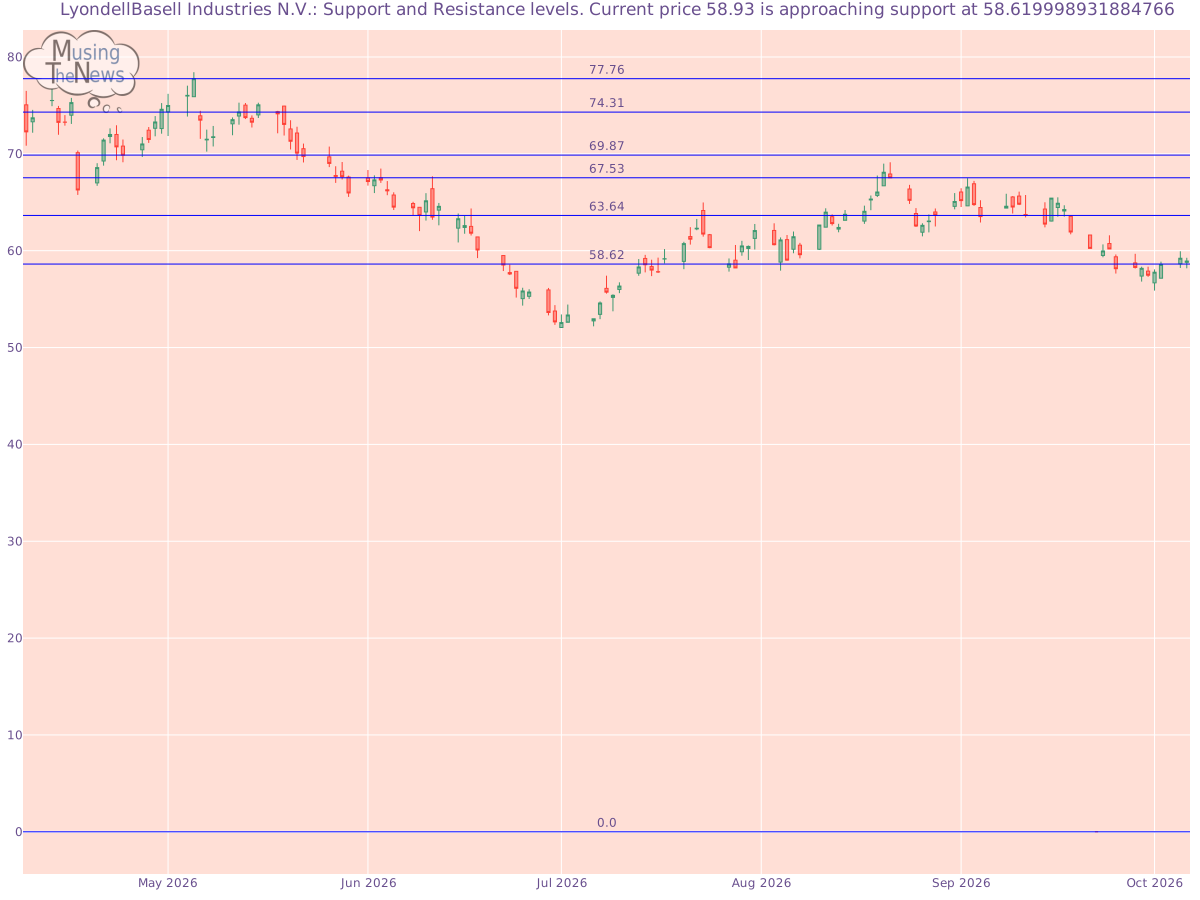
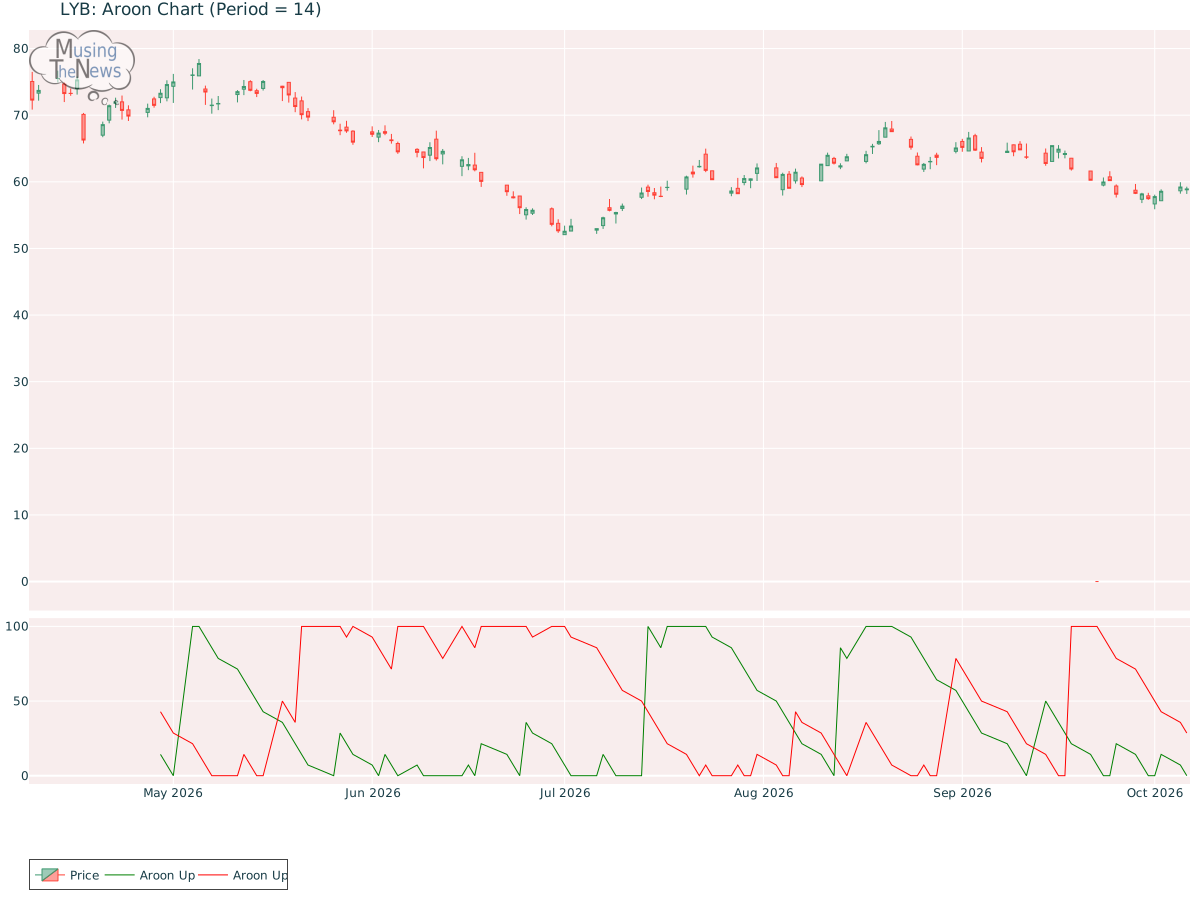
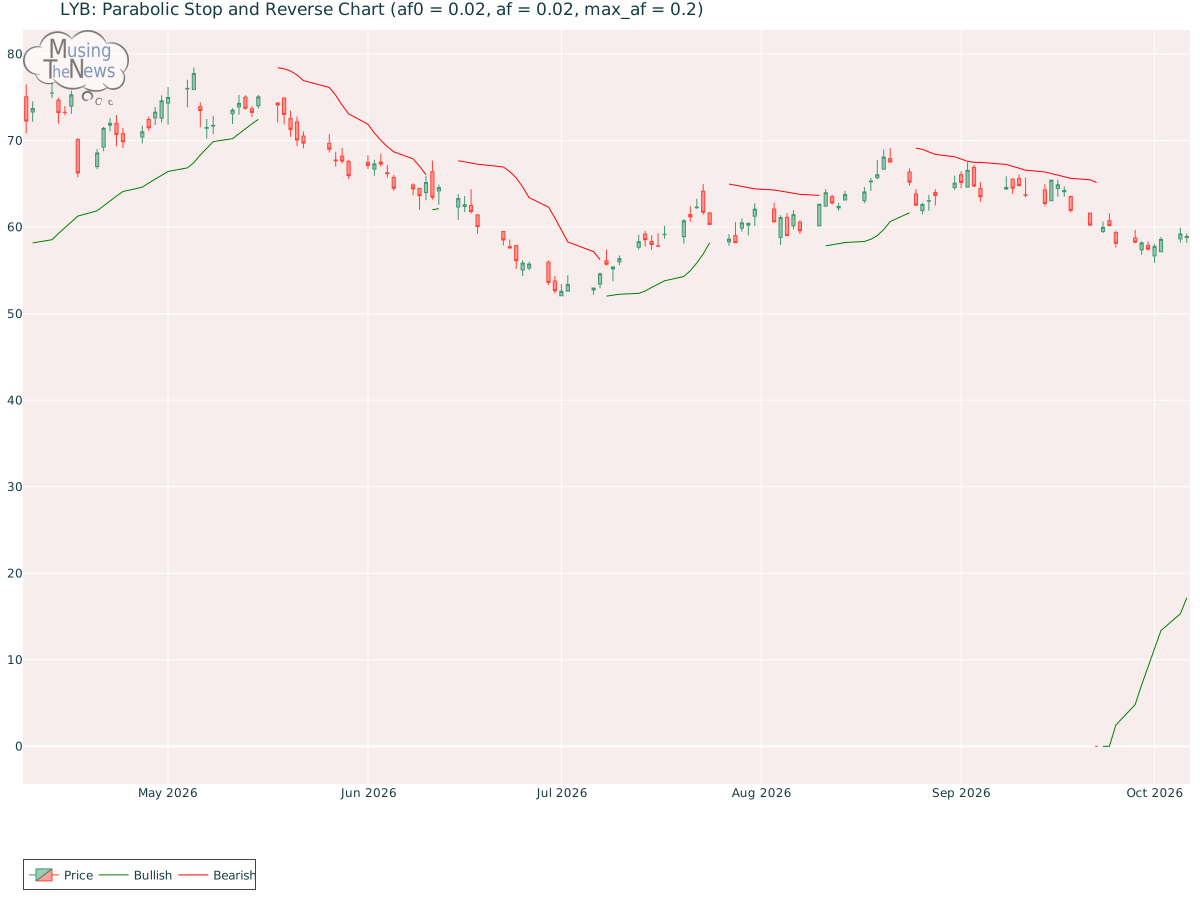
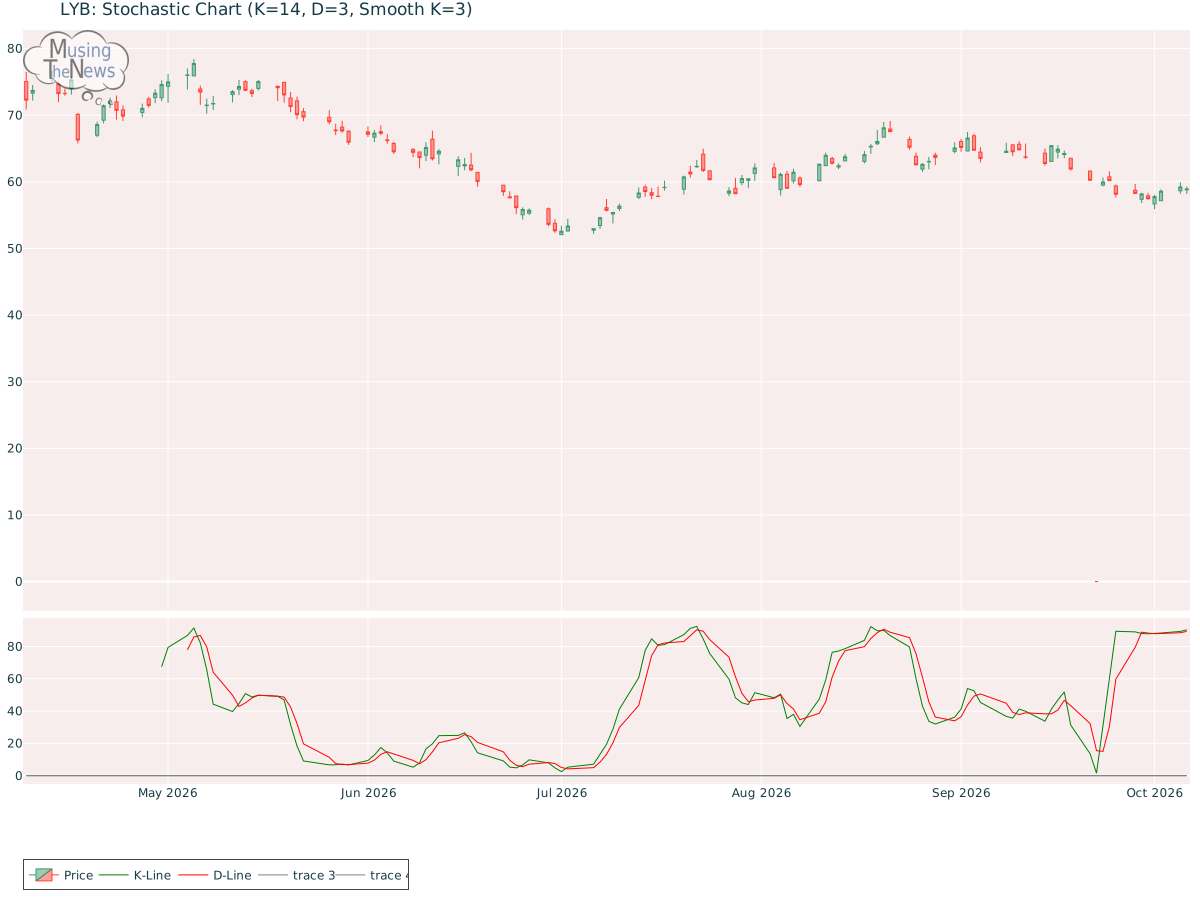
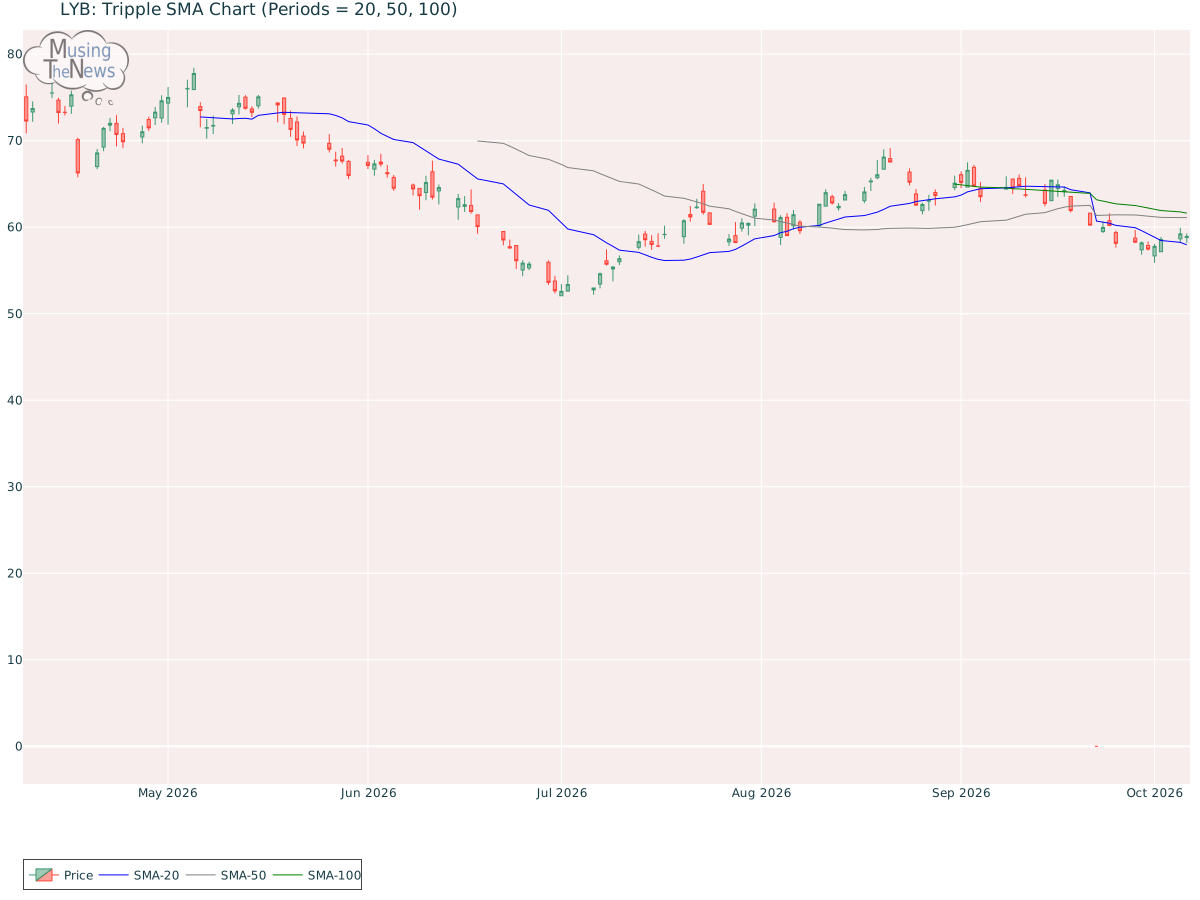
Support and Resistance: The current price for LYB is 58.93, supported at 58.62 with resistance at 63.64. This indicates a trading range where 58.62 might prevent further declines, while 63.64 could hinder additional gains.Support/Resistance for LYBAroon: The AROON is showing a neutral stance, not indicating a clear upward or downward trend for LyondellBasell Industries N.V.. This suggests a period of market balance, where neither side is showing dominance.Aroon chart for LyondellBasell Industries N.V.Bol. Bands: The BOLL BANDS is in a neutral stance, not pointing to a clear trend in either direction. This suggests that the market may be lacking strong momentum, making it difficult to predict the next move.Bolinger Bands chart for LyondellBasell Industries N.V.Parabolic SAR: The PSAR continues to be bullish for LYB, setting a strong support level that could sustain the ongoing upward trend. This level of support indicates that the market is likely to continue its positive trajectory, offering a base for continued bullish movement.Parabolic Stop and Reverse chart for LyondellBasell Industries N.V.Stochastic: The stochastic indicator reflects bullish conditions, with the K-line above both the D-line and the 80 mark. This setup suggests that the market has strong upward momentum, likely leading to further gains. Traders may consider this a signal of continued strength in the market.Stochastic chart for LyondellBasell Industries N.V.Tripple Moving Agerage: The alignment of the 20-50-100 period moving averages suggests a bullish trend, but the slopes of the faster averages raise the possibility of a reversal for LYB. The weakening momentum in these shorter-term averages hints that the upward trend might be losing strength, suggesting that caution may be warranted.Tripple SMA chart for LyondellBasell Industries N.V. In order to draw meaningful inferences from a company's technical data, it is essential to first consider its fundamentals. This includes reviewing financial metrics like revenue, profit margins, and debt-to-equity ratios. Additionally, understanding the broader industry landscape, including market trends and competitive pressures, is crucial. By integrating these insights with the company's technical performance, such as stock price fluctuations and trading volume, one can make more informed investment decisions.