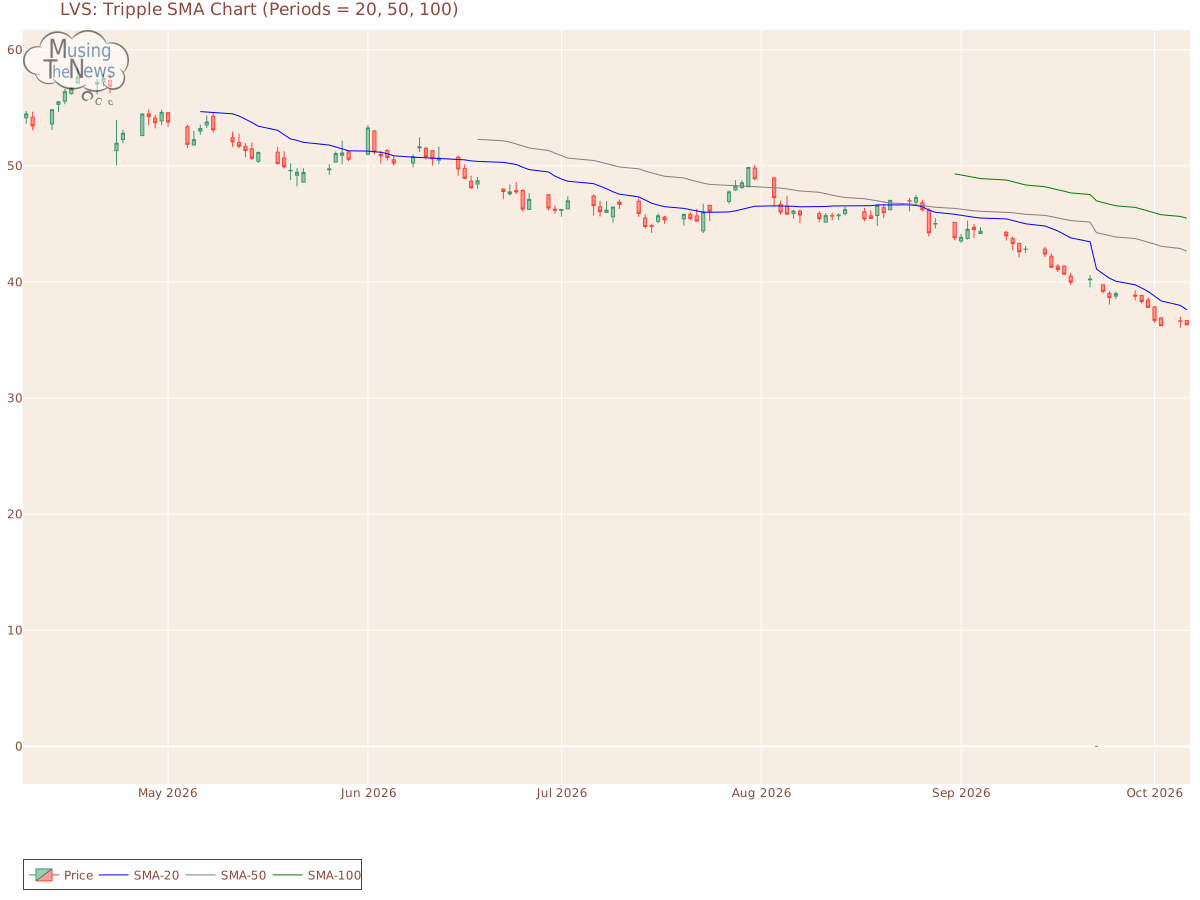
A bullish trend for Las Vegas Sands Corp. is reflected in the alignment of the 20-50-100 period moving averages, though the slopes of the faster averages raise concerns abo...
By MusingTheNews
Updated 2026-10-07 23:26:32
Overall Technical outlook
Price Summary
Las Vegas Sands Corp.'s stock opened at 36.67 on 2026-10-06, surged to a high of 36.7, hit a low of 36.28, and closed up -0.98% at 36.31, with 4977000 shares traded. The stock's peak price over the last 52 weeks is 69.49, with the lowest being 0.0.
Technicals
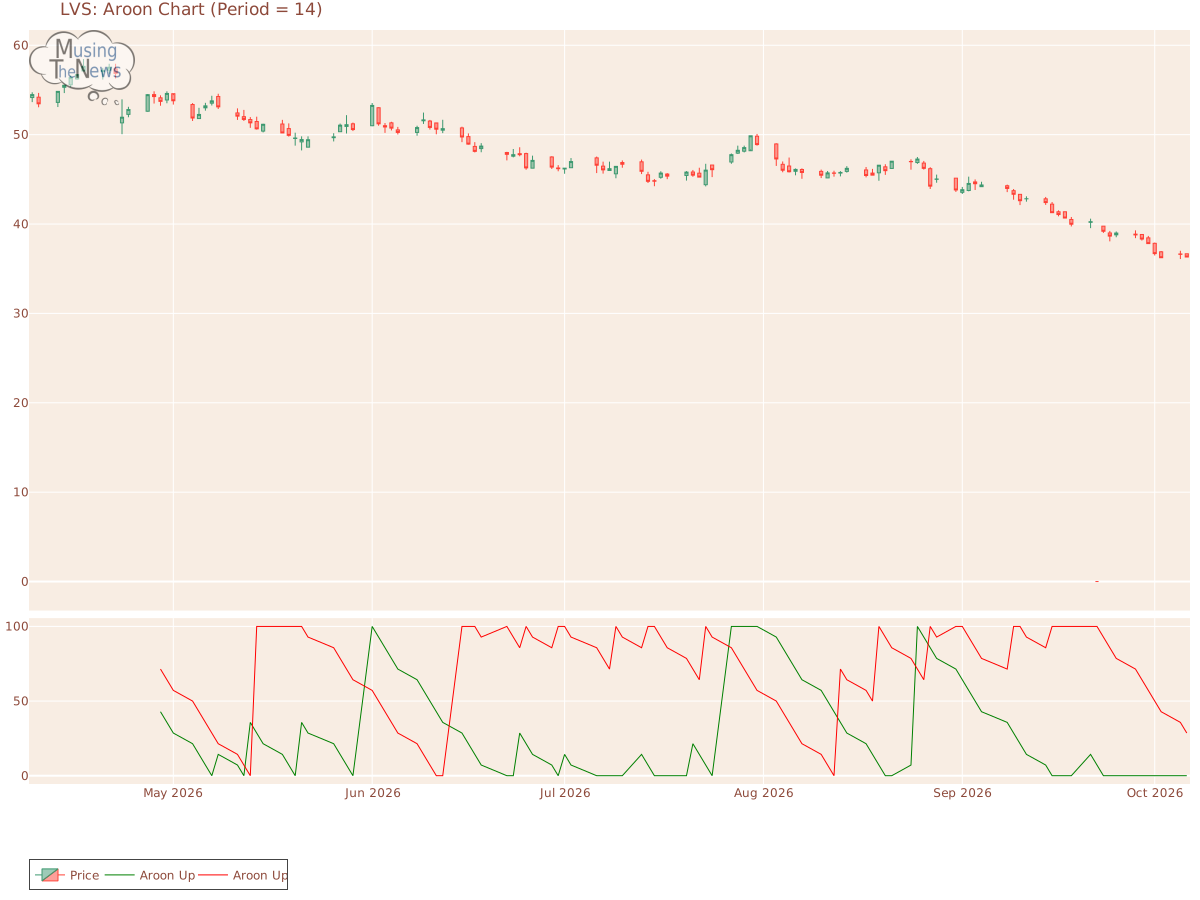
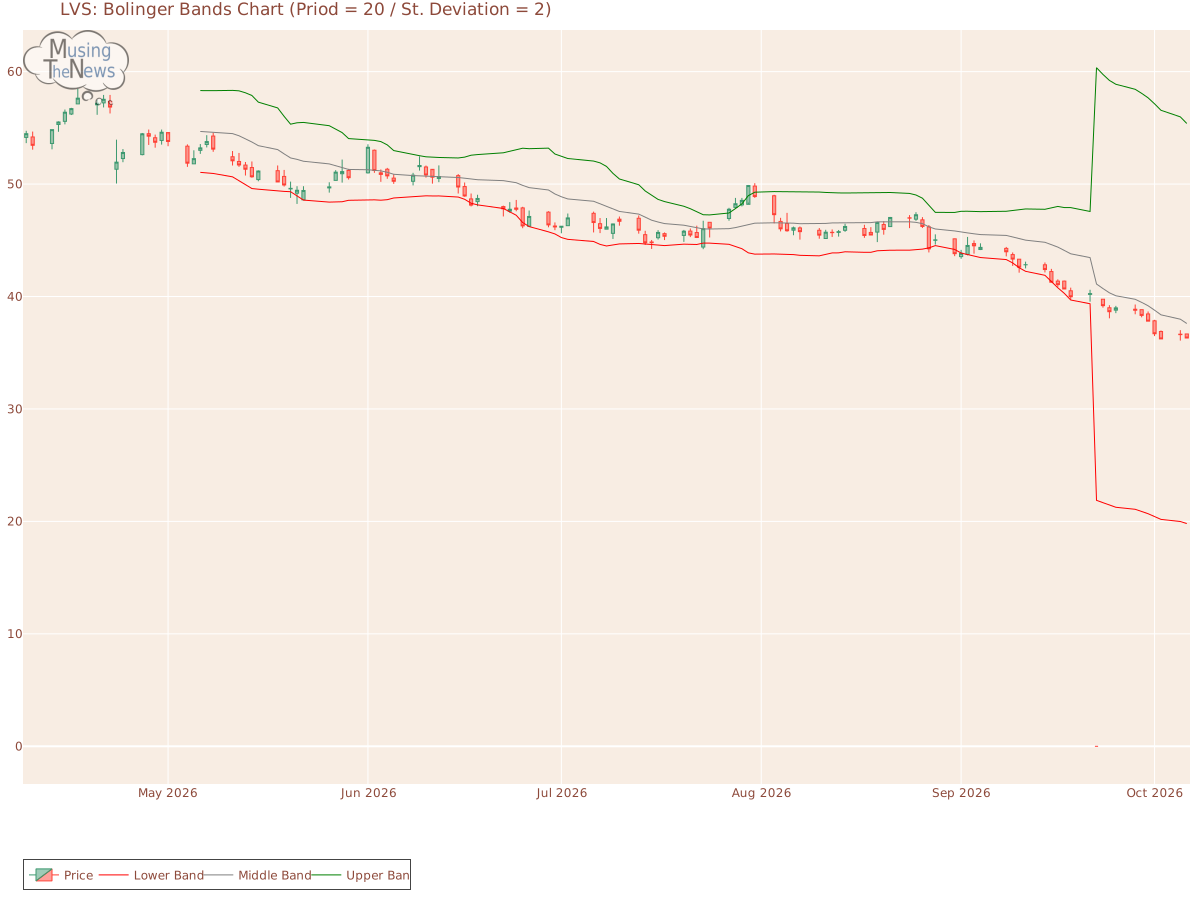
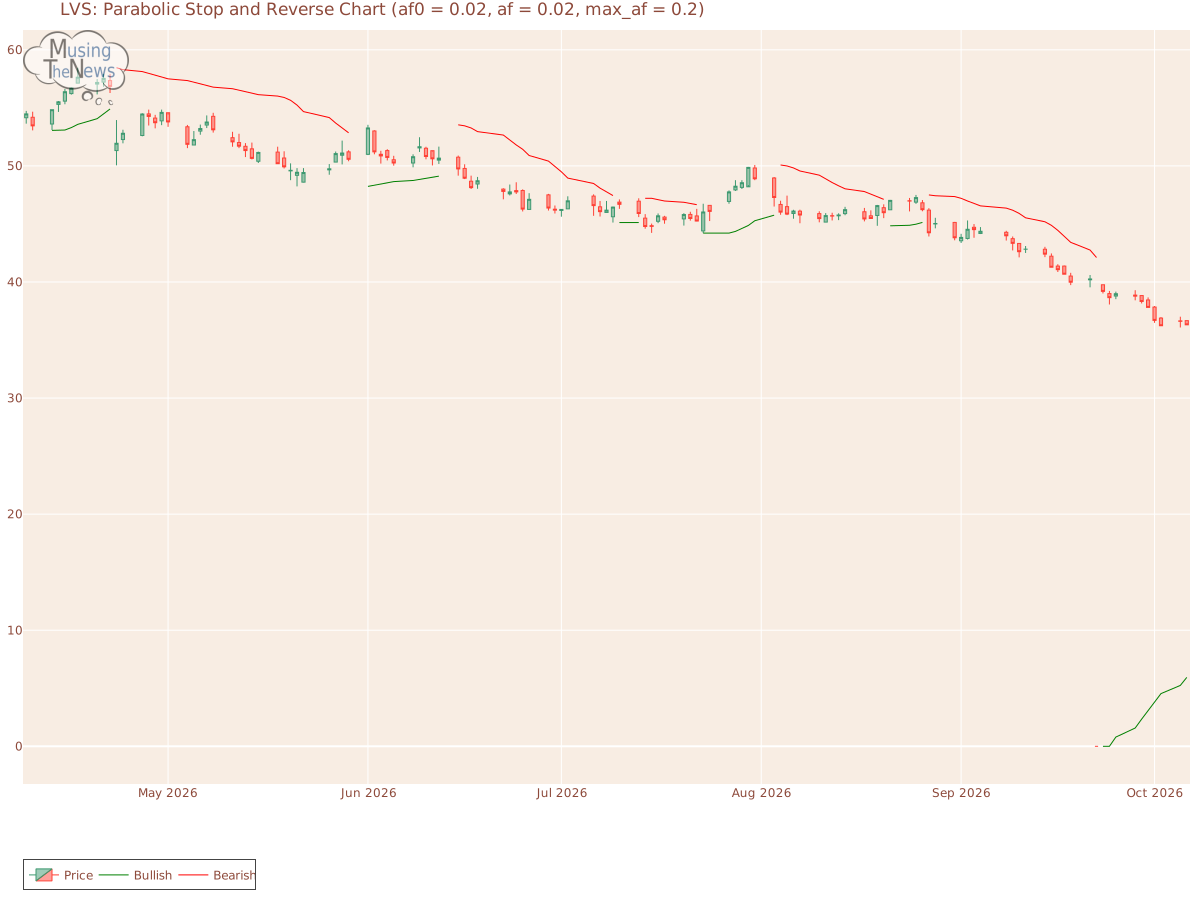
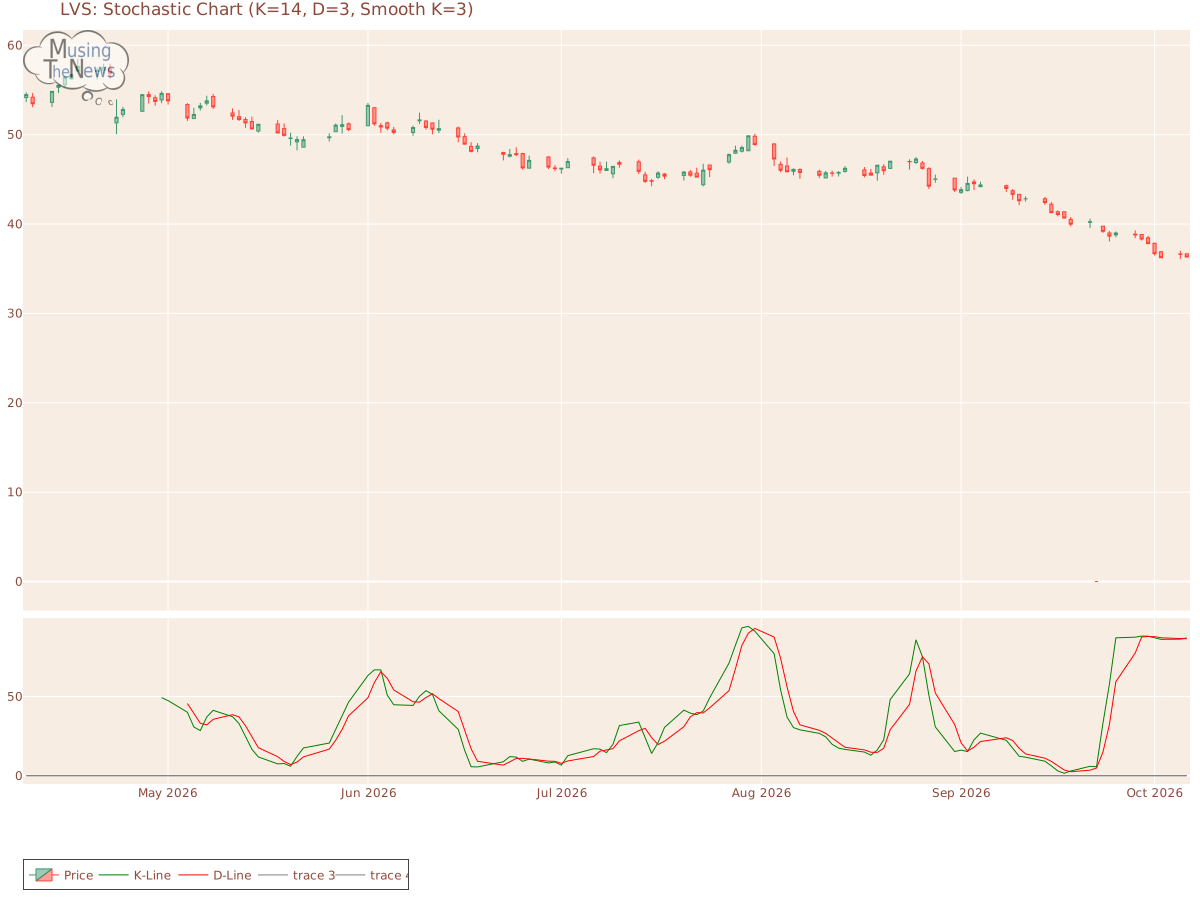
Aroon: The AROON is showing a neutral reading, with no clear direction indicated for upward or downward movement. This neutral position suggests a possible period of consolidation.Aroon chart for Las Vegas Sands Corp.Bol. Bands: The BOLL BANDS is showing a neutral stance, with no definitive indication of an upward or downward trend for LVS. This neutral position suggests a period of indecision in the market, making it difficult to predict the next move.Bolinger Bands chart for Las Vegas Sands Corp.Parabolic SAR: The PSAR maintains a bullish outlook, reinforcing a support level that could help uphold the market's upward trend. This suggests that the market is likely to continue climbing, with the support providing a solid base for further gains.Parabolic Stop and Reverse chart for Las Vegas Sands Corp.Stochastic: The stochastic indicator is in a bullish phase, as the K-line is above the D-line and the 80 mark. This setup suggests strong upward momentum, implying that LVS may continue to experience gains. Investors may consider this a positive signal for continued market growth.Stochastic chart for Las Vegas Sands Corp.Tripple Moving Agerage: A bullish trend for Las Vegas Sands Corp. is reflected in the alignment of the 20-50-100 period moving averages, though the slopes of the faster averages raise concerns about a potential reversal. The weakening momentum in the shorter-term averages suggests that the current trend may not last, signaling the possibility of a shift in direction.Tripple SMA chart for Las Vegas Sands Corp. Before diving into the technical aspects of a company, such as stock price charts or volume trends, it's important to understand its fundamentals. These fundamentals include financial stability, growth potential, and strategic positioning. Additionally, knowing the broader industry landscape, including competitive pressures and regulatory factors, offers deeper insights. When this fundamental analysis is combined with technical indicators, it leads to more informed, accurate evaluations of the company's overall performance.