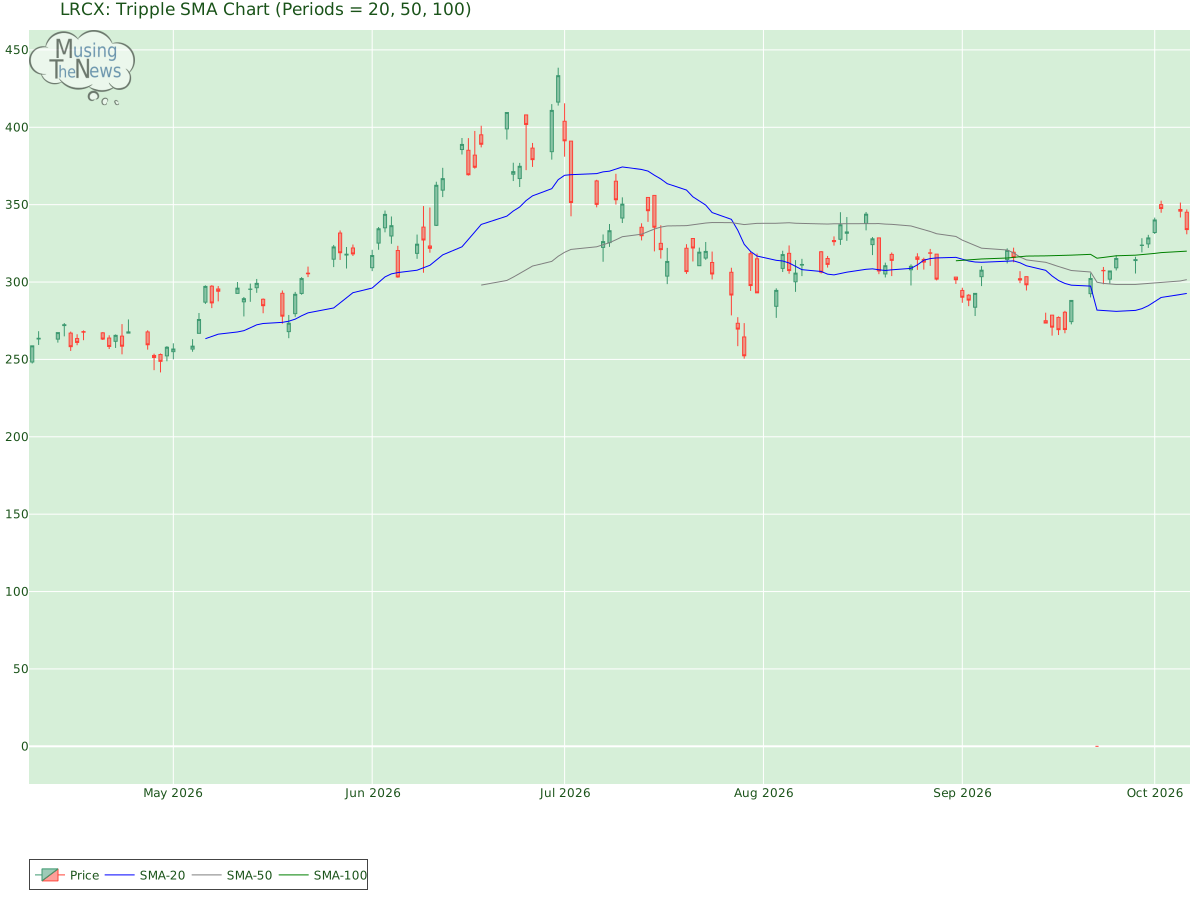
The moving averages are positioned to support a bullish trend, reinforced by the upward sloping 20-50-100 aggregates. This alignment suggests that the market is gaining str...
By MusingTheNews
Updated 2026-10-07 23:26:31
Overall Technical outlook
Price Summary
In today's trading, Lam Research Corporation's stock dived by -3.25%, showcasing an mediocre market day. On 2026-10-06, Lam Research Corporation's stock opened at 345.1, reached 346.9, hit a low of 330.85, and rose -3.25% to close at 333.89, with 7659800 shares traded. Throughout the 52-week period, the stock hit a high of 433.33 and a low of 0.0.
Technicals
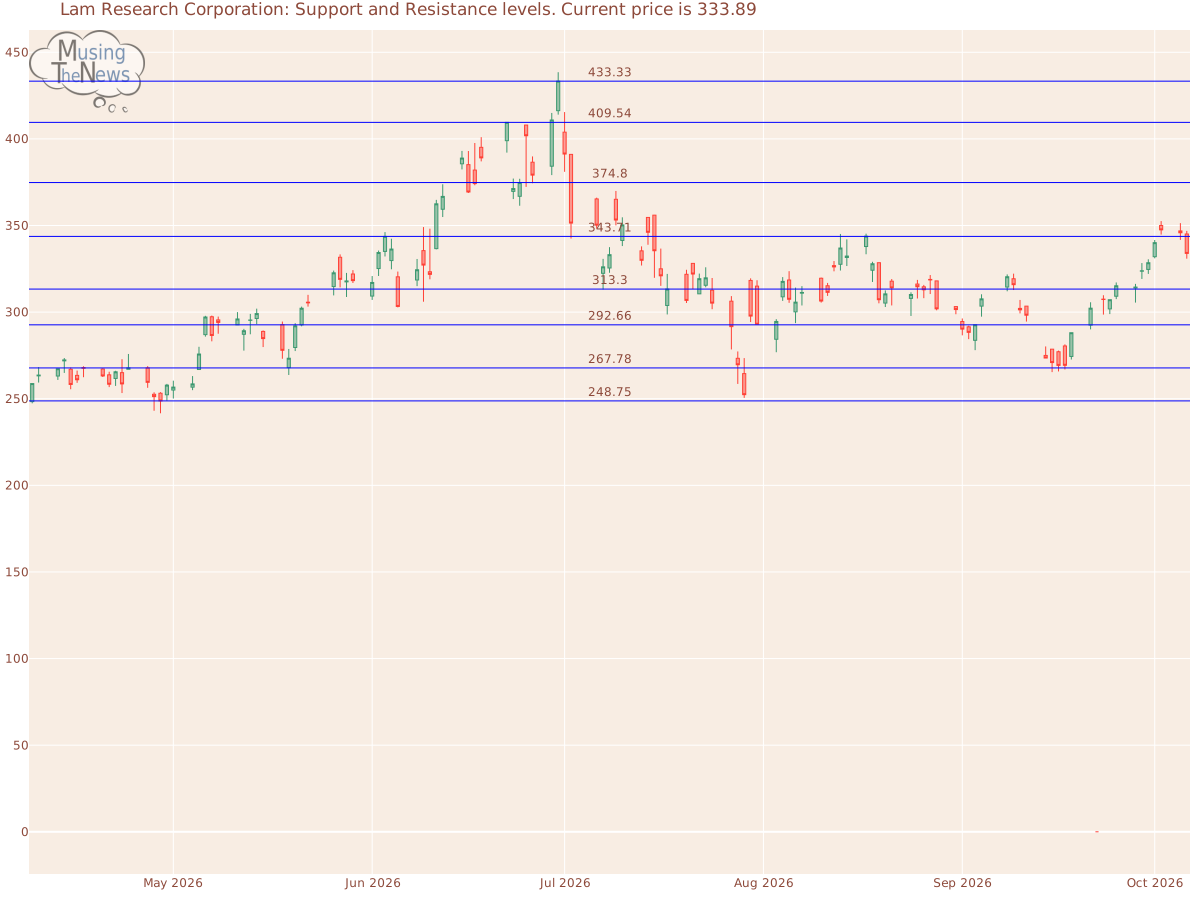
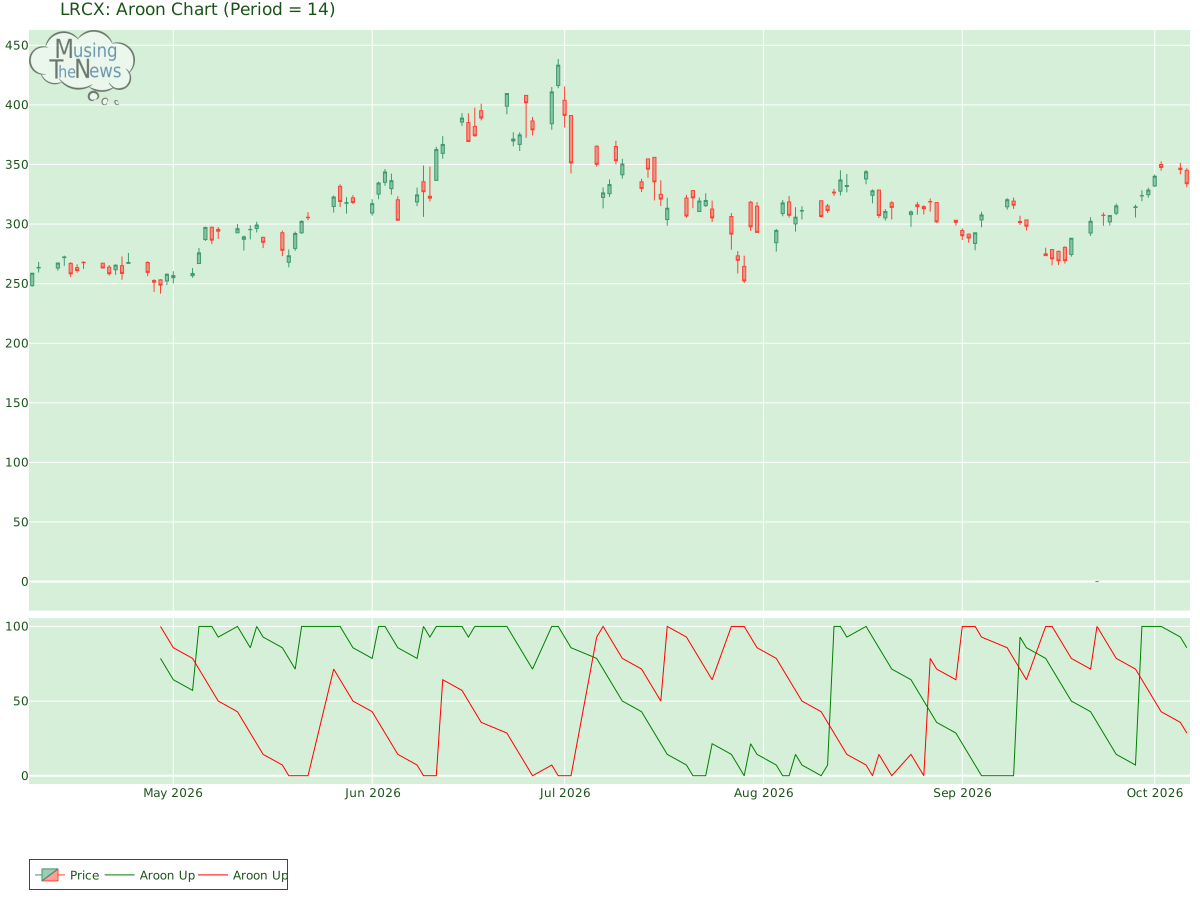
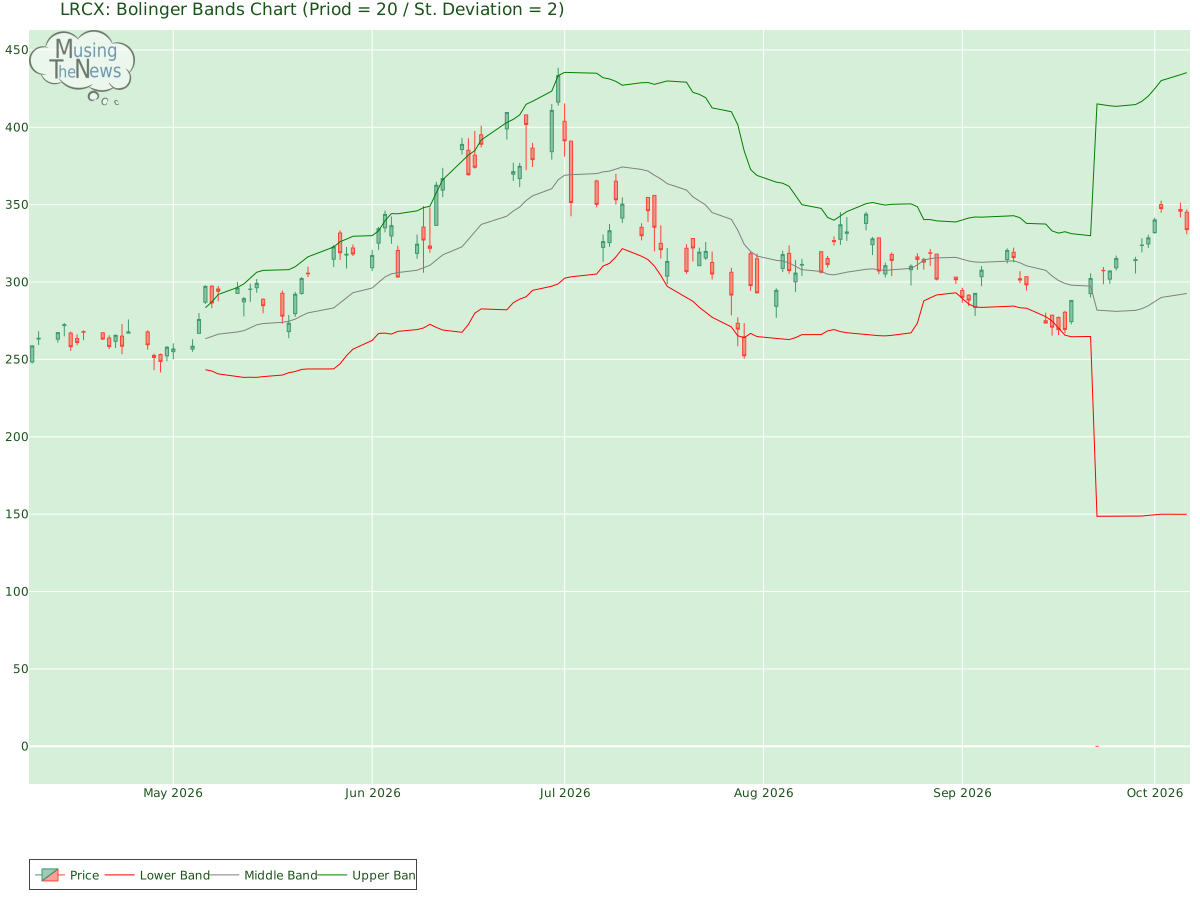
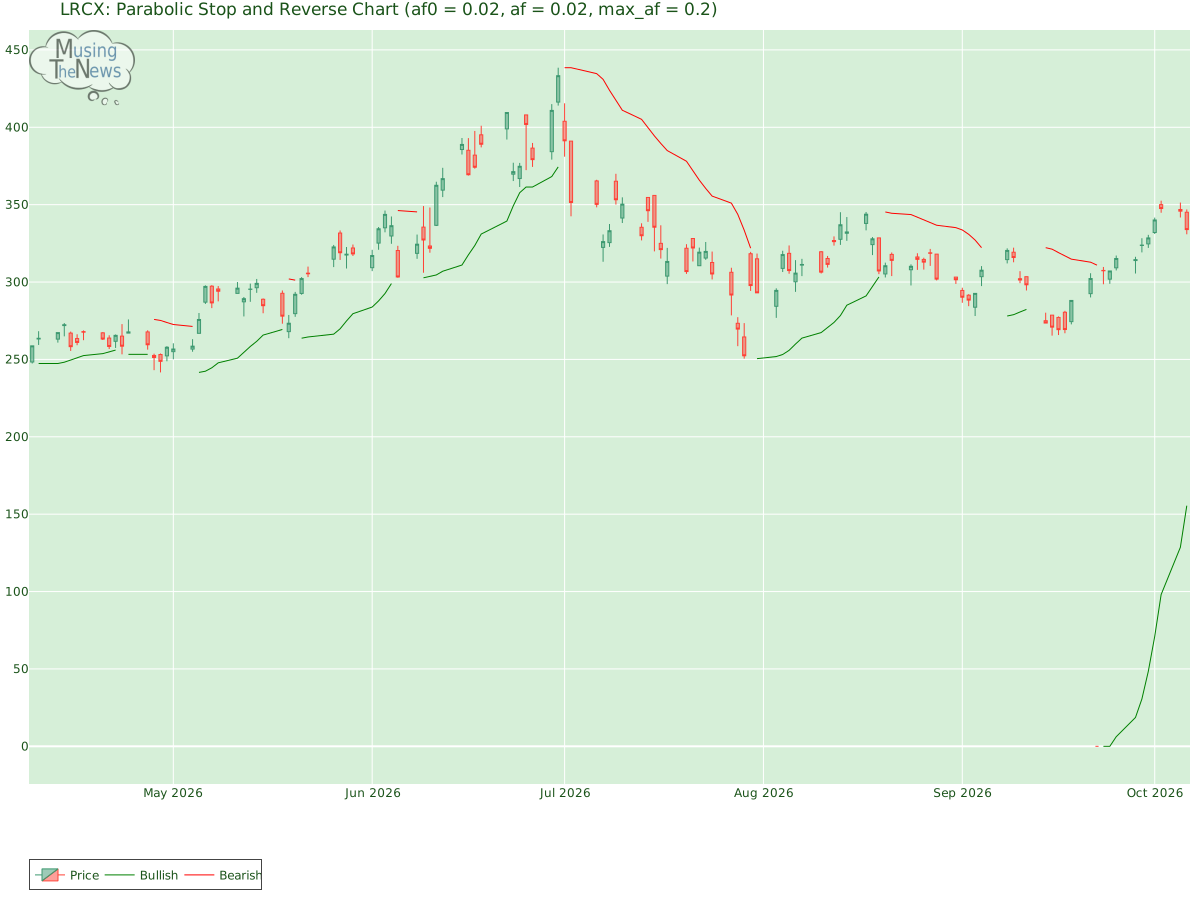
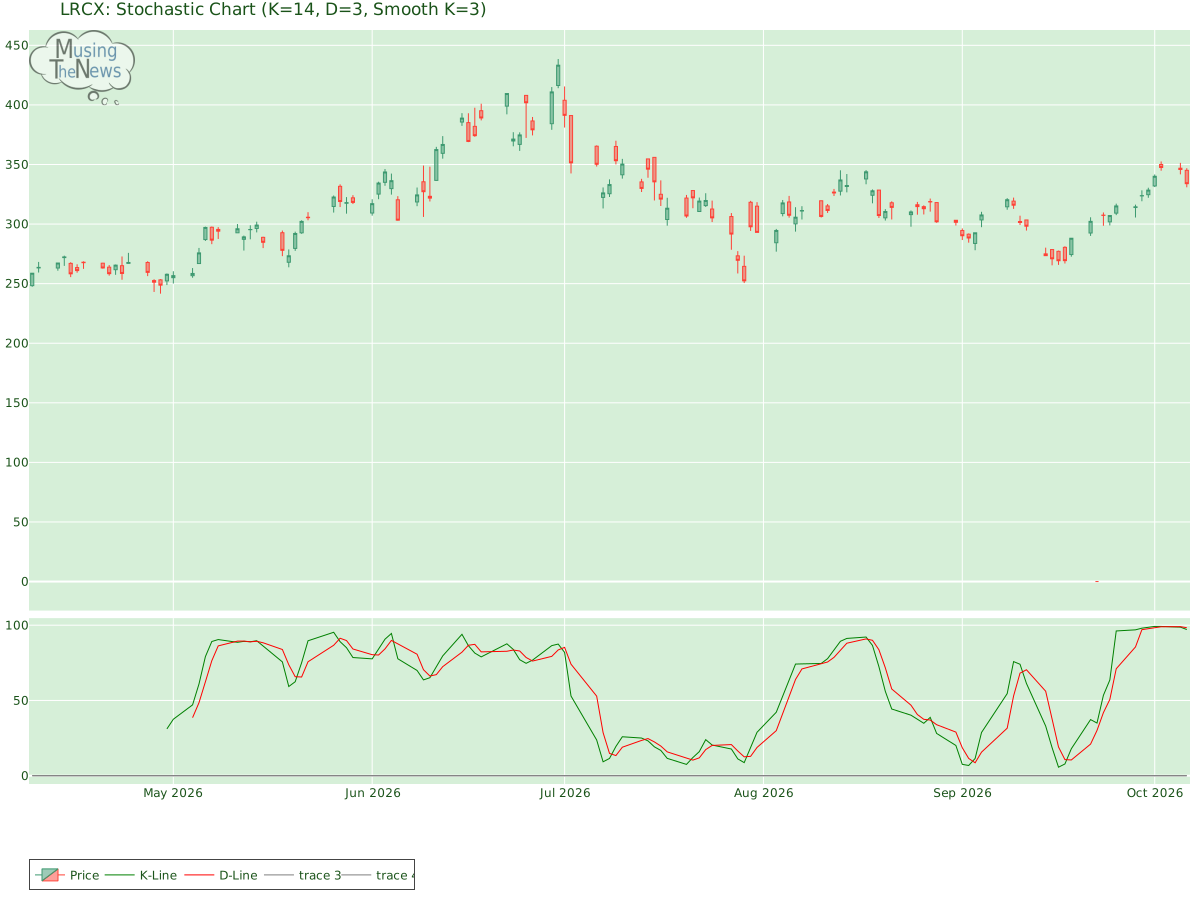
Support and Resistance: The price of 333.89 is supported at 313.3 and faces resistance at 343.71. This range suggests key levels for LRCX where the price may stabilize, with 313.3 acting as a support and 343.71 as a cap on gains.Support/Resistance for LRCXAroon: The AROON is in a neutral stance, with no clear direction indicated for the market. This lack of clarity suggests that the market may be in a state of equilibrium for LRCX, with no strong trend emerging.Aroon chart for Lam Research CorporationBol. Bands: The BOLL BANDS is in a neutral stance, with no clear direction indicated for the market. This lack of clarity suggests that the market may be in a state of equilibrium for LRCX, with no strong trend emerging.Bolinger Bands chart for Lam Research CorporationParabolic SAR: The PSAR continues to be bullish for LRCX, setting a strong support level that could sustain the ongoing upward trend. This level of support indicates that the market is likely to continue its positive trajectory, offering a base for continued bullish movement.Parabolic Stop and Reverse chart for Lam Research CorporationStochastic: The K-line has moved below the D-line on the stochastic indicator, yet it remains above 80, signaling the potential beginning of a bearish price move for LRCX. This pattern may indicate that the market's upward momentum is starting to wane, possibly leading to a downturn. Investors should watch for further confirmation.Stochastic chart for Lam Research CorporationTripple Moving Agerage: The moving averages are positioned to support a bullish trend, reinforced by the upward sloping 20-50-100 aggregates. This alignment suggests that the market is gaining strength, potentially leading to ongoing gains. Traders might interpret this as a signal to enter or maintain their positions in anticipation of continued upward movement.Tripple SMA chart for Lam Research Corporation When evaluating a company's technical data, such as stock price charts or volume, it is essential to first consider its fundamentals. These fundamentals include financial stability, growth potential, and competitive advantages. Additionally, understanding the broader industry in which the company operates offers context that helps to make sense of technical patterns. By examining both the company's internal strengths and external environment, one can make more accurate and meaningful conclusions about its stock performance.