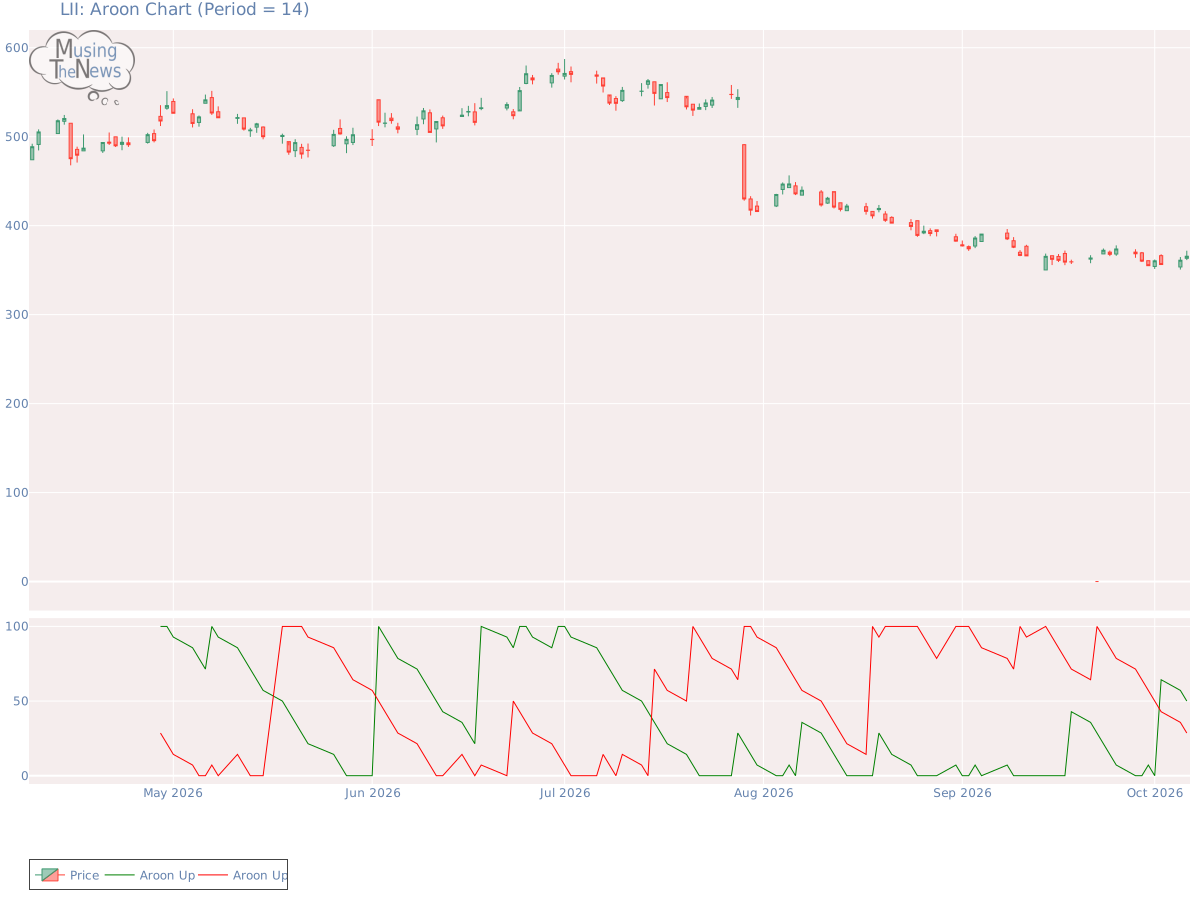
The AROON is showing a neutral stance, with no definitive indication of an upward or downward trend for LII. This neutral position suggests a period of indecision in the ma...
By MusingTheNews
Updated 2026-10-07 23:26:32
Overall Technical outlook
Price Summary
On 2026-10-06, Lennox International Inc.'s stock began at 363.29, peaked at 371.84, bottomed at 361.3, and closed 0.64% up at 365.63, with a volume of 435700 shares. The highest price the stock achieved in the past 52 weeks is 572.95, while the lowest price it saw is 0.0.
Technicals
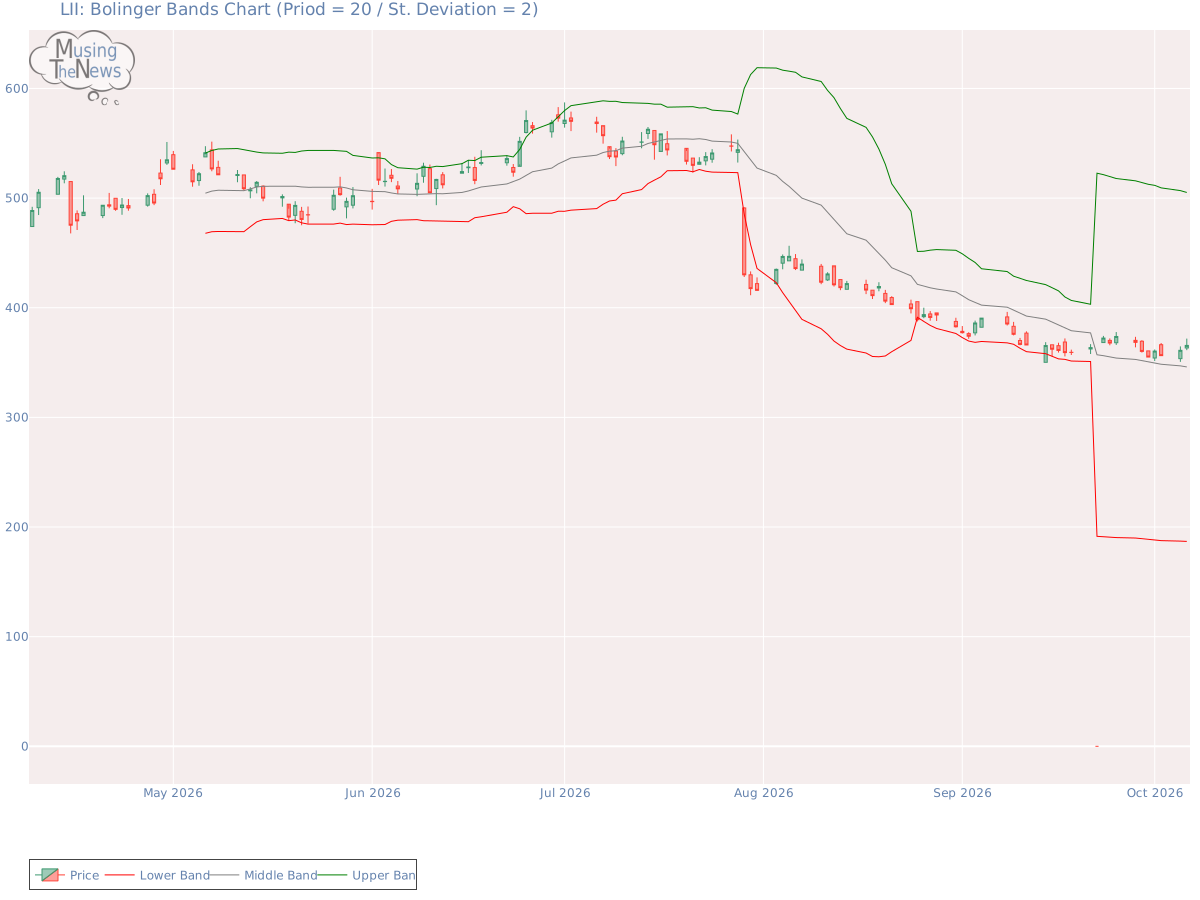
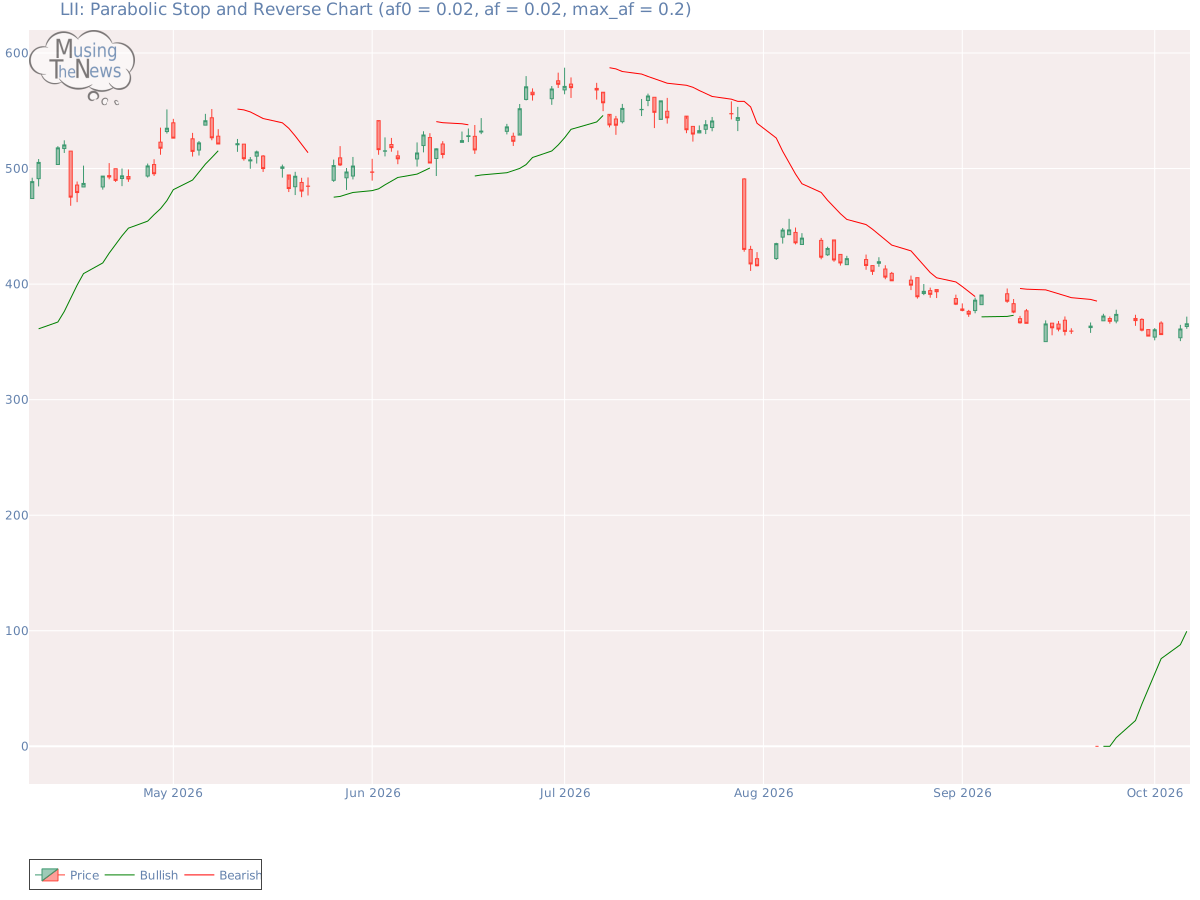
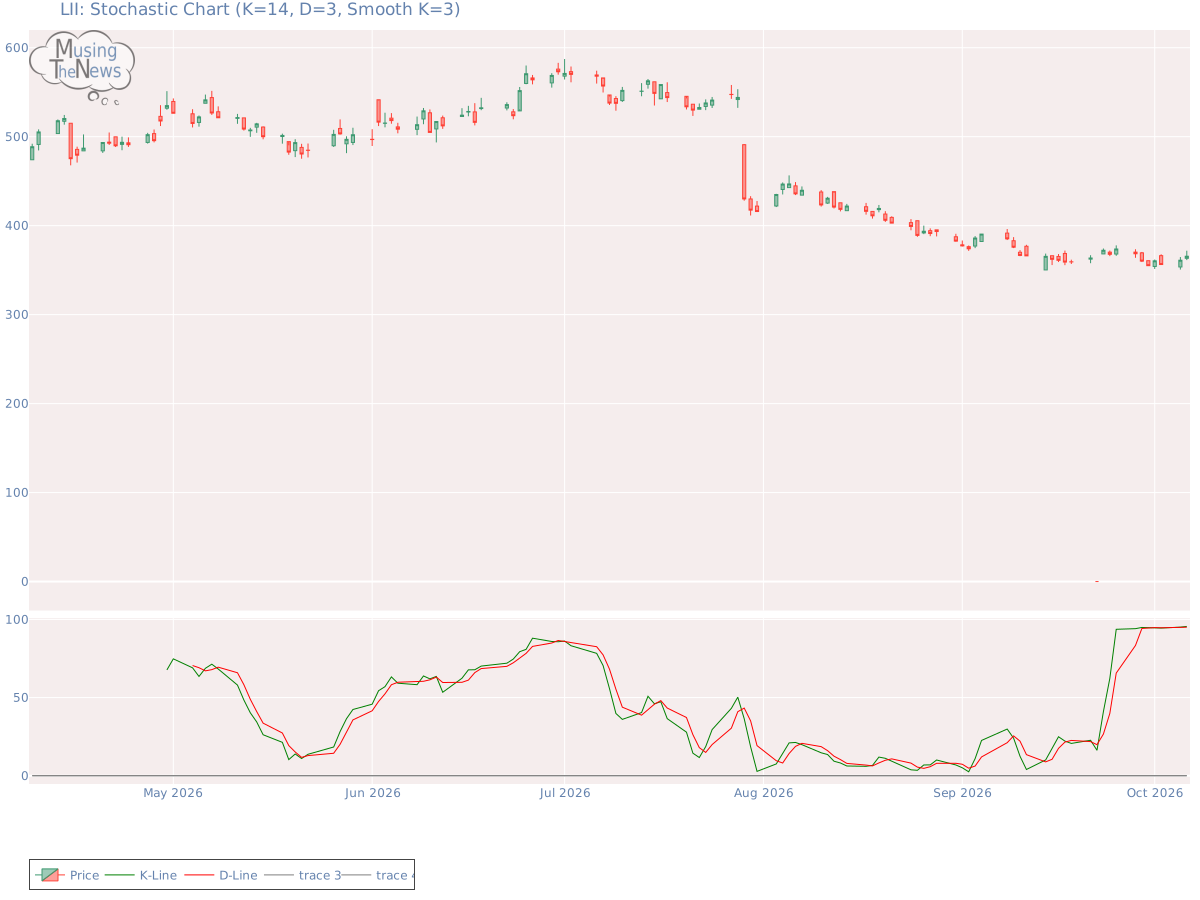
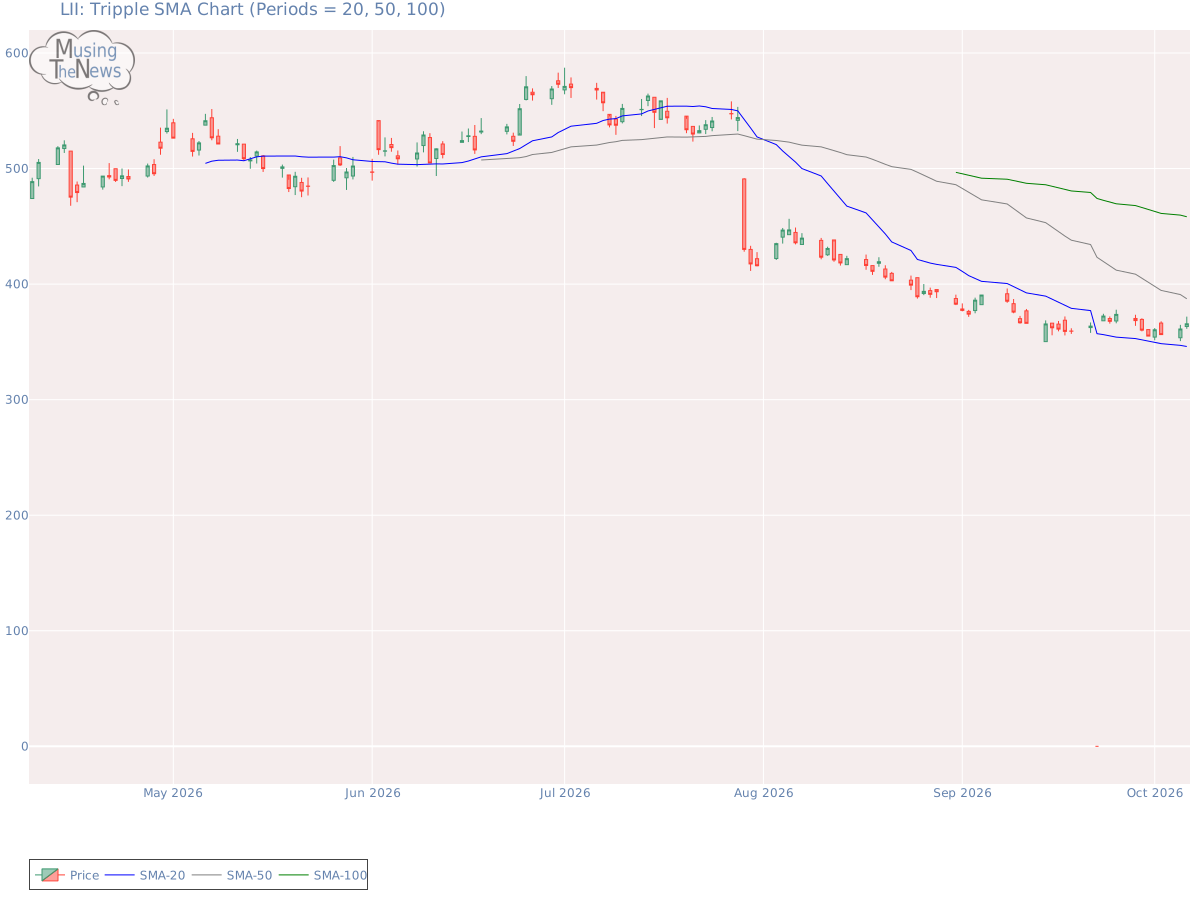
Aroon: The AROON is showing a neutral stance, with no definitive indication of an upward or downward trend for LII. This neutral position suggests a period of indecision in the market, making it difficult to predict the next move.Aroon chart for Lennox International Inc.Bol. Bands: The current reading of the BOLL BANDS is neutral for LII, with no clear signals for an upward or downward trend. This indicates that the market may be in a state of uncertainty, with no dominant force driving the direction.Bolinger Bands chart for Lennox International Inc.Parabolic SAR: The PSAR continues to indicate a bullish outlook, setting a crucial support level. This strong support could bolster the ongoing upward trend, suggesting that the market may remain in a positive trajectory. Investors may view this as a sign of sustained bullish momentum.Parabolic Stop and Reverse chart for Lennox International Inc.Stochastic: The stochastic indicator reflects bullish conditions, with the K-line above both the D-line and the 80 mark. This setup suggests that the market has strong upward momentum, likely leading to further gains. Traders may consider this a signal of continued strength in the market.Stochastic chart for Lennox International Inc.Tripple Moving Agerage: The 20-50-100 period moving averages suggest a bullish trend, but the slopes of the faster averages indicate that this strength may be weakening. The potential for a reversal is becoming apparent, as the shorter-term averages show signs of fading momentum, suggesting that a trend change could be imminent.Tripple SMA chart for Lennox International Inc. When assessing a company's technical performance, such as stock price fluctuations and trading volume, it is crucial to first examine its fundamentals. These fundamentals include financial health, profitability, and growth potential. Additionally, understanding the industry's dynamics, including competitive pressures and market trends, is key to contextualizing the company's performance. By integrating these factors, a more comprehensive and meaningful analysis can be conducted, leading to more informed investment decisions.