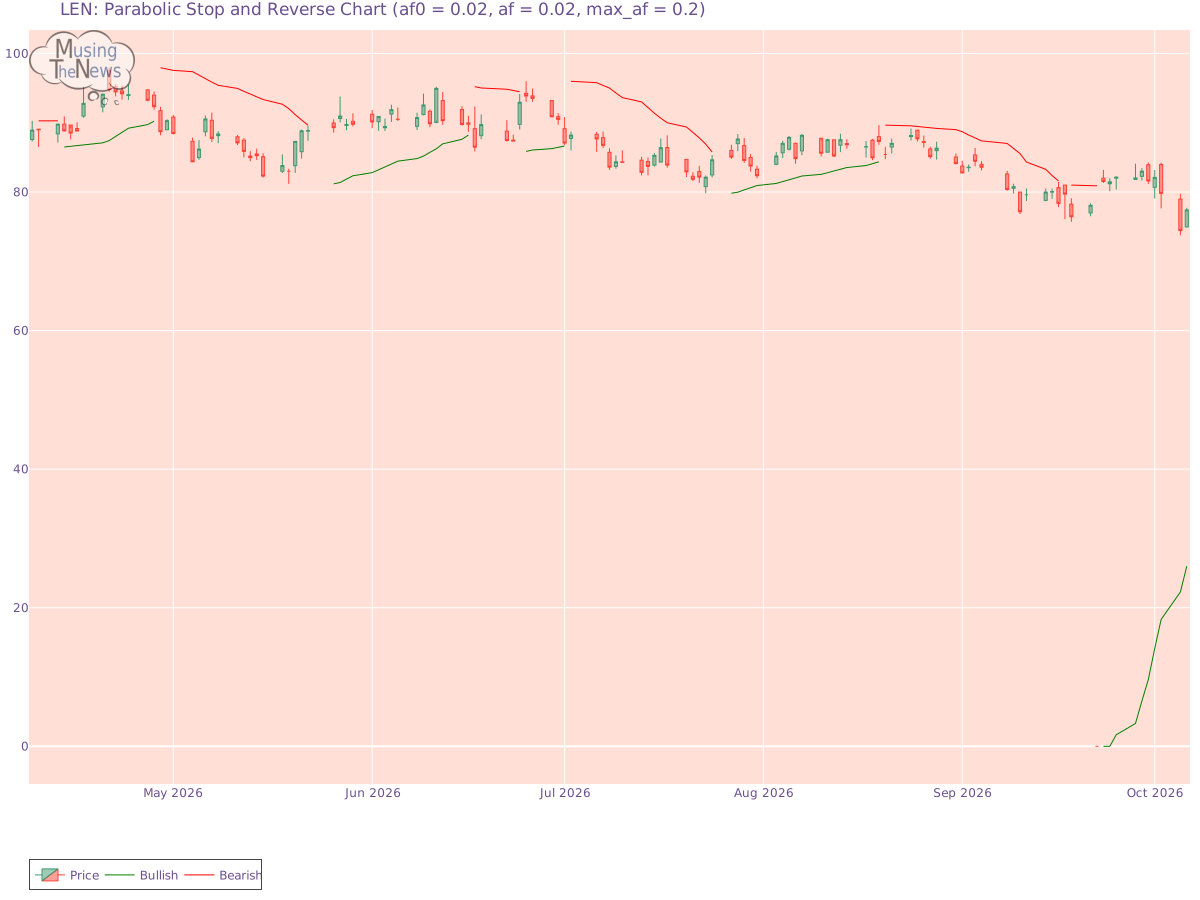
The PSAR maintains its bullish stance, setting a significant support level that could help maintain the market's upward movement. This strong support suggests that the mark...
By MusingTheNews
Updated 2026-10-07 23:26:32
Overall Technical outlook
Price Summary
Lennar Corporation's stock saw a 3.28% increase, showcasing an remarkable market day. On 2026-10-06, Lennar Corporation's stock opened at 74.95, spiked to 77.72, declined to 74.95, and closed 3.28% up at 77.41, with 6466400 shares traded. Over the course of 52 weeks, the stock peaked at 133.13 and hit a low of 0.0.
Technicals
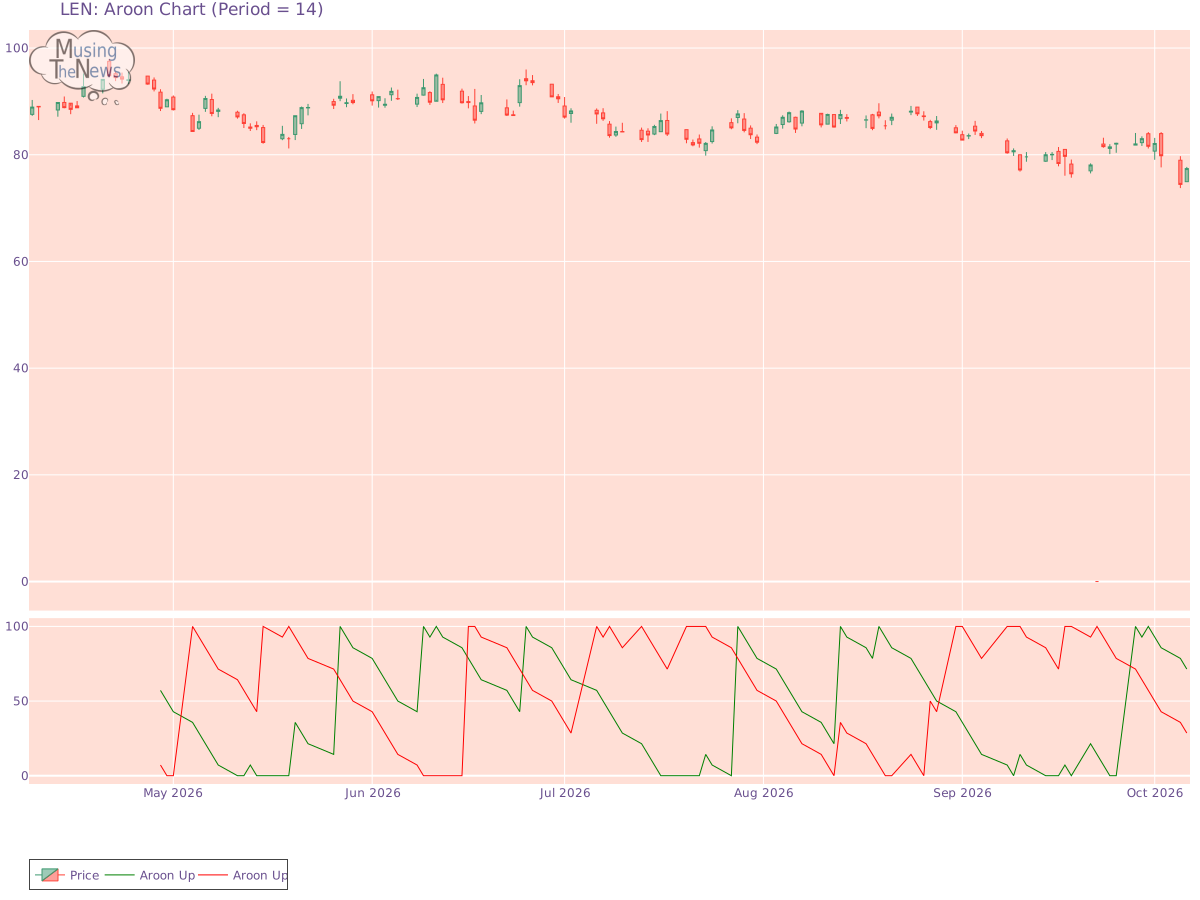
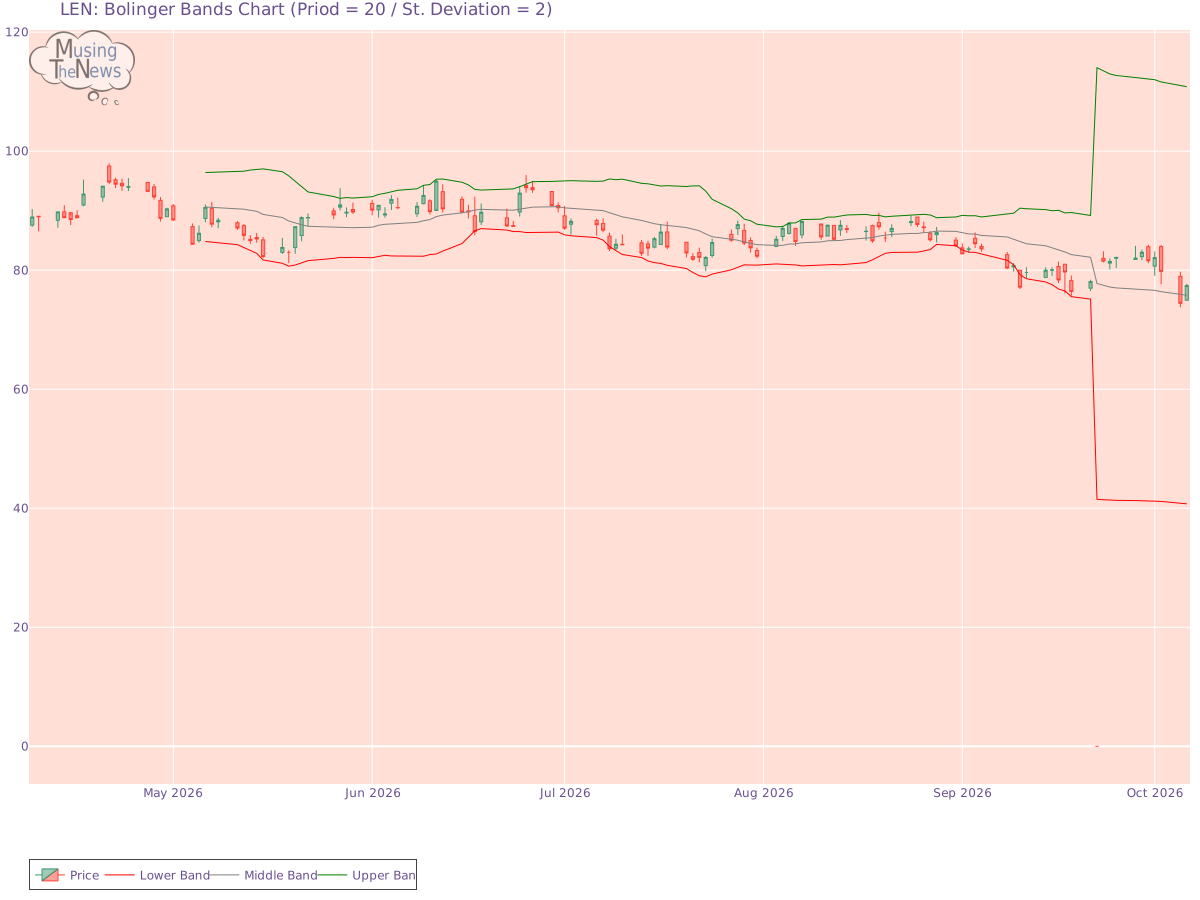
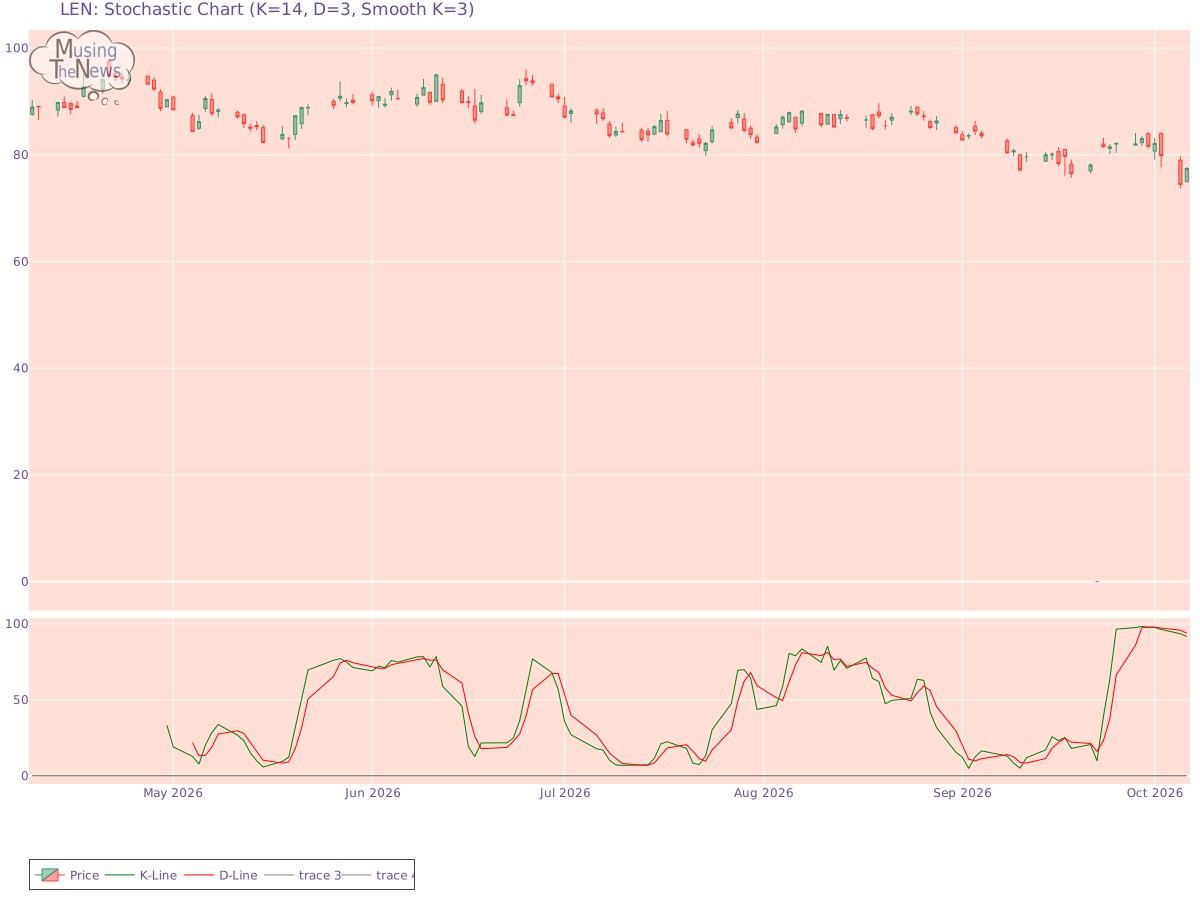
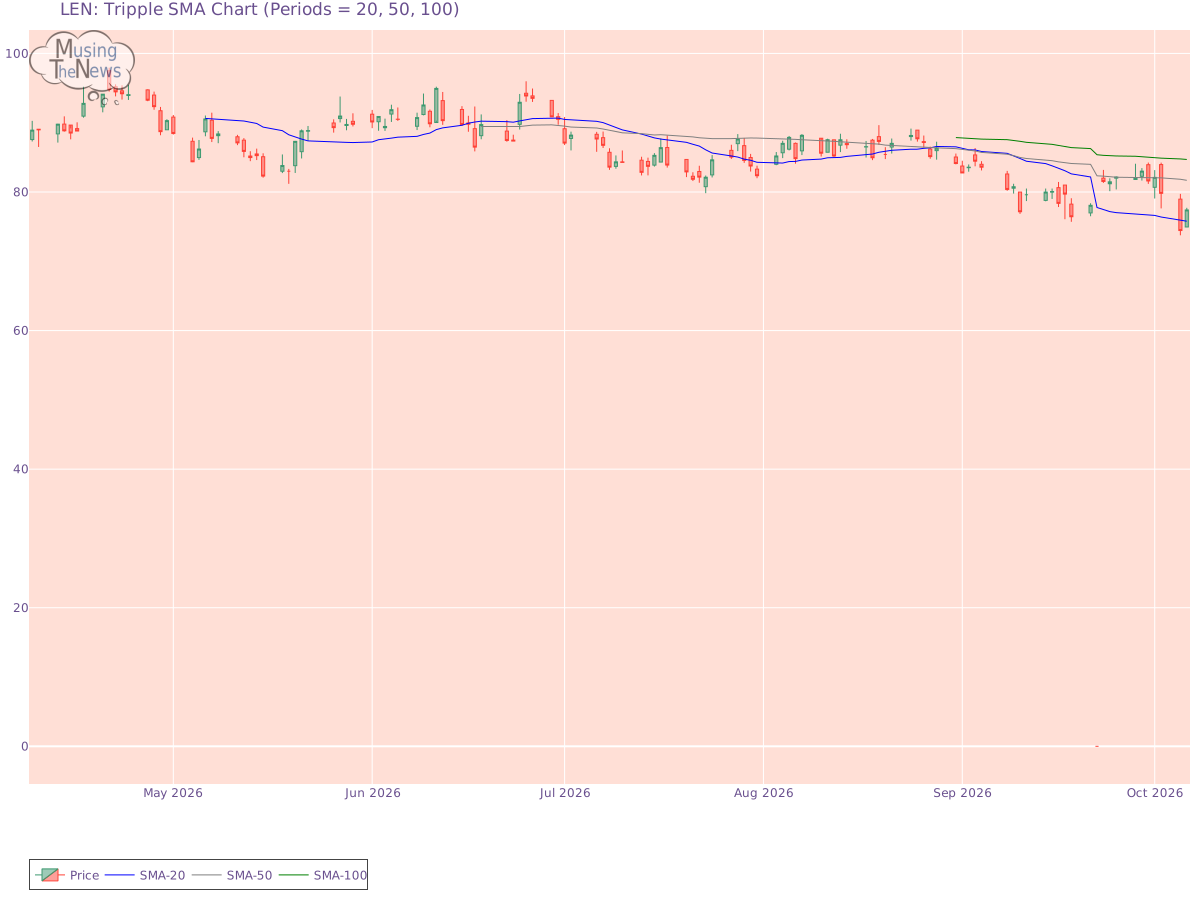
Aroon: The AROON is in a neutral stance, with no clear signals for movement up or down. This neutral position indicates a potential period of consolidation or uncertainty in the market.Aroon chart for Lennar CorporationBol. Bands: The BOLL BANDS is in a neutral stance, with no clear signals for movement up or down. This neutral position indicates a potential period of consolidation or uncertainty in the market.Bolinger Bands chart for Lennar CorporationParabolic SAR: The PSAR maintains its bullish stance, setting a significant support level that could help maintain the market's upward movement. This strong support suggests that the market is poised to continue its positive trend, providing confidence in the ongoing bullish momentum.Parabolic Stop and Reverse chart for Lennar CorporationStochastic: The K-line has moved below the D-line on the stochastic indicator, yet it remains above 80, signaling the potential beginning of a bearish price move for LEN. This pattern may indicate that the market's upward momentum is starting to wane, possibly leading to a downturn. Investors should watch for further confirmation.Stochastic chart for Lennar CorporationTripple Moving Agerage: The alignment of the 20-50-100 period moving averages suggests a bullish trend, but the slopes of the faster averages hint at a potential reversal. The weakening signals from these shorter-term averages indicate that the current upward momentum may be fading, suggesting that a change in direction could be near.Tripple SMA chart for Lennar Corporation A thorough analysis of a company involves looking beyond its stock price movements and trading patterns. You must also examine its fundamentals, which include profitability, growth prospects, and competitive advantages. Additionally, the industry in which the company operates provides important context, as factors like technological innovations, regulation, and market demand influence performance. By integrating this information with technical analysis, more accurate predictions about the company's future can be made.