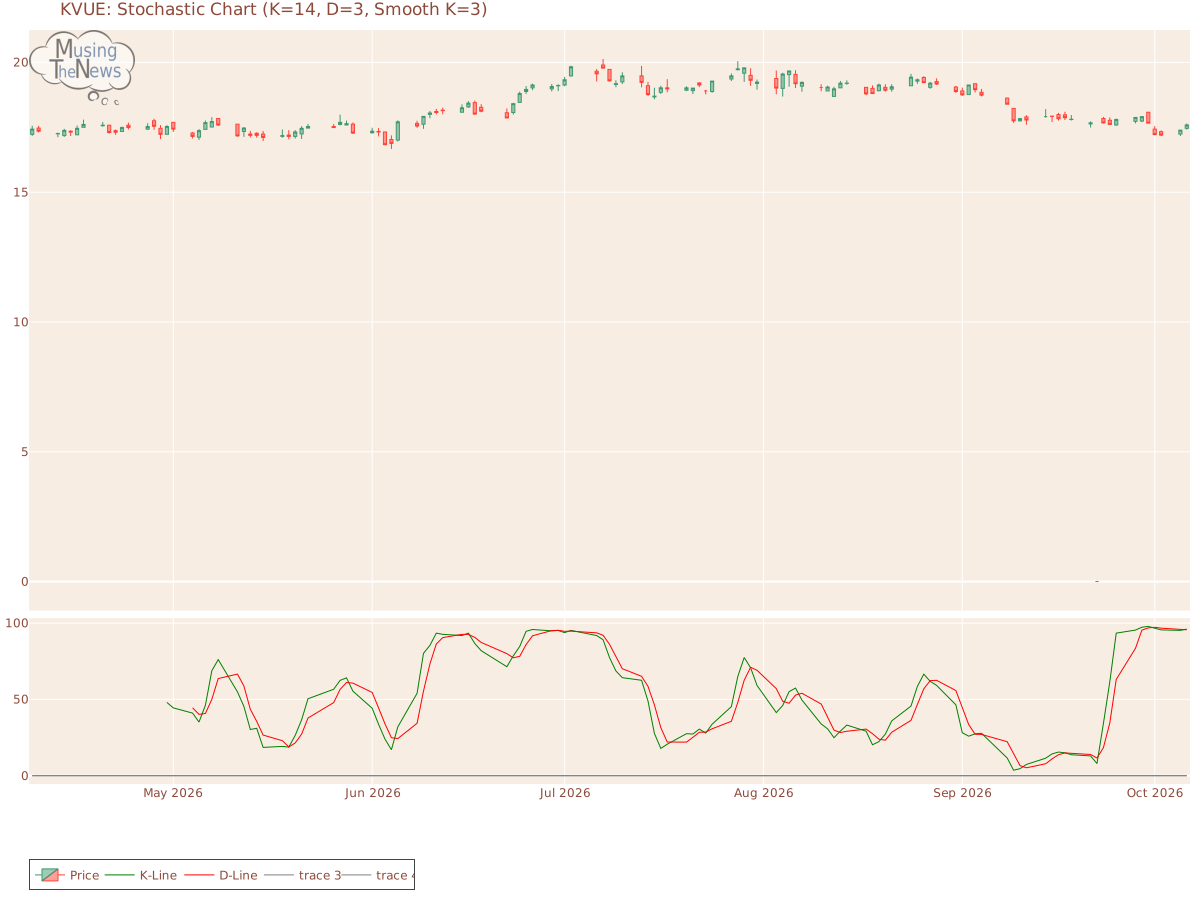
The stochastic indicator shows a bullish trend for KVUE, with the K-line positioned above the D-line and surpassing the 80 level. This setup indicates strong upward momentu...
By MusingTheNews
Updated 2026-10-07 23:26:29
Overall Technical outlook
Price Summary
Kenvue Inc.'s stock opened at 17.46 on 2026-10-06, surged to a high of 17.65, hit a low of 17.41, and closed up 0.74% at 17.59, with 10870700 shares traded. The stock reached its highest price of 19.83 and its lowest price of 0.0 during the 52-week period.
Technicals
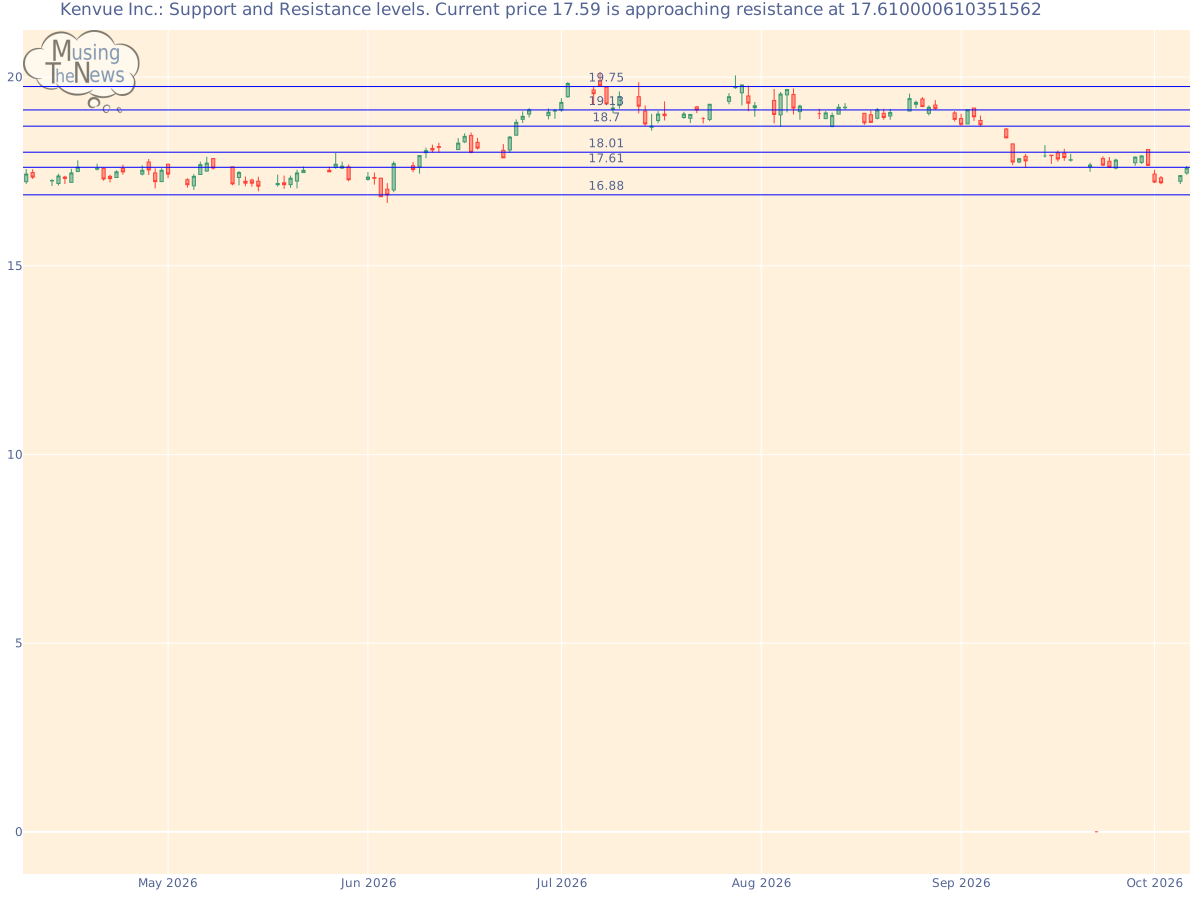
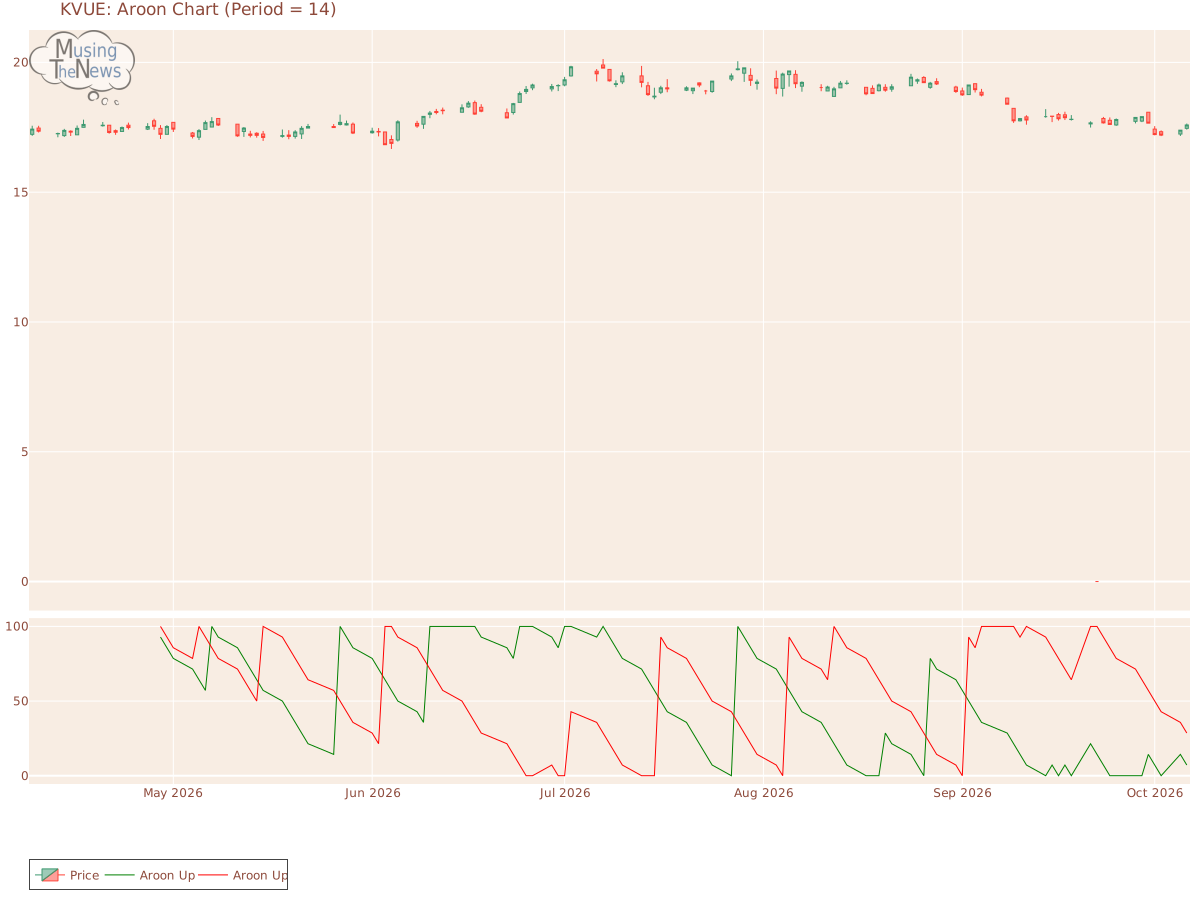
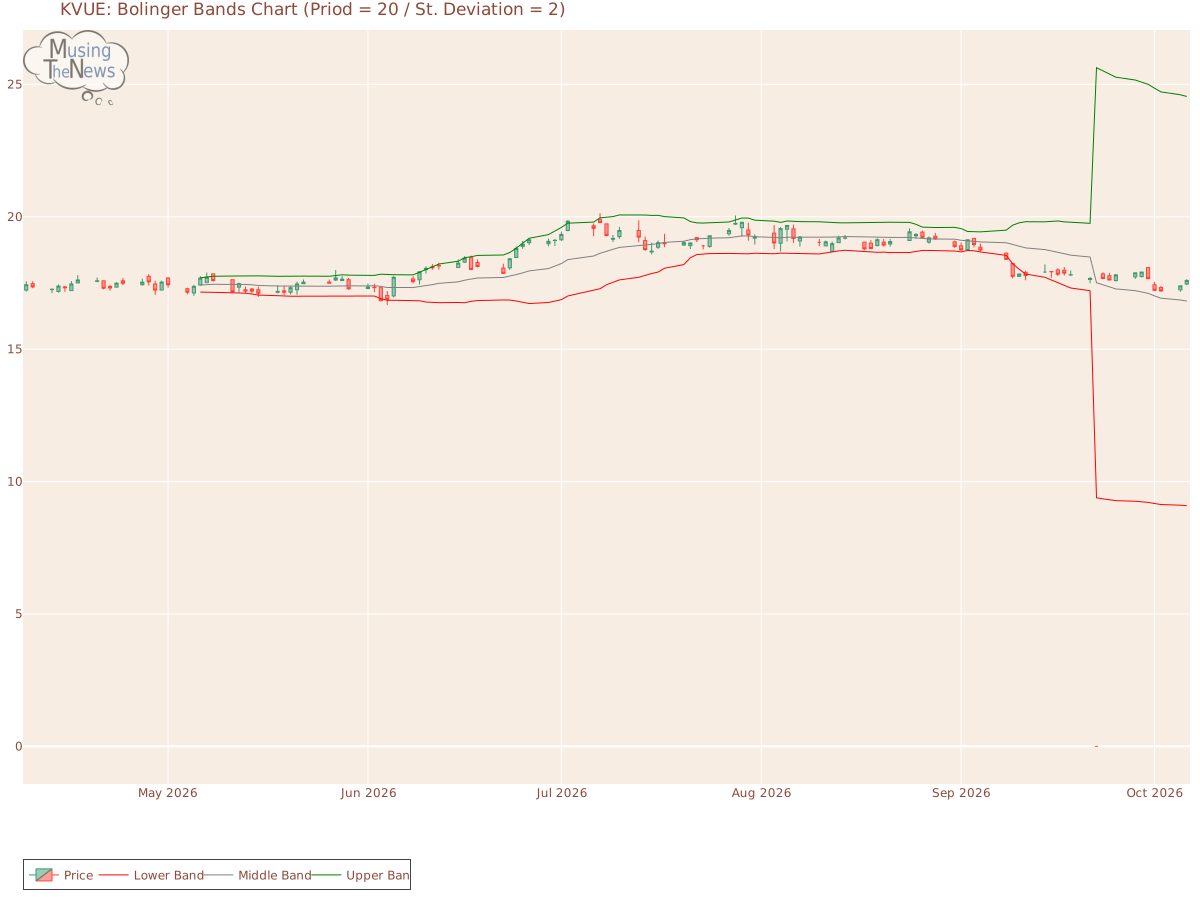
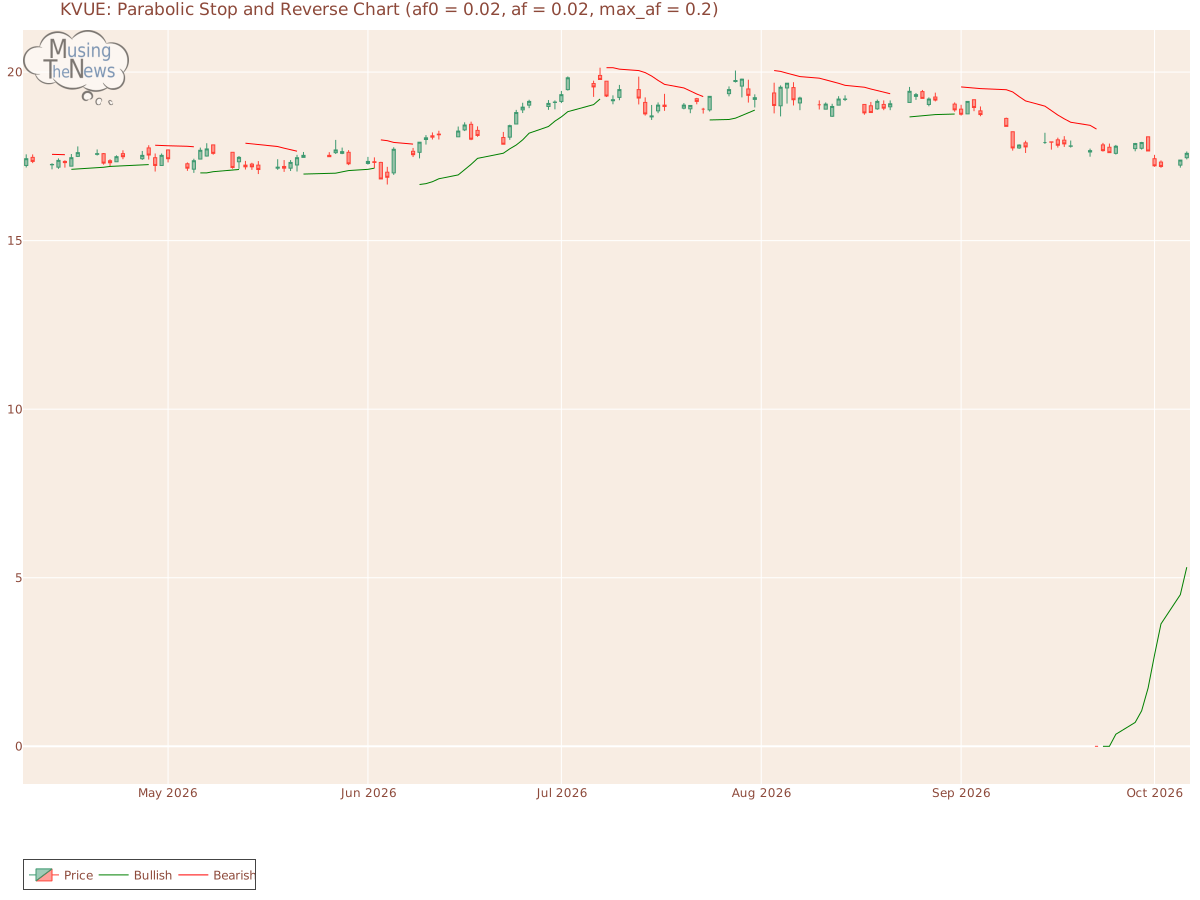
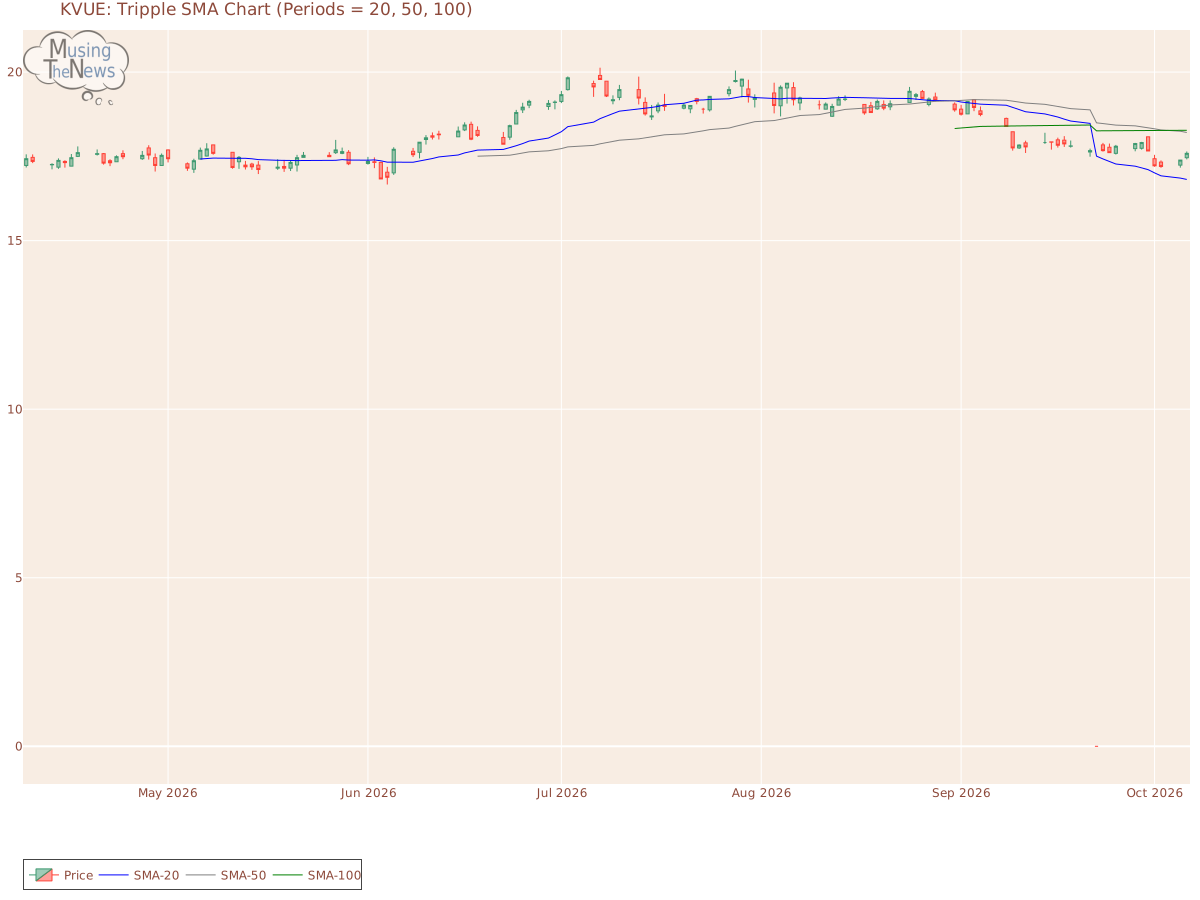
Support and Resistance: With the current price at 17.59, support is found at 16.88 and resistance at 17.61. These levels indicate where buyers might step in at 16.88, while sellers could limit gains at 17.61, defining a trading boundary for Kenvue Inc..Support/Resistance for KVUEAroon: The current reading of the AROON is neutral for KVUE, with no clear signals for an upward or downward trend. This indicates that the market may be in a state of uncertainty, with no dominant force driving the direction.Aroon chart for Kenvue Inc.Bol. Bands: The BOLL BANDS is currently in a neutral position for Kenvue Inc., offering no clear guidance on whether the market is likely to move up or down. This neutral stance suggests that further observation may be necessary before a trend becomes apparent.Bolinger Bands chart for Kenvue Inc.Parabolic SAR: The PSAR for KVUE maintains its bullish outlook, setting a strong support level that could underpin further gains. This suggests that the market is likely to continue its upward trajectory, with the established support providing a safety net for ongoing bullish momentum.Parabolic Stop and Reverse chart for Kenvue Inc.Stochastic: The stochastic indicator shows a bullish trend for KVUE, with the K-line positioned above the D-line and surpassing the 80 level. This setup indicates strong upward momentum, suggesting that the market may continue its positive trajectory. Traders might view this as a sign of ongoing strength in the market.Stochastic chart for Kenvue Inc.Tripple Moving Agerage: The Tripple MOVING AVG is currently in a neutral position for Kenvue Inc., offering no clear guidance on whether the market is likely to move up or down. This neutral stance suggests that further observation may be necessary before a trend becomes apparent.Tripple SMA chart for Kenvue Inc. To properly assess the technical data of a company, it's important to first look at its fundamentals, such as its earnings, growth potential, and management effectiveness. Equally, understanding the industry trends, competition, and external economic factors that influence the company is vital. This holistic view helps draw meaningful conclusions about the company's technical performance, allowing investors to better gauge its stock price behavior, volatility, and market trends.