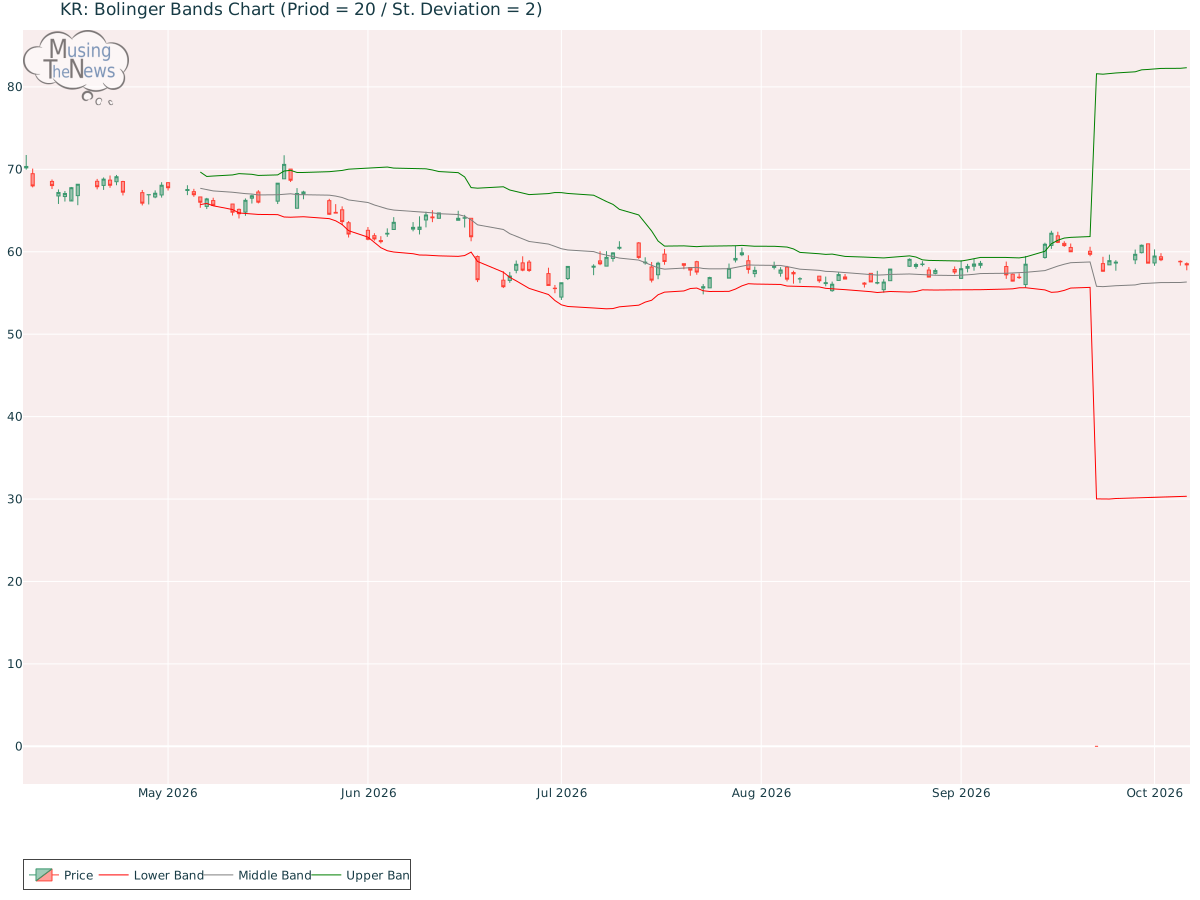
The current state of the BOLL BANDS is neutral, with no clear trend direction indicated. This lack of directional bias suggests that the market may be in a phase of consoli...
By MusingTheNews
Updated 2026-10-07 23:26:31
Overall Technical outlook
Price Summary
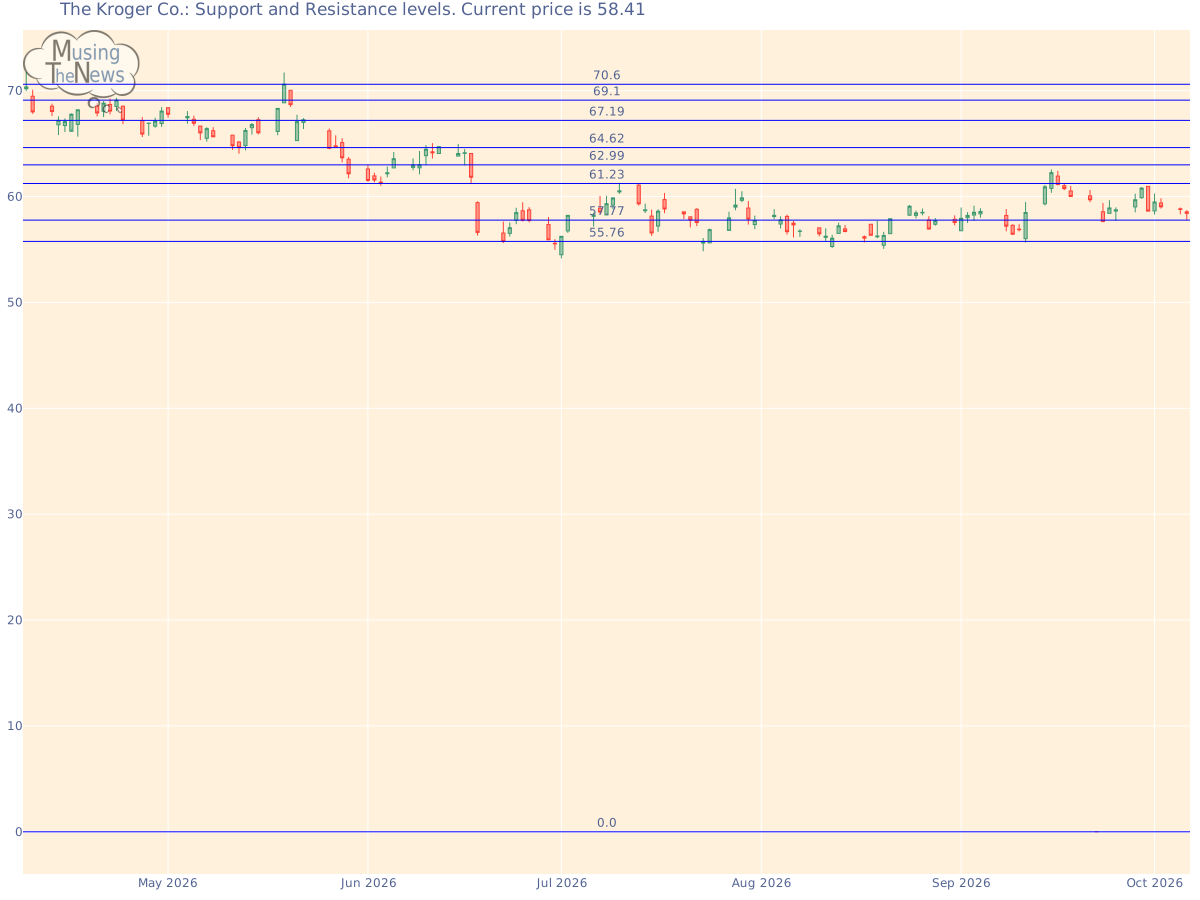
On 2026-10-06, KR's stock began at 58.55, peaked at 58.71, dipped to 57.75, and closed up -0.24% at 58.41, with a volume of 6547700 shares. In the past year, the highest stock price was 75.6, and the lowest was 0.0.
Technicals
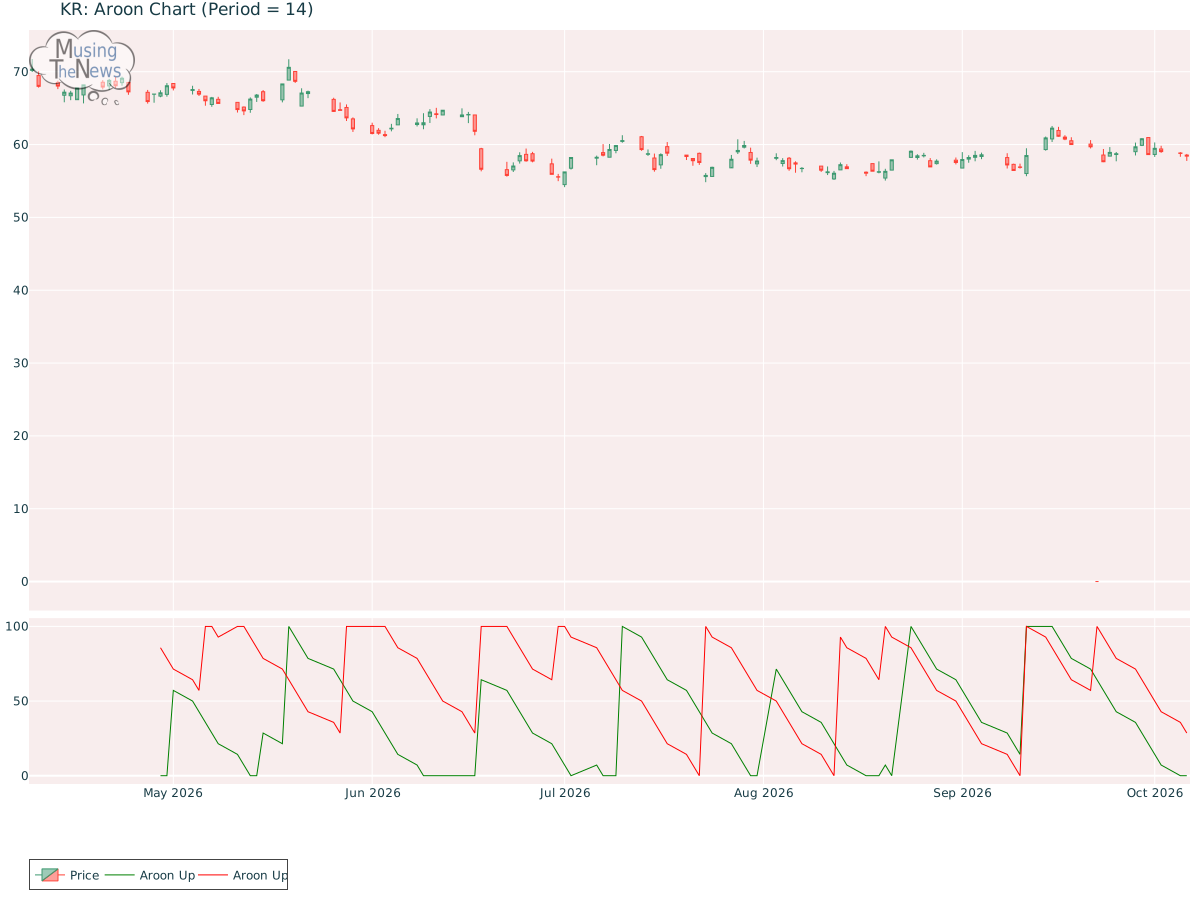
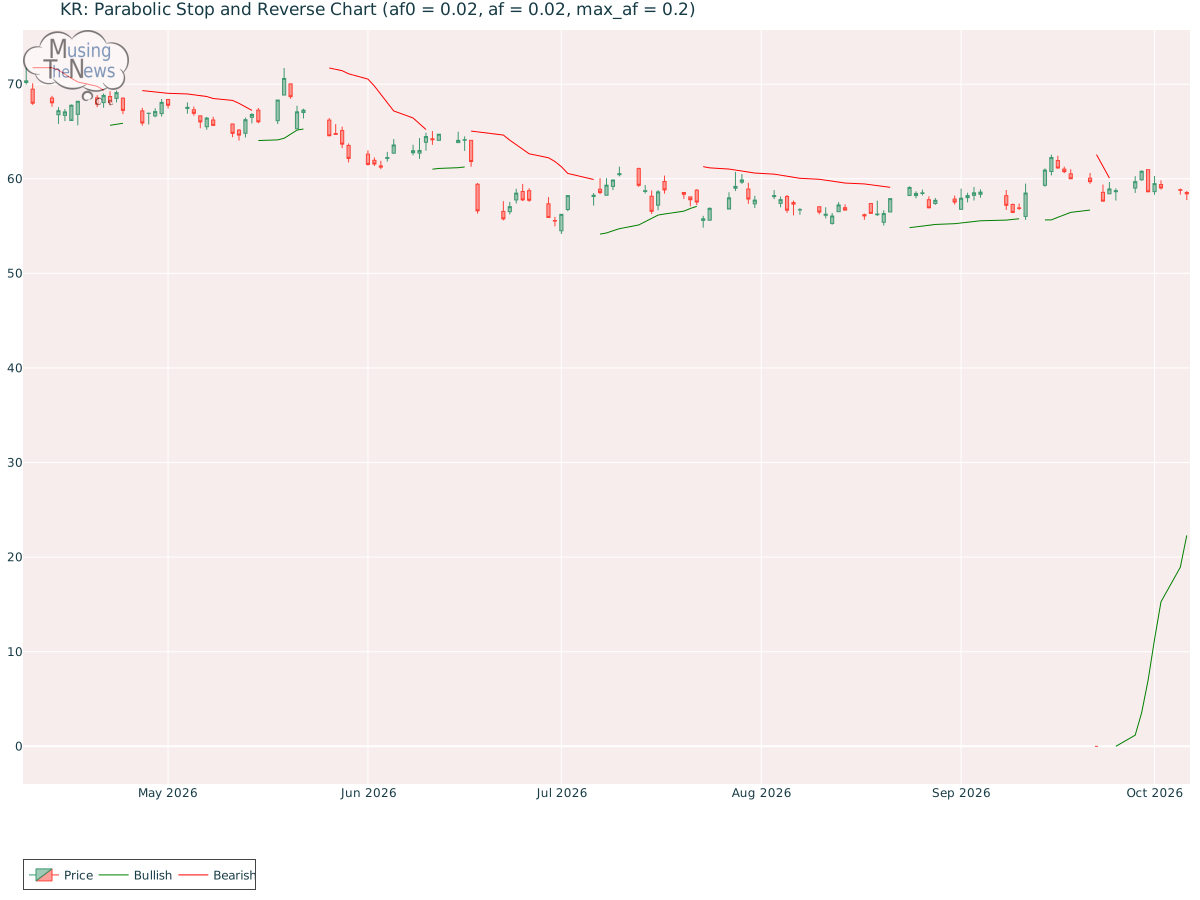
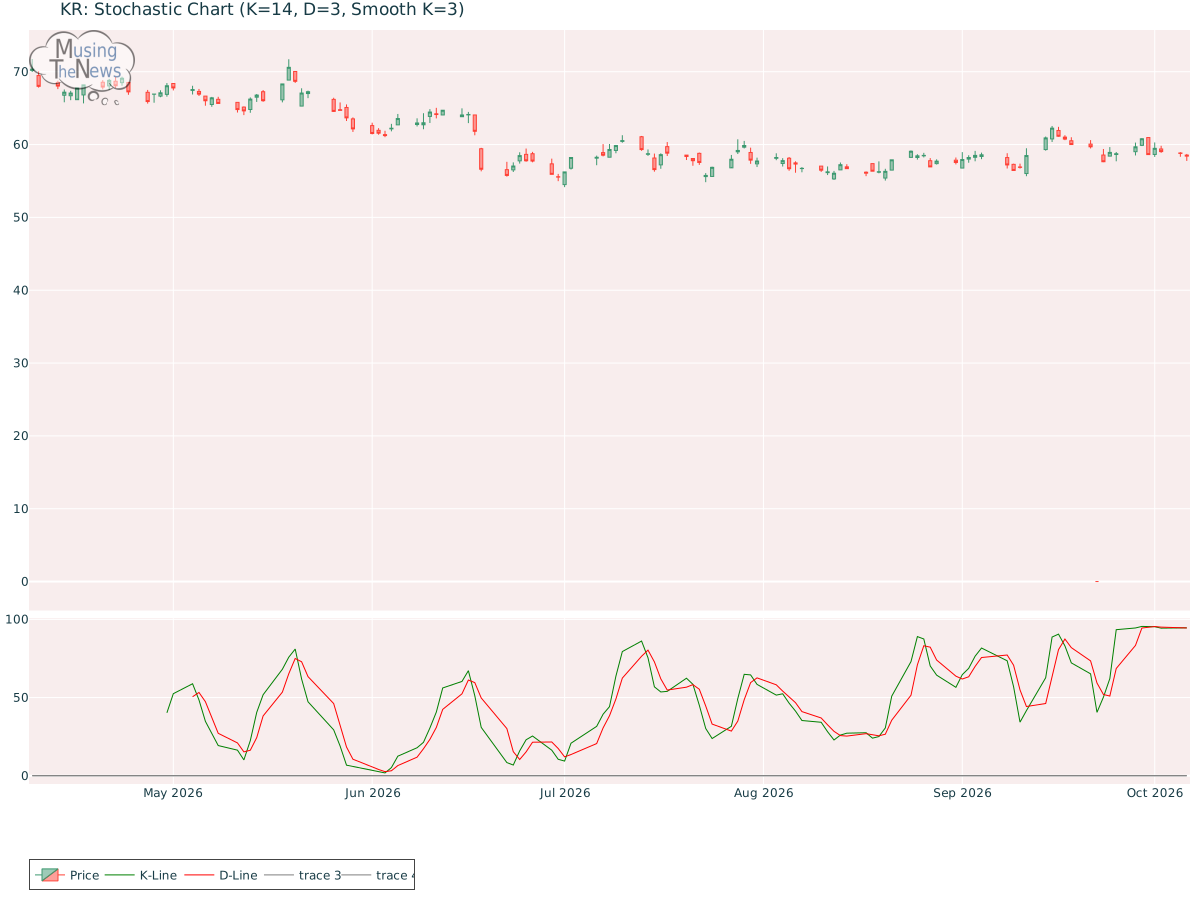
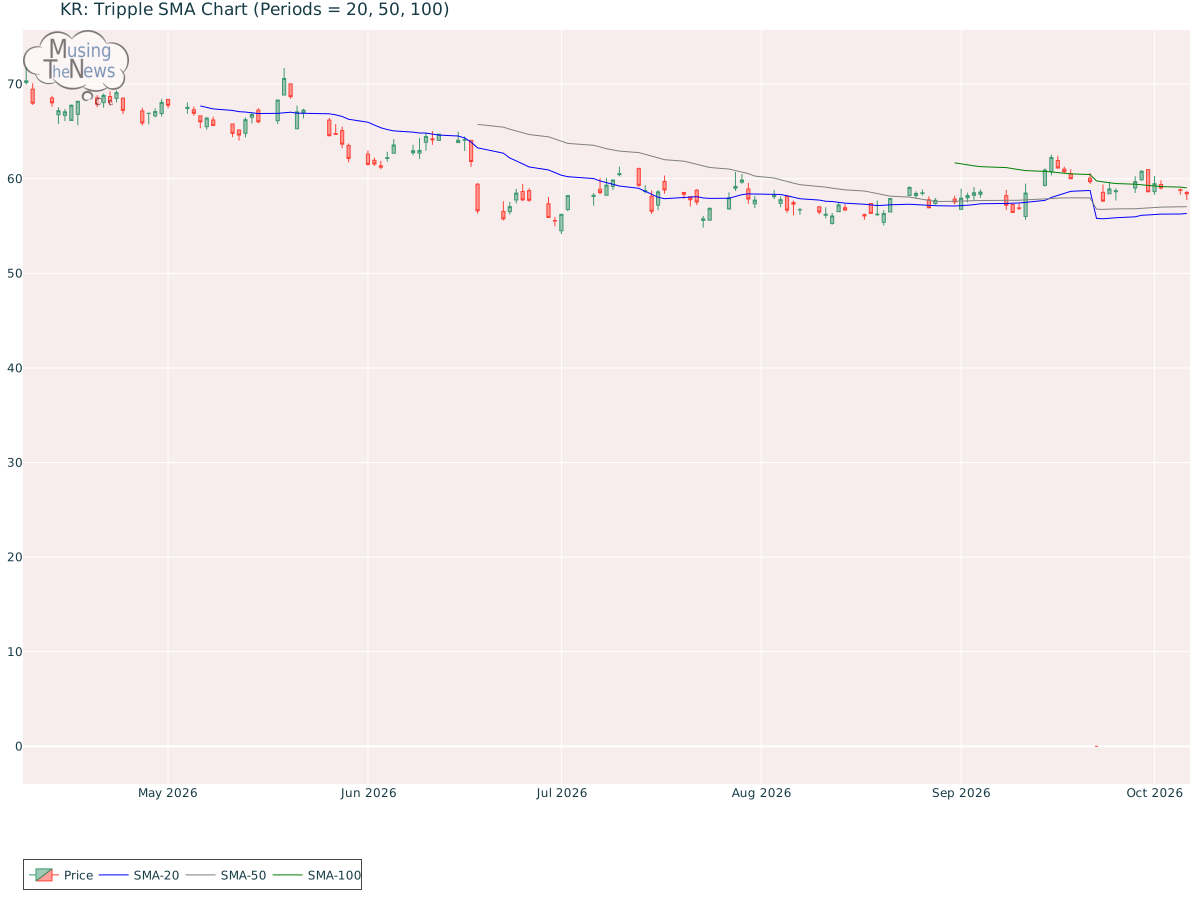
Support and Resistance: The price for KR at 58.41 is supported by the 57.77 level and faces resistance at 61.23. This range indicates key levels where the price may find buyers near 57.77 and sellers near 61.23, defining a trading range.Support/Resistance for KRAroon: The current reading of the AROON indicator suggests a neutral stance, with no clear signals indicating an upward or downward direction. This lack of directional bias suggests the market may be in a period of consolidation or uncertainty.Aroon chart for The Kroger Co.Bol. Bands: The current state of the BOLL BANDS is neutral, with no clear trend direction indicated. This lack of directional bias suggests that the market may be in a phase of consolidation or uncertainty.Bolinger Bands chart for The Kroger Co.Parabolic SAR: The PSAR continues to indicate a bullish outlook, establishing a key support level that could sustain the market's upward trend. This support suggests that the bullish momentum is likely to persist, offering a foundation for further growth.Parabolic Stop and Reverse chart for The Kroger Co.Stochastic: The stochastic indicator for KR reflects a bullish outlook, with the K-line positioned above the D-line and surpassing the 80 mark. This setup suggests strong upward momentum, implying that the market may continue to rise. Investors may interpret this as a positive signal for further gains.Stochastic chart for The Kroger Co.Tripple Moving Agerage: The current alignment of the 20, 50, and 100 moving averages suggests a bullish trend, with their upward slopes further reinforcing this sentiment for KR. This indicates a mildly bullish overall market condition, where gains are expected to be steady and gradual. Investors may interpret this as a sign of a stable market with moderate growth potential over time.Tripple SMA chart for The Kroger Co. In order to draw meaningful inferences from a company's technical data, it is essential to first consider its fundamentals. This includes reviewing financial metrics like revenue, profit margins, and debt-to-equity ratios. Additionally, understanding the broader industry landscape, including market trends and competitive pressures, is crucial. By integrating these insights with the company's technical performance, such as stock price fluctuations and trading volume, one can make more informed investment decisions.