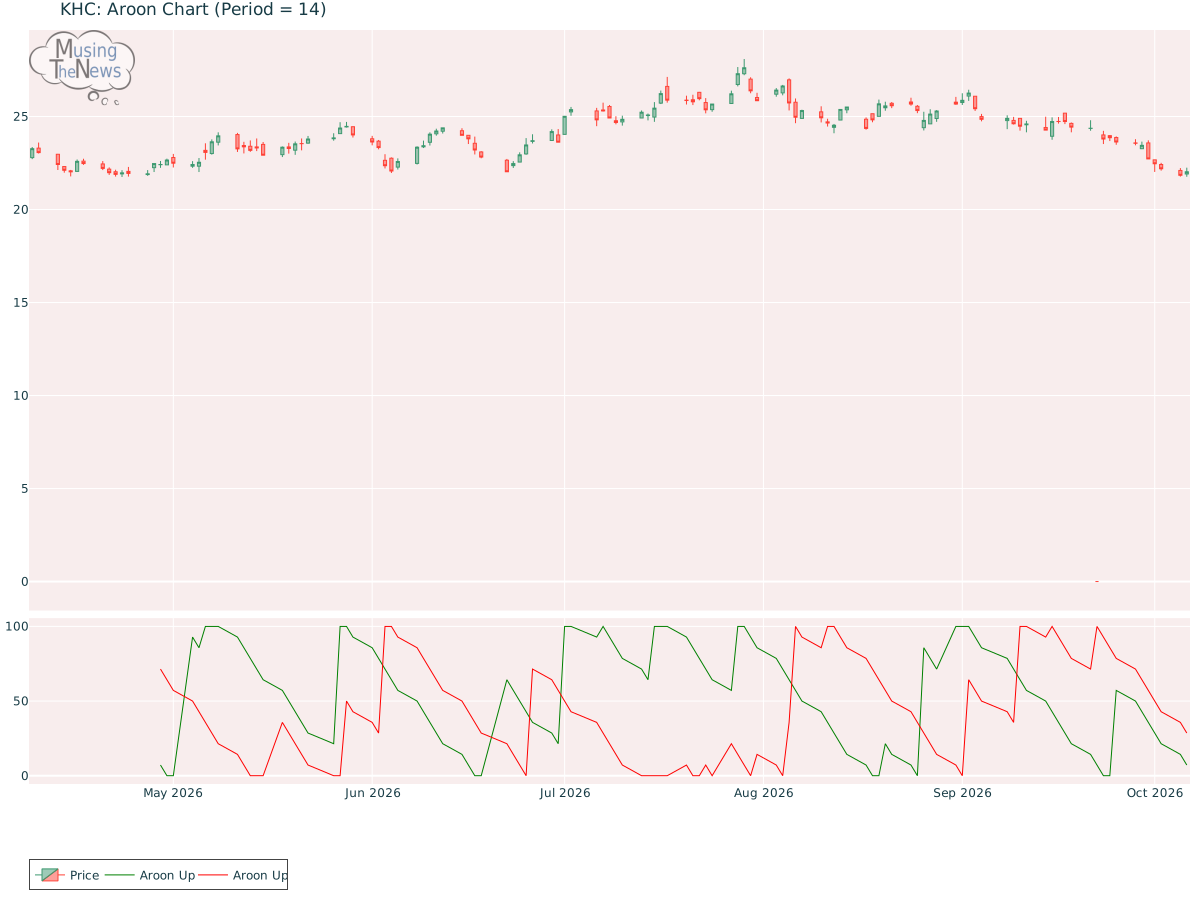
The AROON is in a neutral stance for KHC, not indicating a clear upward or downward trend. This suggests a period of market indecision, where neither bulls nor bears have t...
By MusingTheNews
Updated 2026-10-07 23:26:31
Overall Technical outlook
Price Summary
The Kraft Heinz Company's stock started trading at 21.91 on 2026-10-06, climbed to 22.25, fell to 21.76, and closed 0.55% higher at 22.03, with 20042100 shares traded. The highest price the stock achieved in the past 52 weeks is 27.62, while the lowest price it saw is 0.0.
Technicals
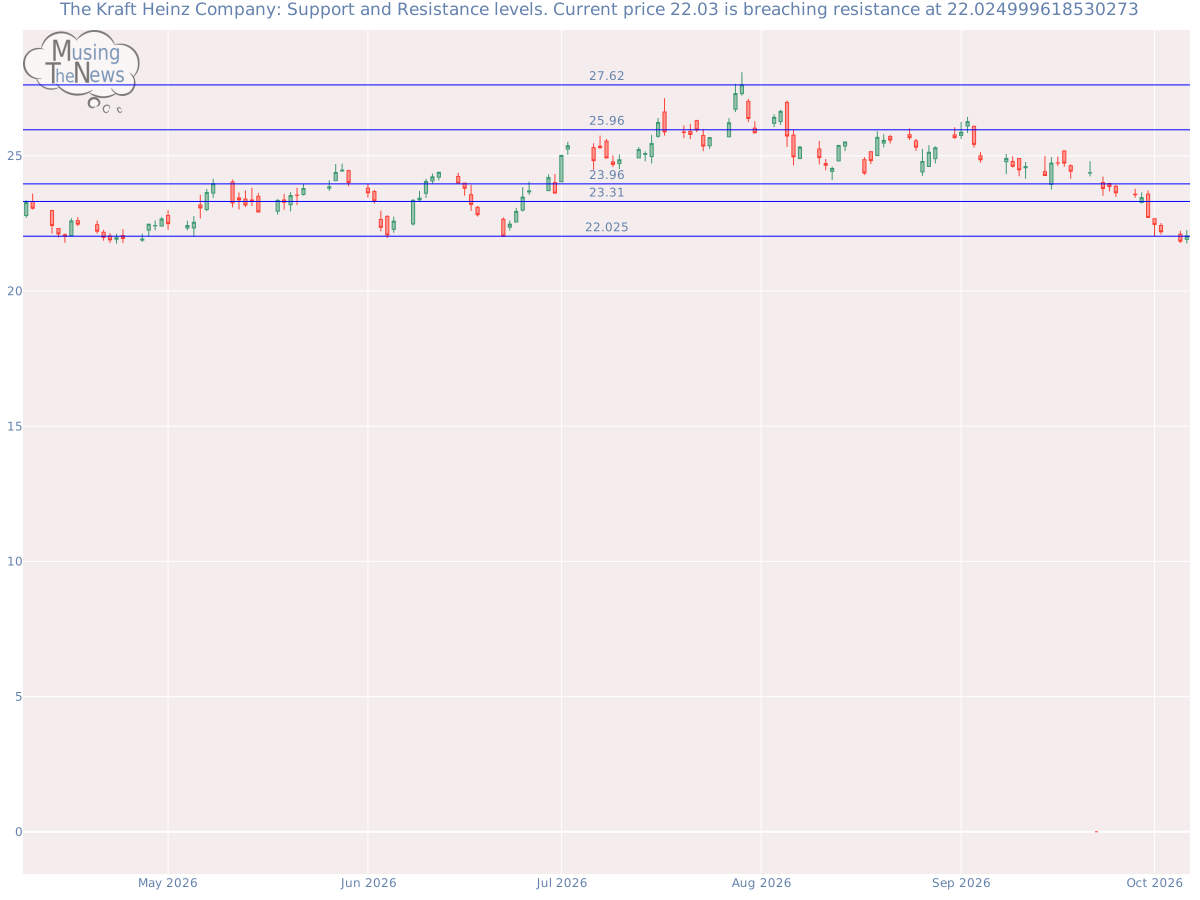
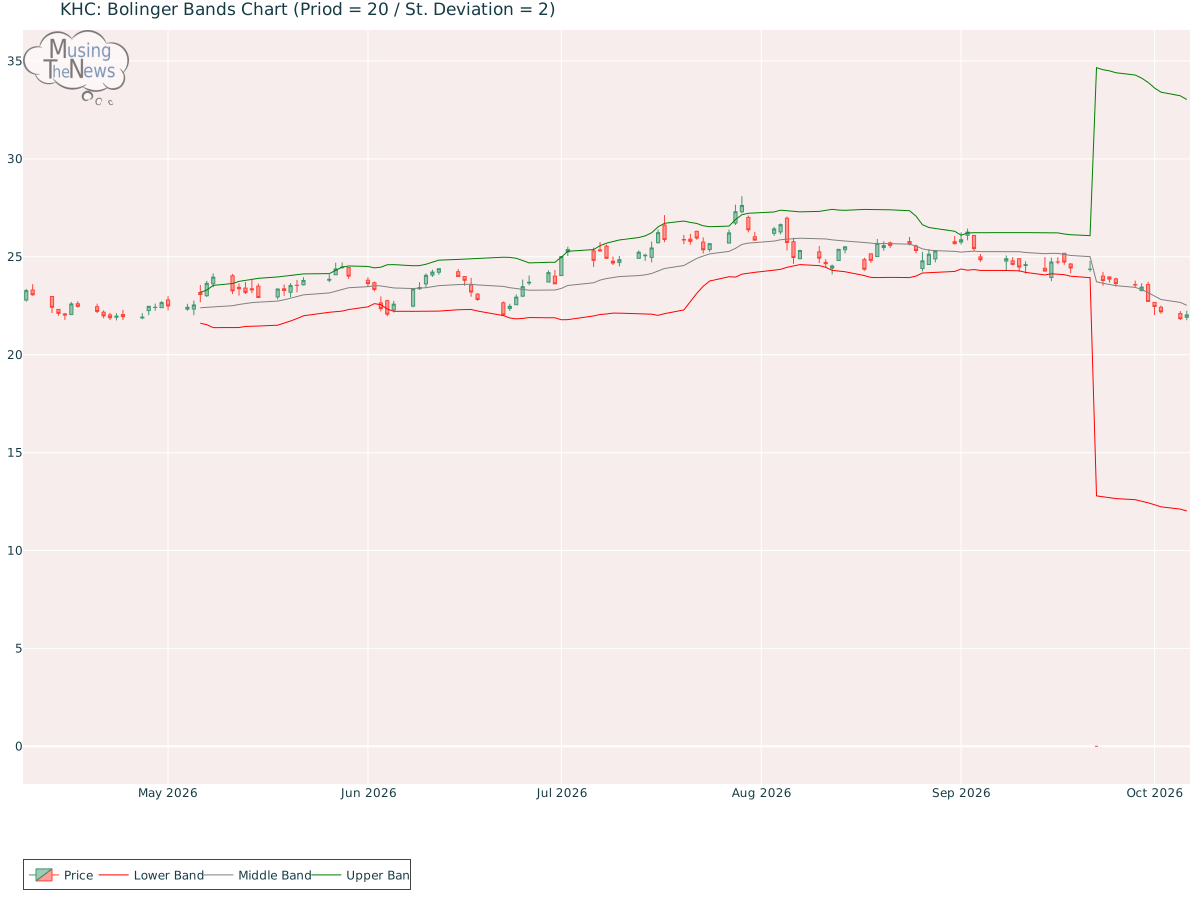
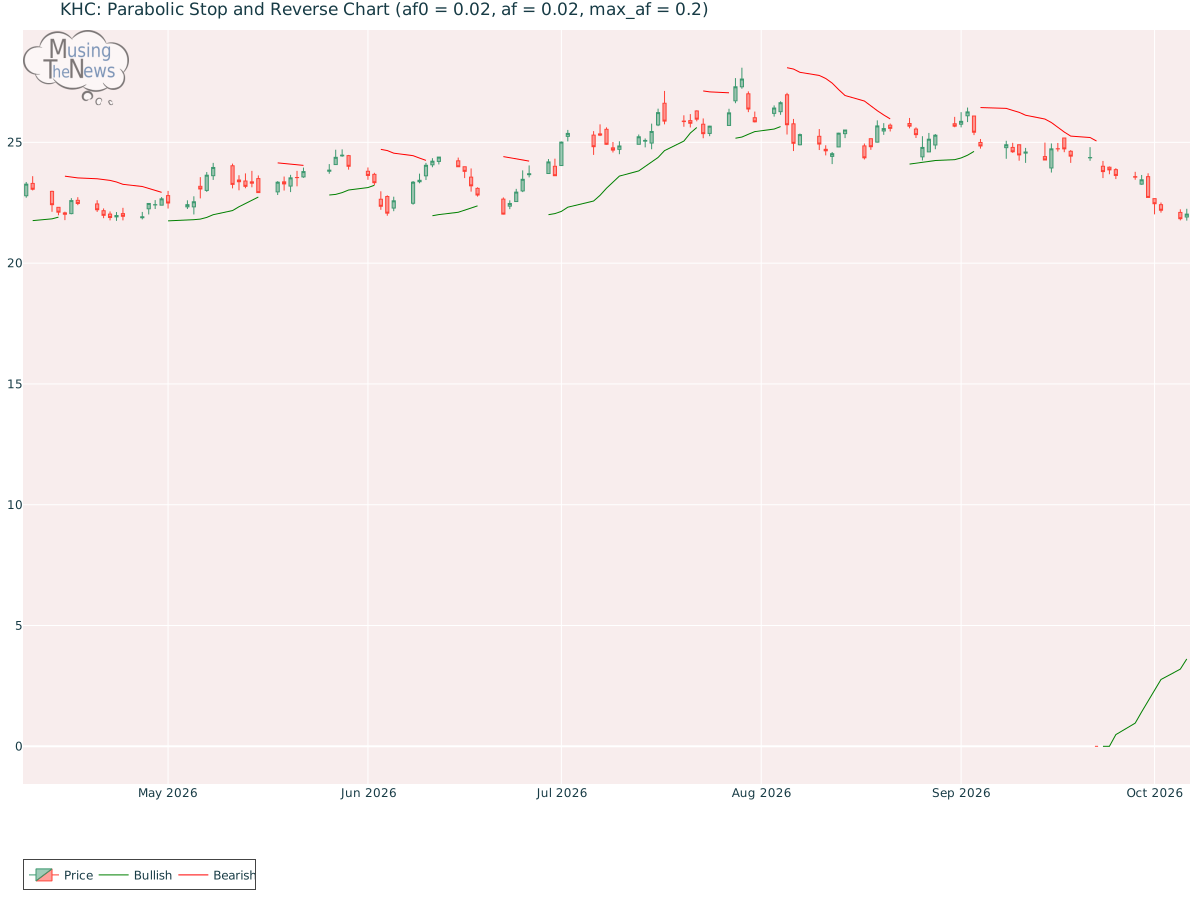
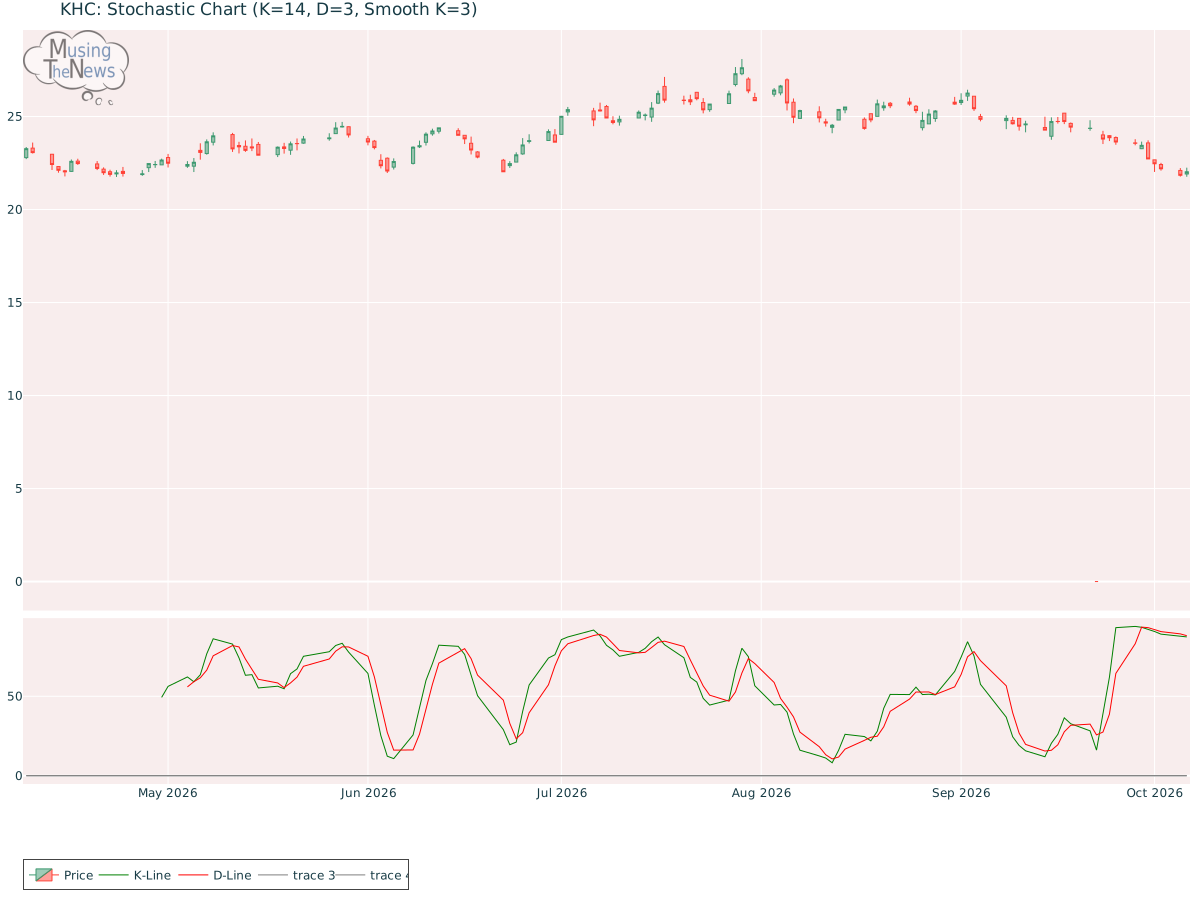
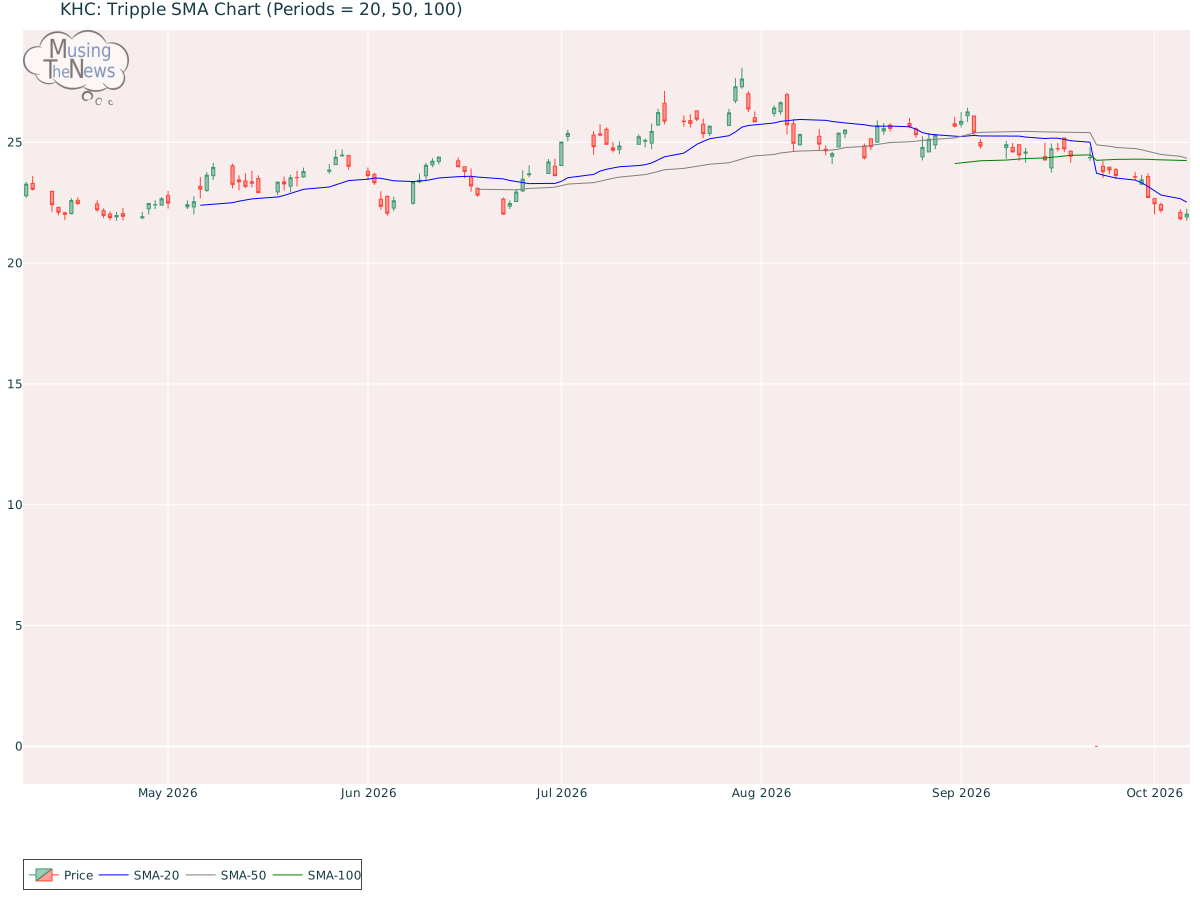
Support and Resistance: The current price sits at 22.03, supported at 22.02 and capped by resistance at 23.31. These levels define a range for KHC where the price might stabilize, with 22.02 as a floor and 23.31 as a ceiling.Support/Resistance for KHCAroon: The AROON is in a neutral stance for KHC, not indicating a clear upward or downward trend. This suggests a period of market indecision, where neither bulls nor bears have the upper hand.Aroon chart for The Kraft Heinz CompanyBol. Bands: The BOLL BANDS is neutral, showing no definitive signals of a trend either upward or downward. This neutral stance indicates a period of market indecision, where the direction is unclear.Bolinger Bands chart for The Kraft Heinz CompanyParabolic SAR: The PSAR remains bullish, setting a strong support level that could underpin further upward movement. This persistent bullish outlook suggests that the market may continue its positive trajectory, with the established support acting as a safety net.Parabolic Stop and Reverse chart for The Kraft Heinz CompanyStochastic: The stochastic indicator shows the K-line dropping below the D-line but staying above 80, indicating the possible start of a bearish price move. This setup may signal that the market's recent momentum is waning, which could result in a downturn. Traders should remain vigilant for additional signs of weakness for The Kraft Heinz Company.Stochastic chart for The Kraft Heinz CompanyTripple Moving Agerage: The Tripple MOVING AVG is in a neutral stance, with no clear direction indicated for the market. This lack of clarity suggests that the market may be in a state of equilibrium for KHC, with no strong trend emerging.Tripple SMA chart for The Kraft Heinz Company A thorough analysis of a company involves looking at both its fundamentals and technical data. The fundamentals, including revenue, profitability, and management quality, offer insight into the company's long-term value. Additionally, understanding the broader industry context, such as market competition and regulatory challenges, helps to better interpret the company's stock performance. By combining both fundamental and technical analysis, you can derive more meaningful inferences about the company's future prospects.