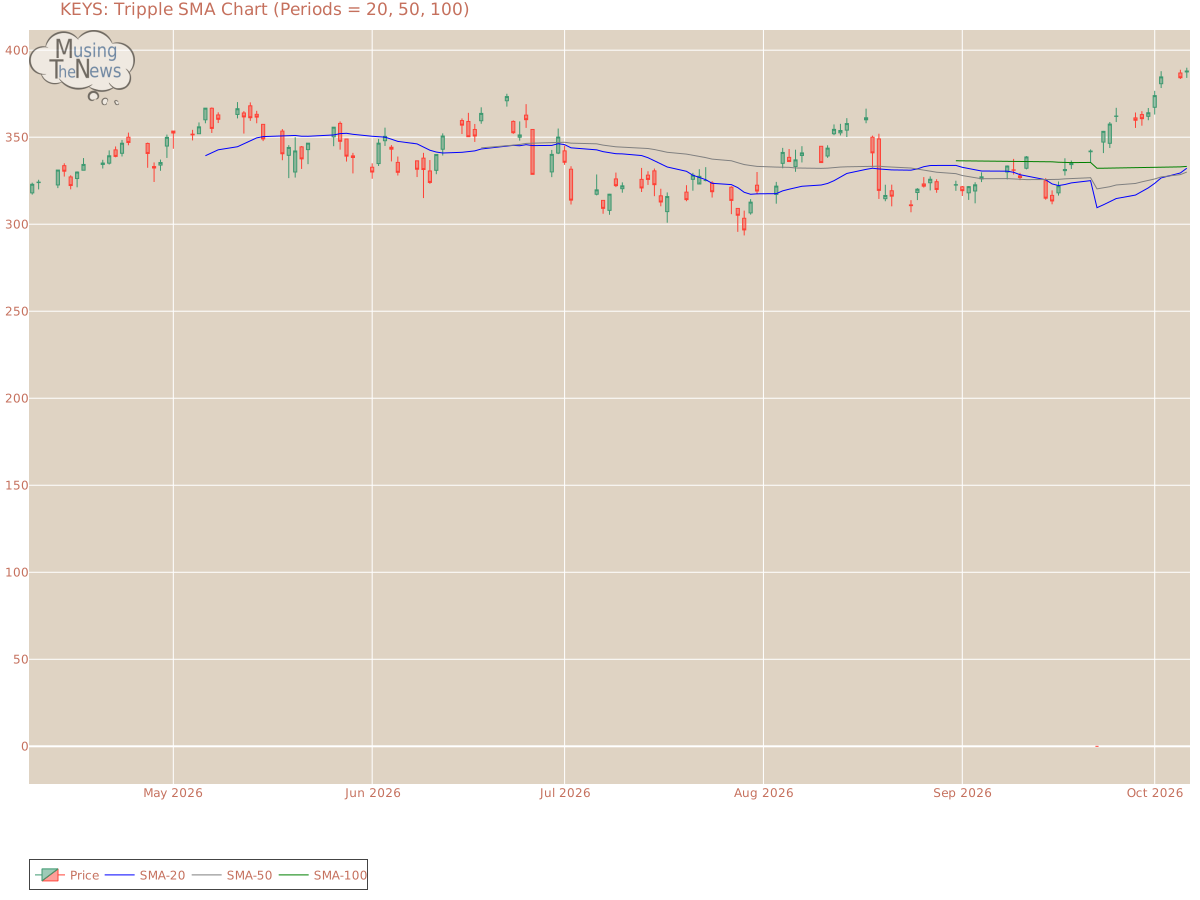
The current state of the Tripple MOVING AVG is neutral, offering no clear signals of movement in either direction. This suggests a potential pause in market activity, with ...
By MusingTheNews
Updated 2026-10-07 23:26:30
Overall Technical outlook
Price Summary
On 2026-10-06, Keysight Technologies, Inc.'s stock opened at 387.49, spiked to 389.93, declined to 384.07, and closed 0.14% higher at 388.03, with 1479700 shares traded. Over the past year, the stock's highest price was 388.03, and its lowest was 0.0.
Technicals
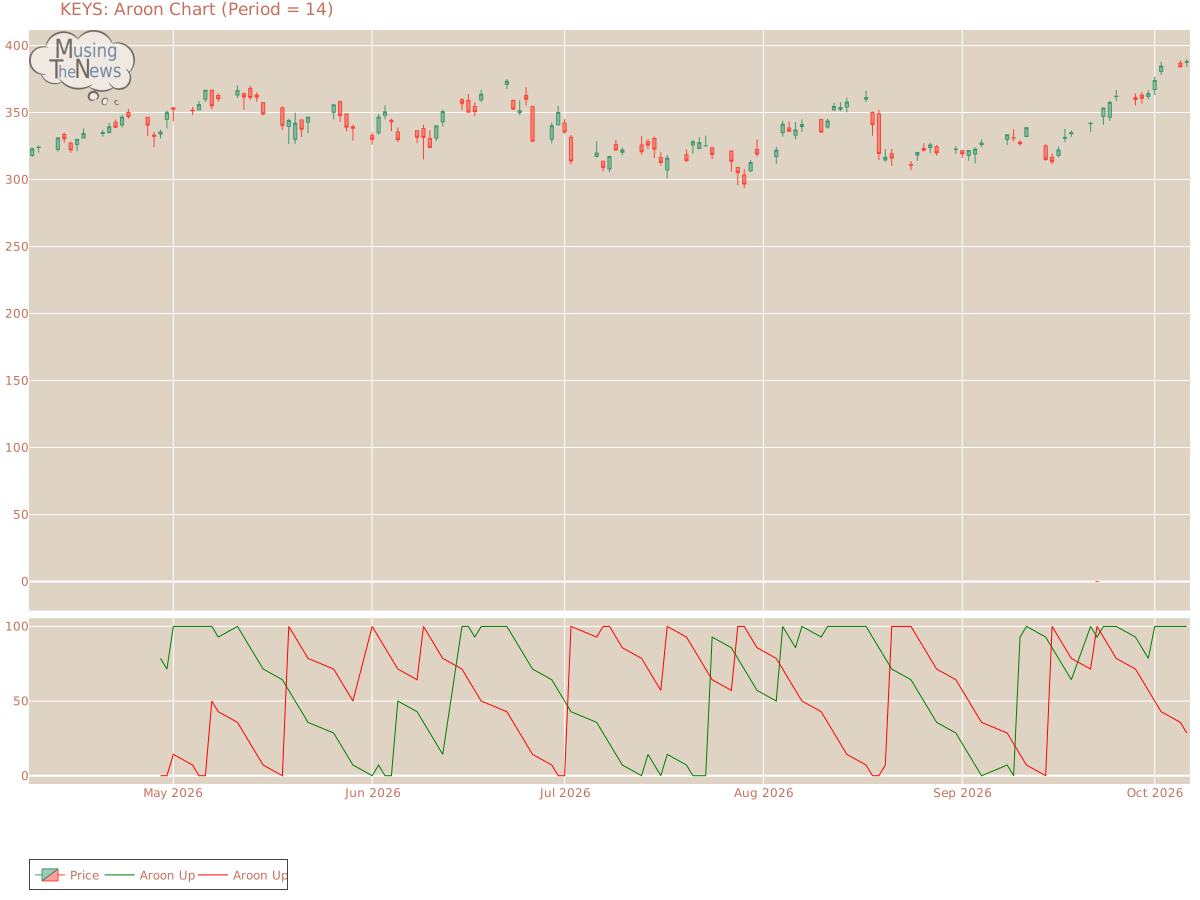
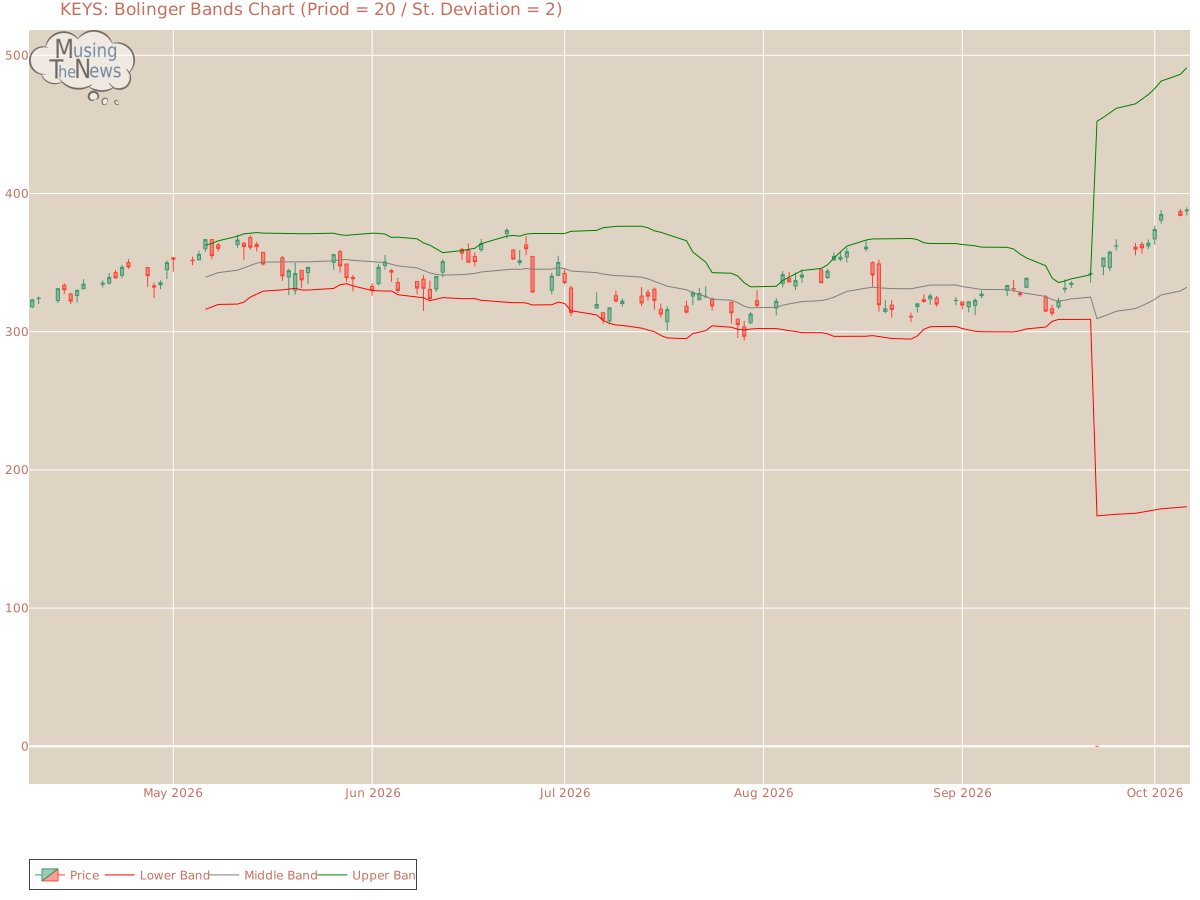
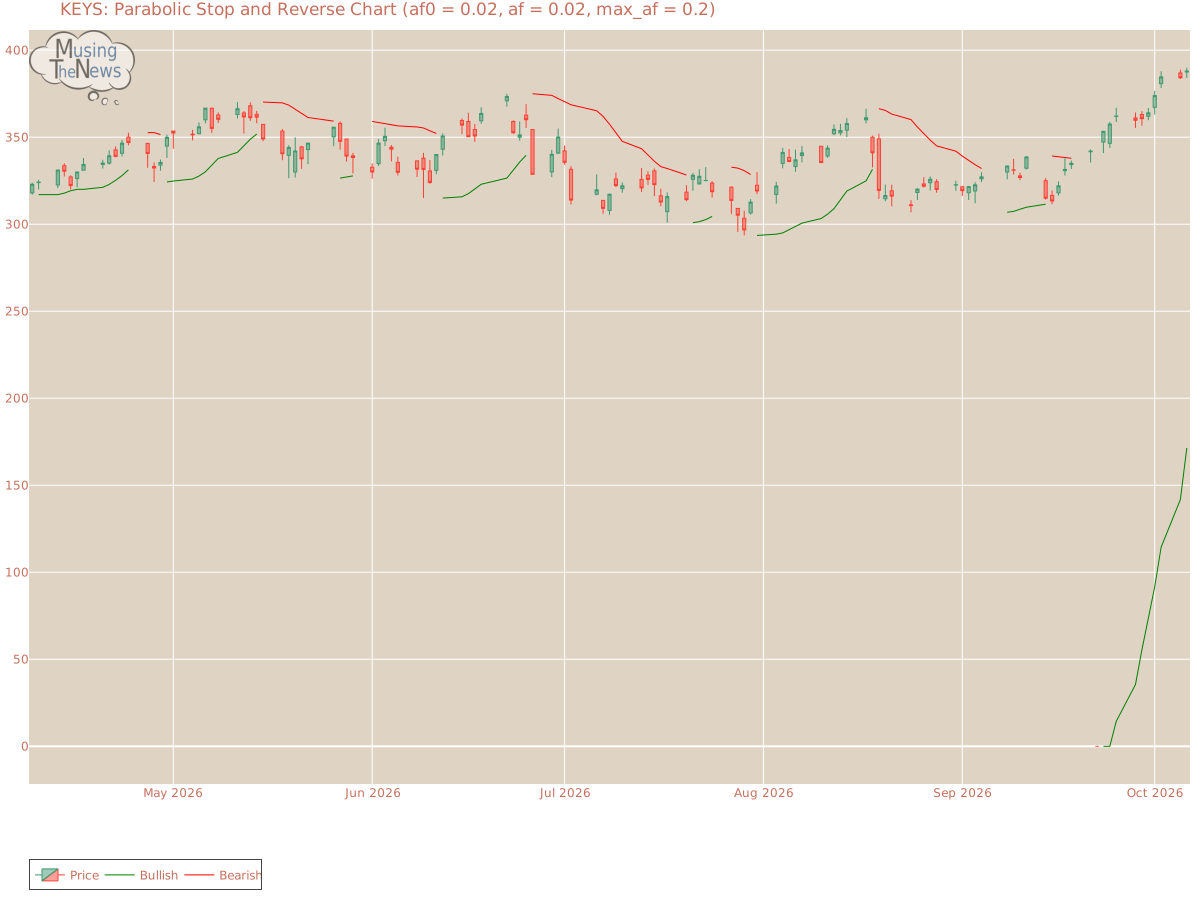
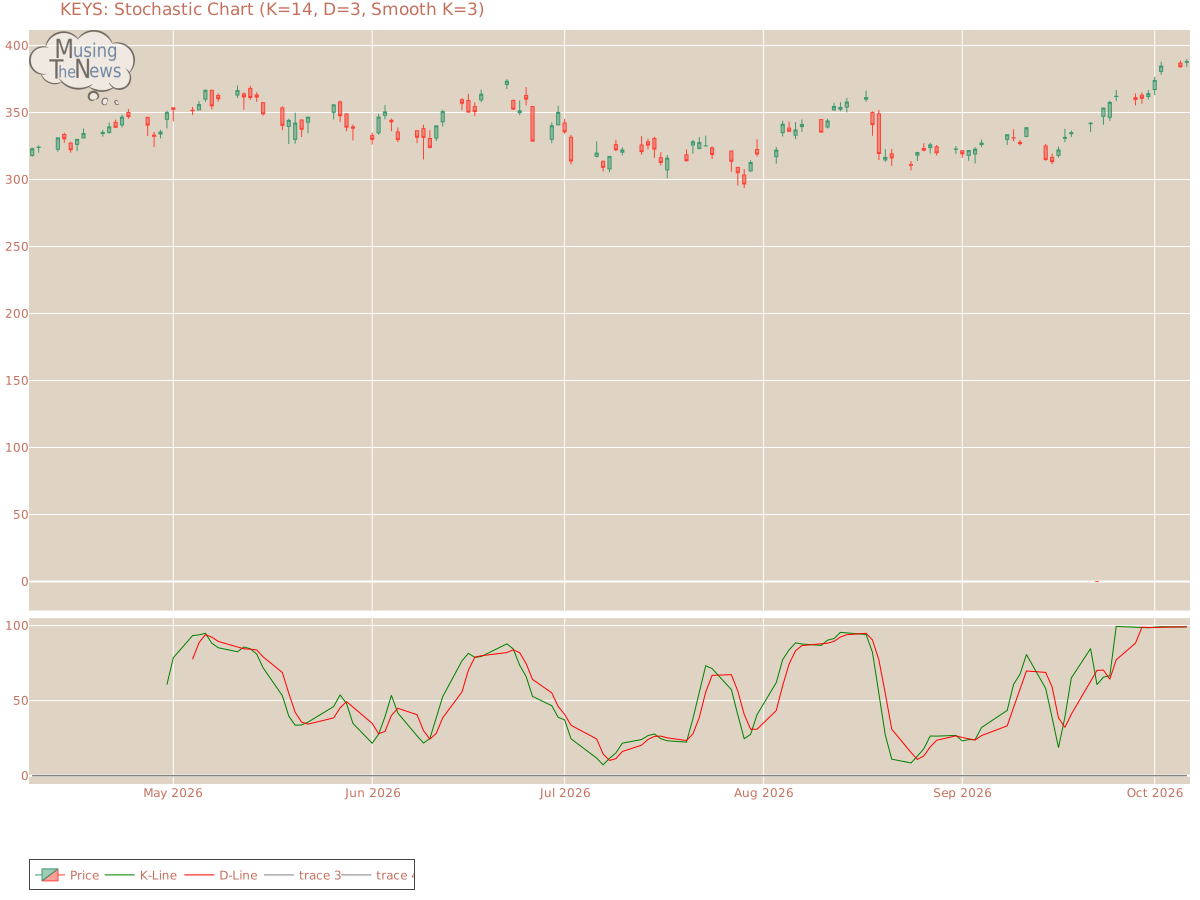
Aroon: Aroon's bullish trend is ongoing, with Aroon Up consistently at the 100 level. While this suggests strong upward momentum for KEYS, it's important to analyze this trend further with other indicators to gain a comprehensive understanding of the direction.Aroon chart for Keysight Technologies, Inc.Bol. Bands: The BOLL BANDS is currently neutral, showing no clear bias toward a rising or falling trend. This lack of directional clarity suggests that the market may be in a holding pattern, awaiting further developments.Bolinger Bands chart for Keysight Technologies, Inc.Parabolic SAR: The PSAR continues to indicate a bullish outlook, establishing a key support level that could sustain the market's upward trend. This support suggests that the bullish momentum is likely to persist, offering a foundation for further growth.Parabolic Stop and Reverse chart for Keysight Technologies, Inc.Stochastic: The stochastic indicator is in a bullish mode, with the K-line crossing above the D-line and the 80 level for KEYS. This alignment suggests strong upward momentum, indicating that the market may continue to trend higher. Investors could interpret this as a positive sign of sustained market growth.Stochastic chart for Keysight Technologies, Inc.Tripple Moving Agerage: The current state of the Tripple MOVING AVG is neutral, offering no clear signals of movement in either direction. This suggests a potential pause in market activity, with no strong trend emerging at the moment.Tripple SMA chart for Keysight Technologies, Inc. A company's technical data, including stock price and trading volume, can provide valuable insights when considered alongside its fundamentals. These include financial performance, market share, and growth strategy, as well as broader industry dynamics. Examining these factors helps investors or analysts make more informed decisions, as the company's fundamentals offer context for understanding how and why certain technical patterns may emerge in the market.