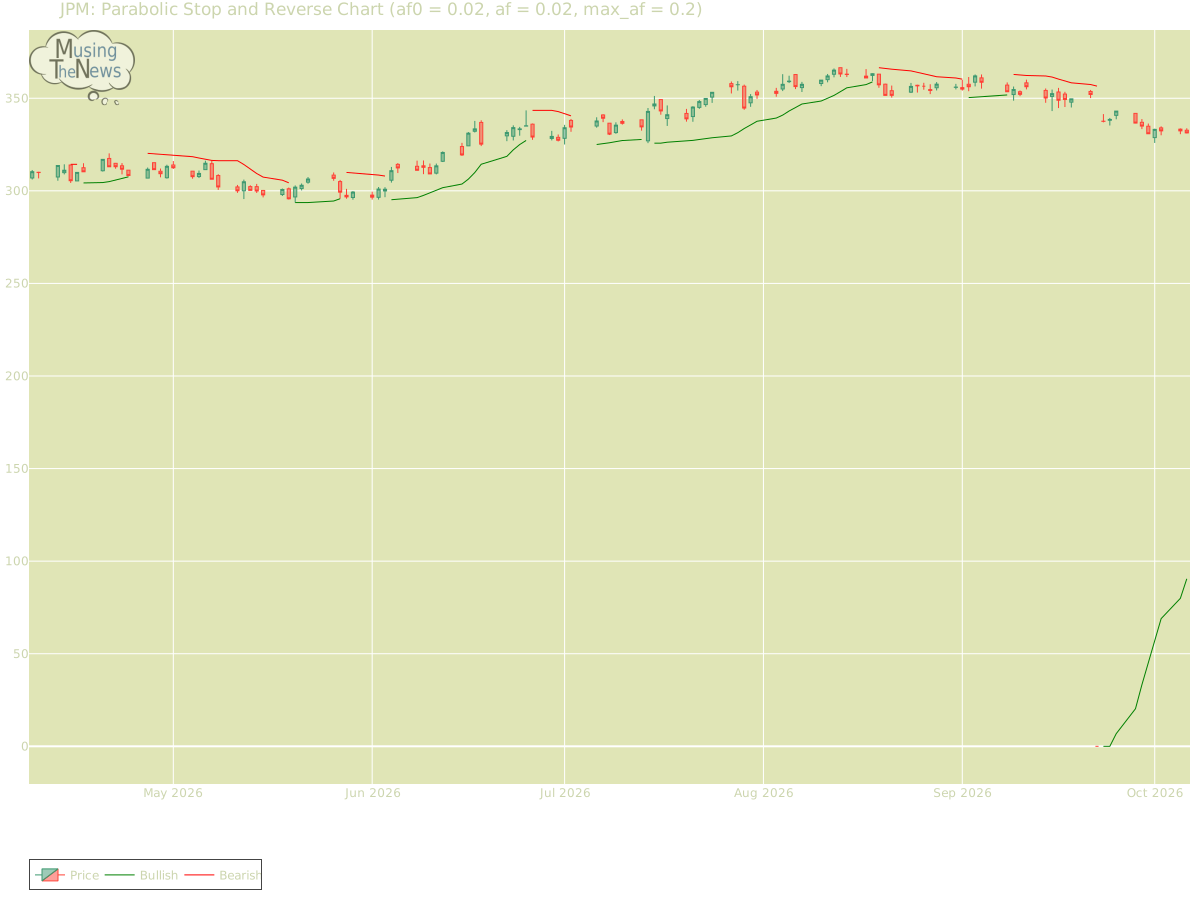
The PSAR continues its bullish outlook, reinforcing a crucial support level that may help sustain the current upward trend. This support suggests that the market is likely ...
By MusingTheNews
Updated 2026-10-07 23:26:29
Overall Technical outlook
Price Summary
JPMorgan Chase & Co.'s stock opened at 332.73 on 2026-10-06, surged to 333.79, hit a low of 330.93, and closed up -0.44% at 331.28, with 6286800 shares traded. The stock reached its highest price of 365.18 and lowest price of 0.0 over the last 52 weeks.
Technicals
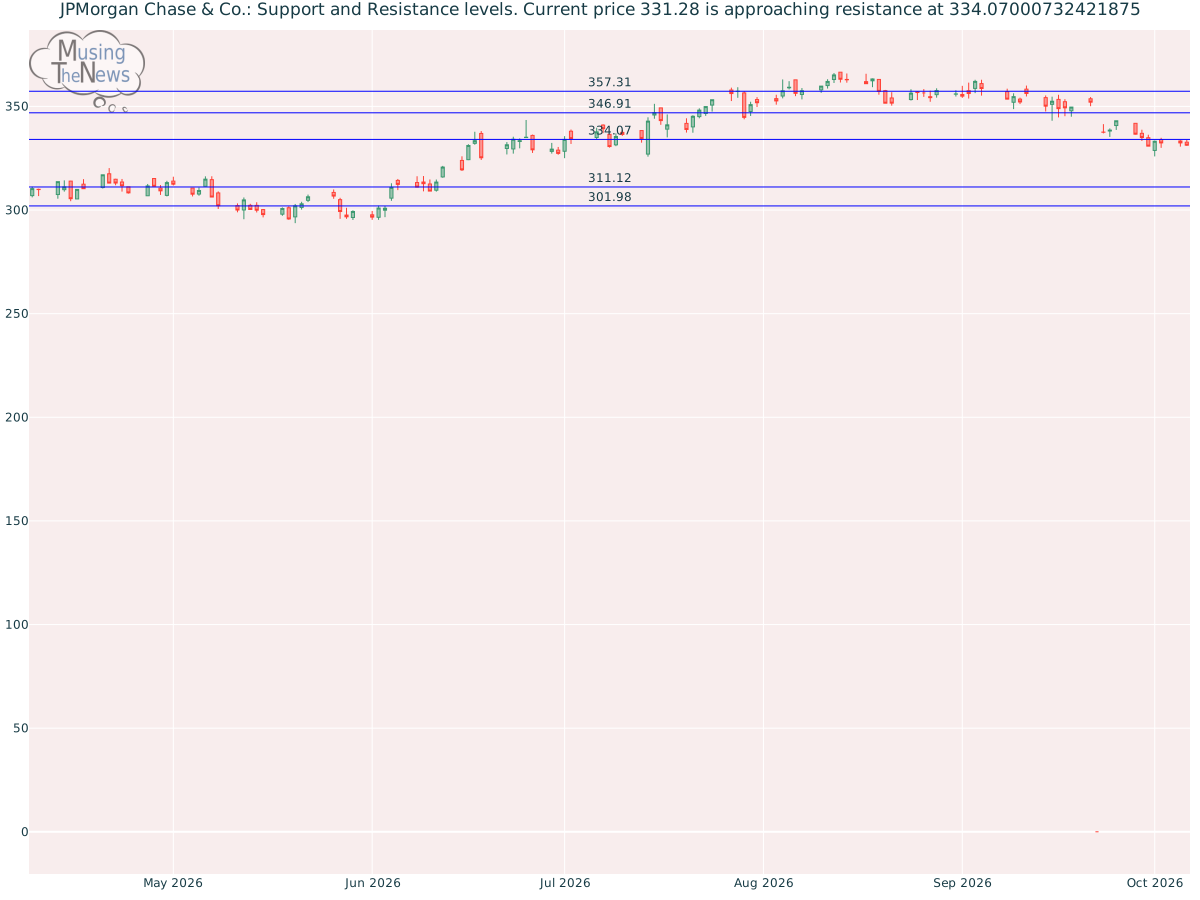
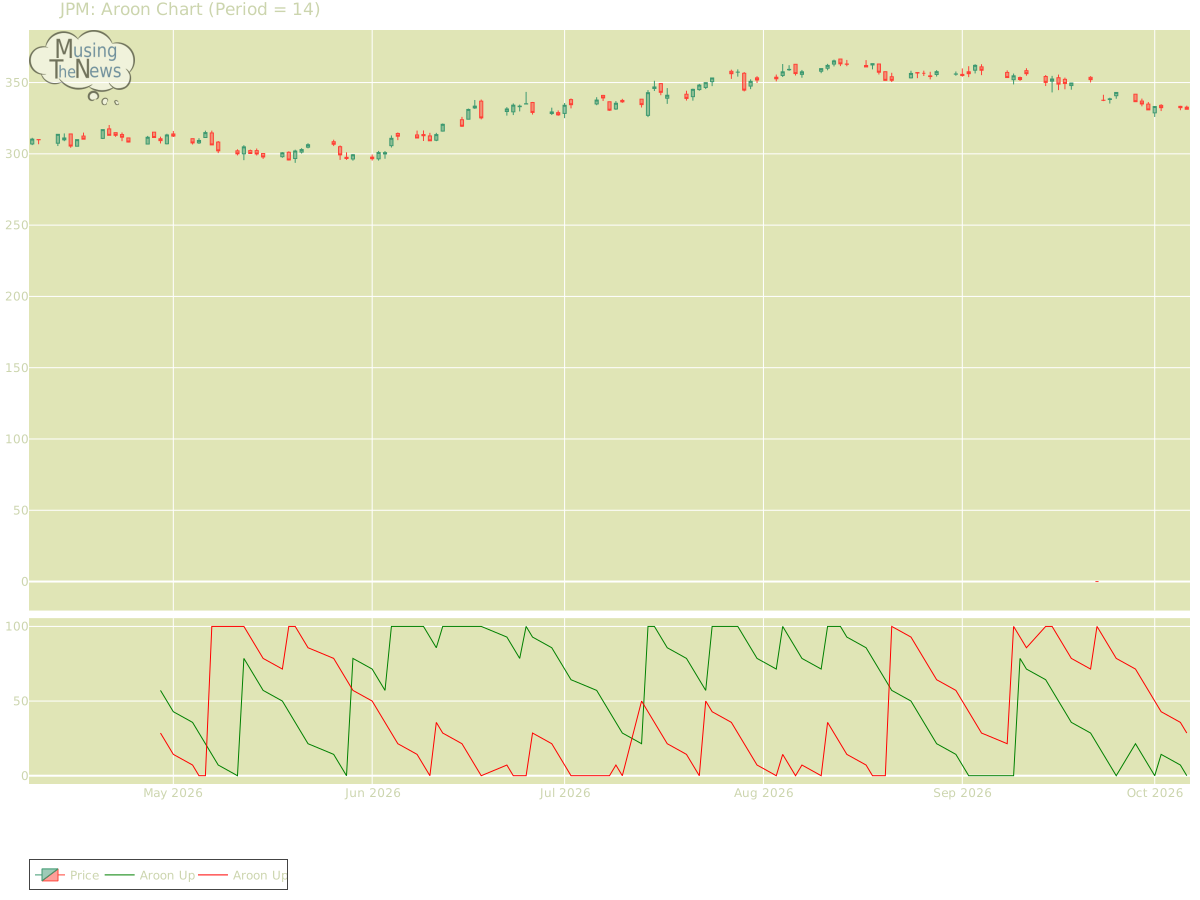
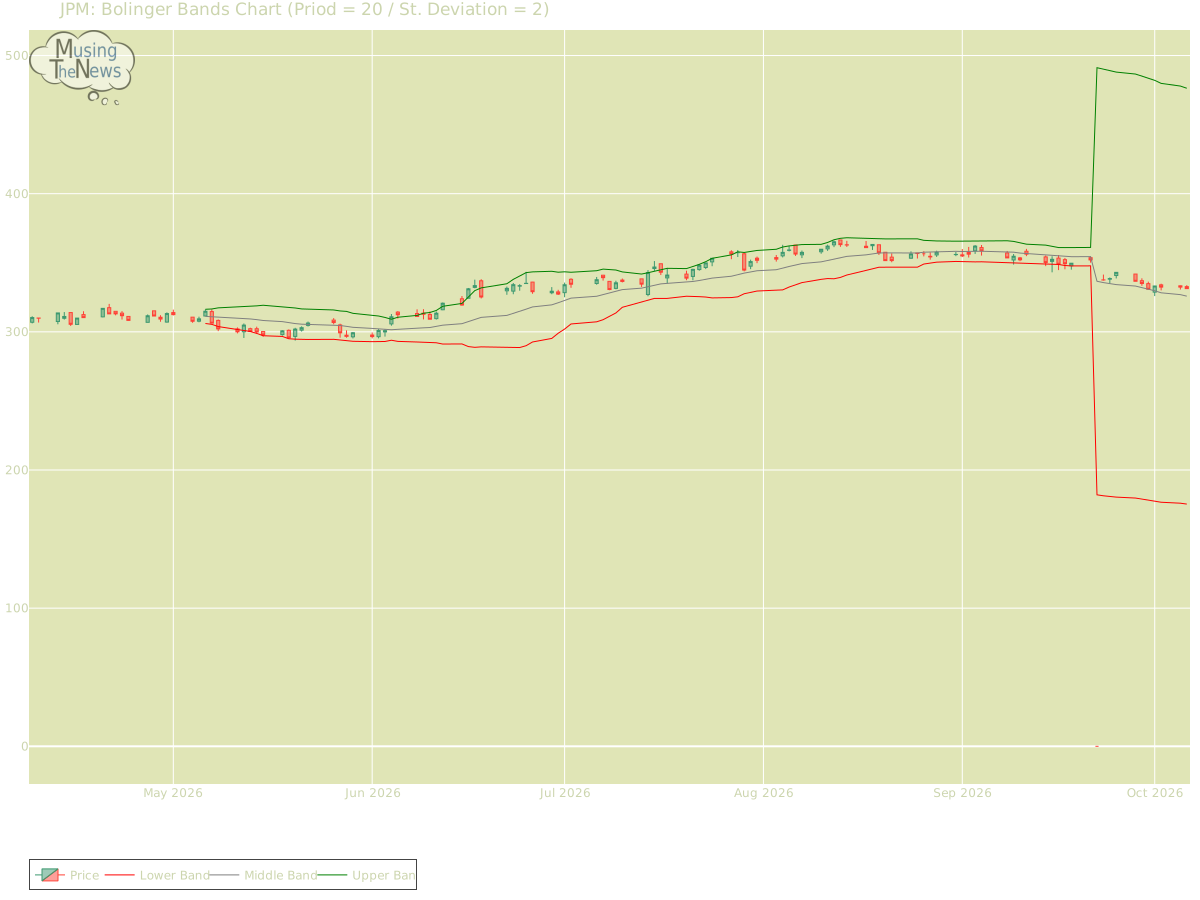
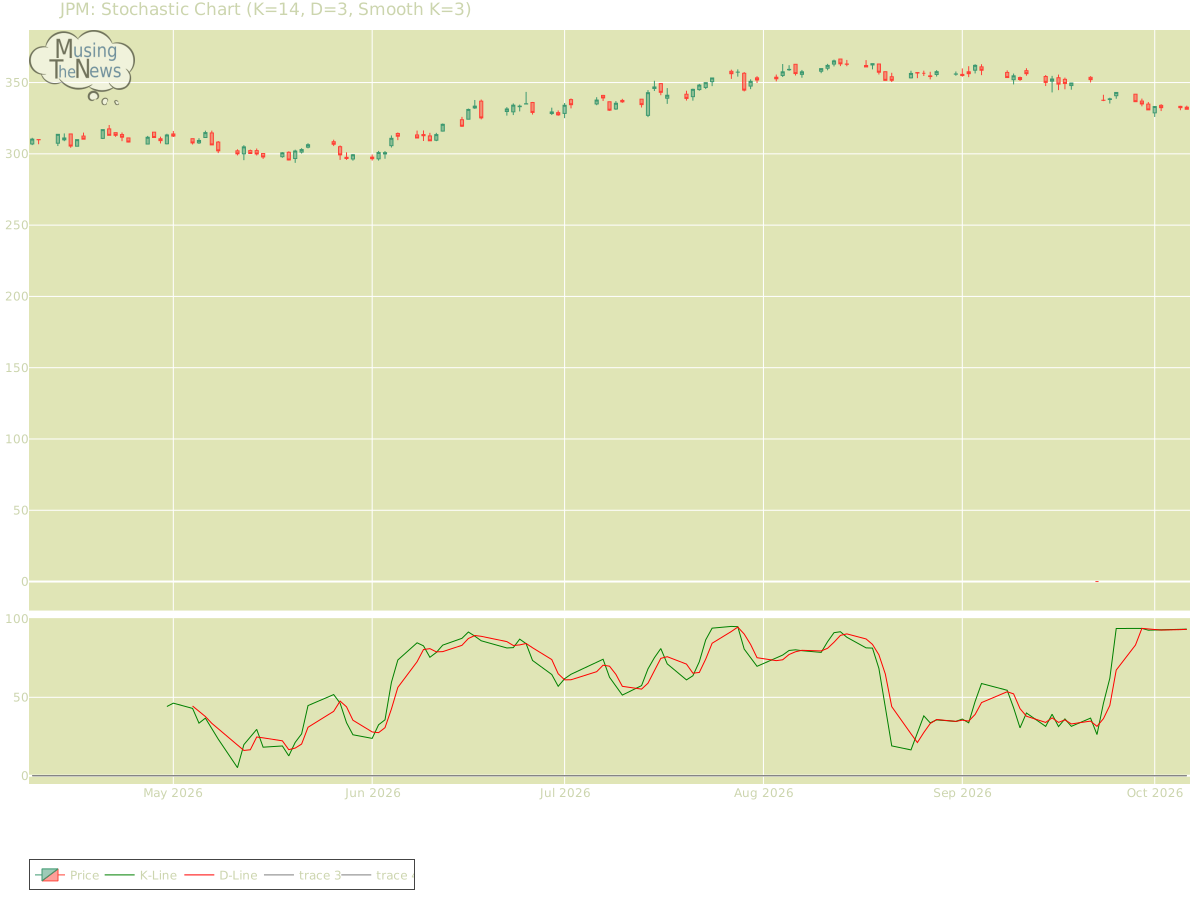
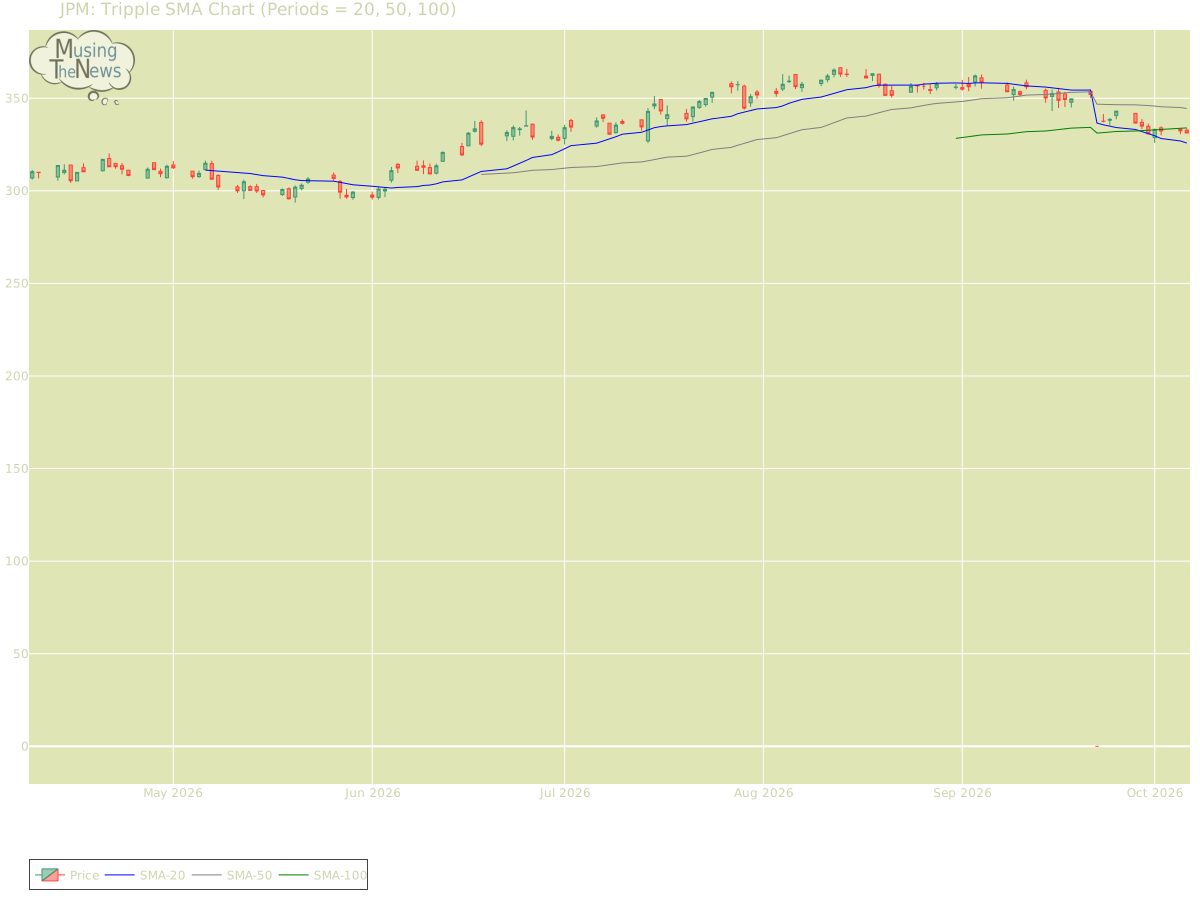
Support and Resistance: At 331.28, the price for JPM is supported at 311.12 and resisted at 334.07. This indicates a trading range where 311.12 serves as a support level, potentially preventing further decline, while 334.07 could limit upward movement.Support/Resistance for JPMAroon: The AROON is neutral, showing no definitive signals of a trend either upward or downward. This neutral stance indicates a period of market indecision, where the direction is unclear.Aroon chart for JPMorgan Chase & Co.Bol. Bands: The current state of the BOLL BANDS is neutral, providing no clear signals for either an upward or downward movement. This indicates that the market may be in a state of equilibrium, with no strong momentum in either direction.Bolinger Bands chart for JPMorgan Chase & Co.Parabolic SAR: The PSAR continues its bullish outlook, reinforcing a crucial support level that may help sustain the current upward trend. This support suggests that the market is likely to continue climbing, with the bullish momentum remaining strong.Parabolic Stop and Reverse chart for JPMorgan Chase & Co.Stochastic: The stochastic indicator is in a bullish position, with the K-line above both the D-line and the 80 level. This configuration suggests strong upward momentum, indicating that the market may continue its positive trend. Traders might view this as a sign of ongoing strength in the market.Stochastic chart for JPMorgan Chase & Co.Tripple Moving Agerage: The current state of the Tripple MOVING AVG is neutral, providing no clear signals for either an upward or downward movement. This indicates that the market may be in a state of equilibrium, with no strong momentum in either direction.Tripple SMA chart for JPMorgan Chase & Co. When analyzing a company, its fundamentals—such as earnings, management efficiency, and strategic initiatives—must be considered alongside technical data. The context of the industry in which the company operates also plays a key role, as market trends and competitive dynamics can significantly impact performance. By taking a comprehensive approach, combining both fundamental and technical analysis, one can gain a deeper understanding of the company's potential for growth or risk.