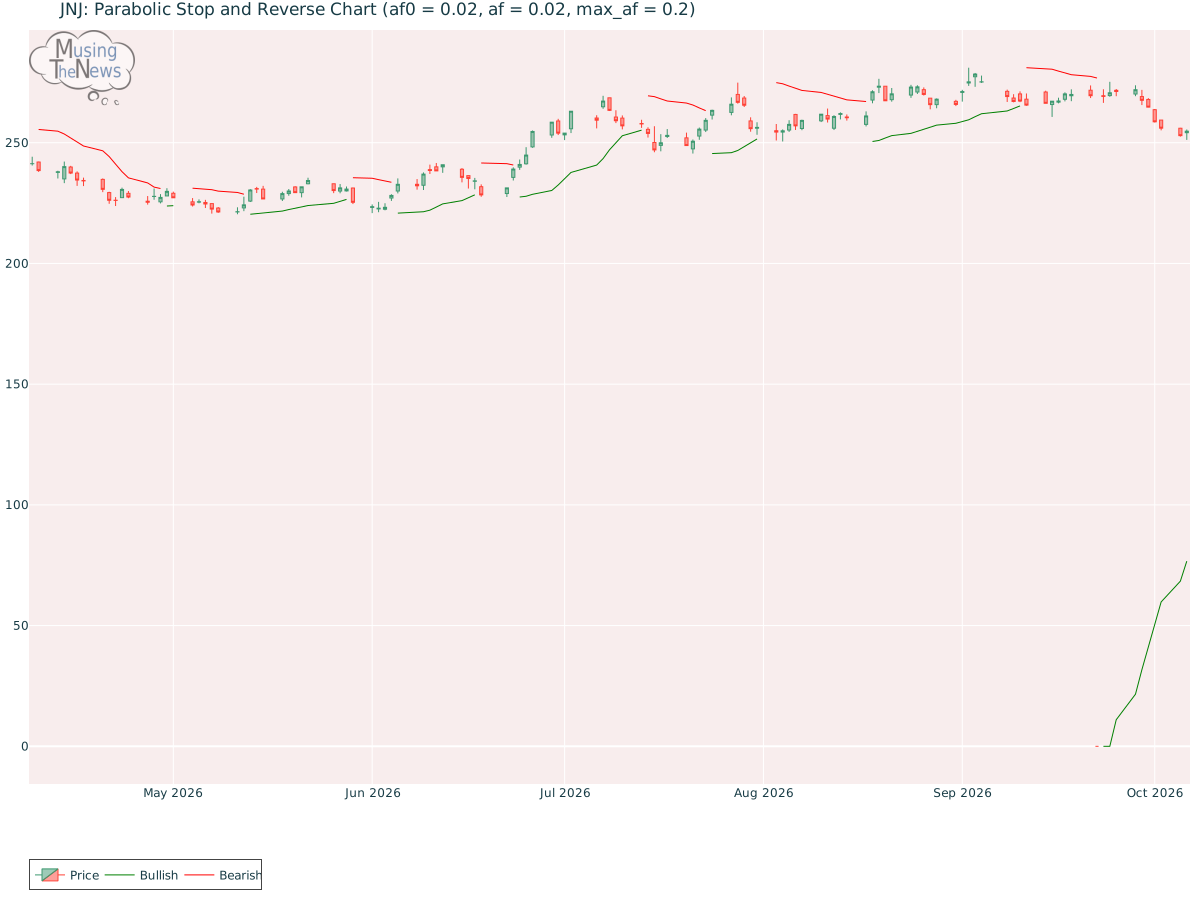
The PSAR continues its bullish outlook, establishing a support level that could help sustain the current upward trend. This level of support may act as a cushion against po...
By MusingTheNews
Updated 2026-10-07 23:26:28
Overall Technical outlook
Price Summary
On 2026-10-06, Johnson & Johnson's stock opened at 254.15, reached 255.48, hit a low of 251.17, and rose 0.25% to close at 254.78, with 5661000 shares traded. In the last 52 weeks, the stock's top price was 278.43 and the bottom price was 0.0.
Technicals
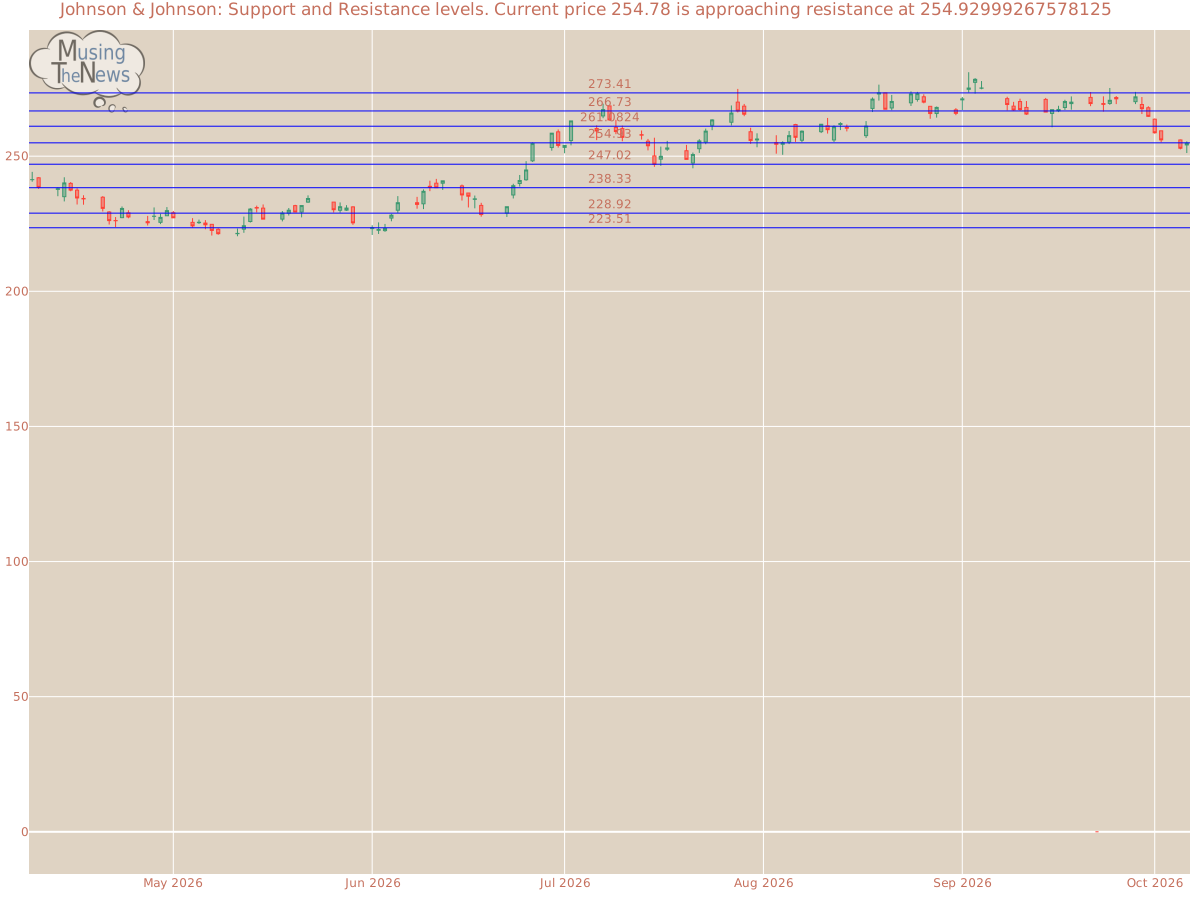
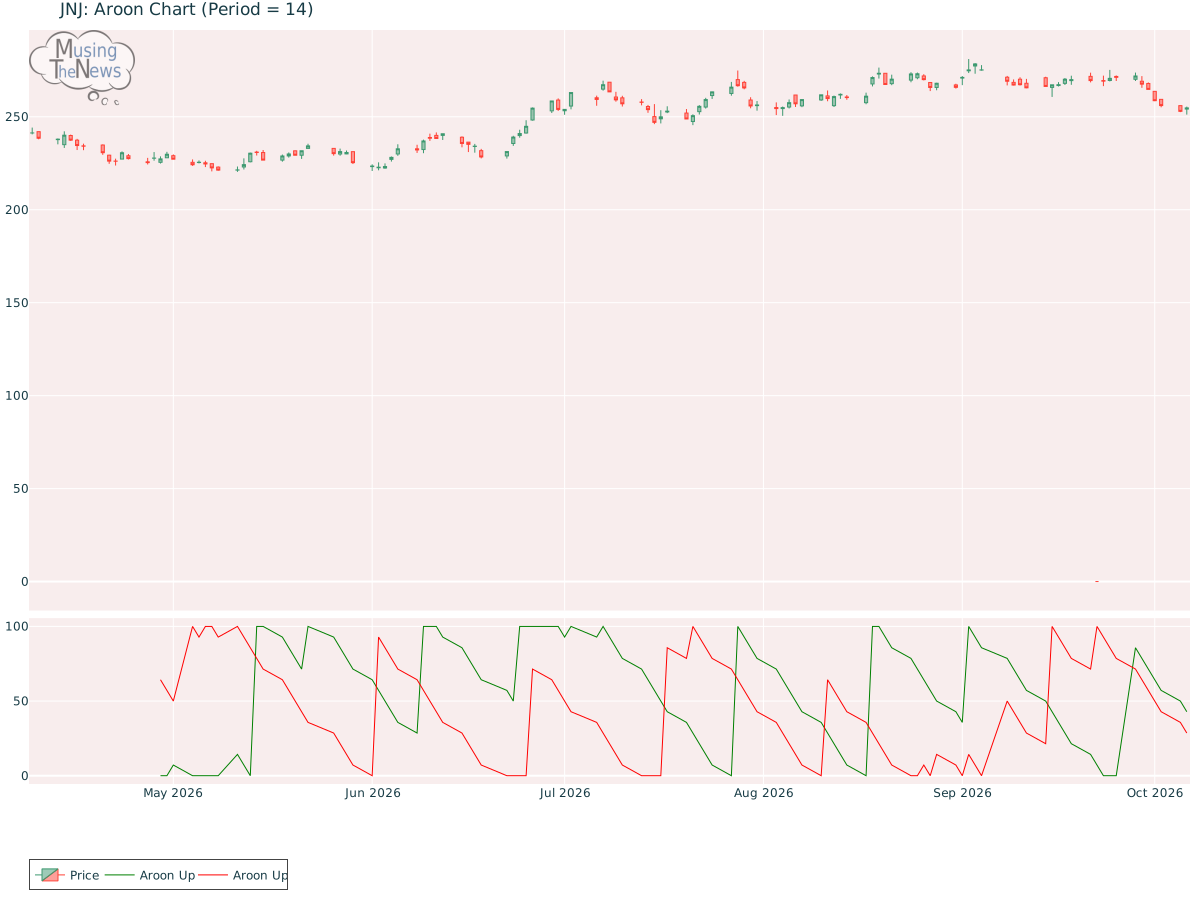
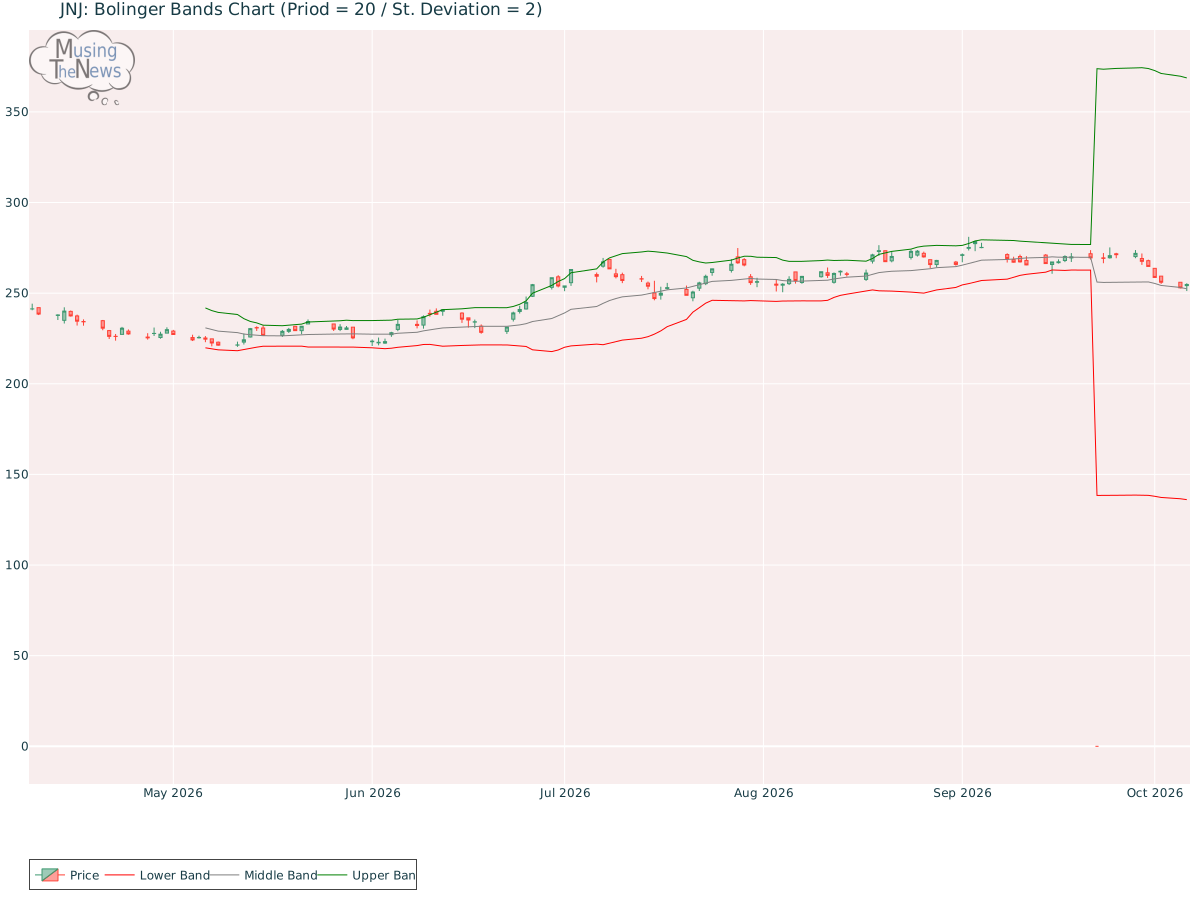
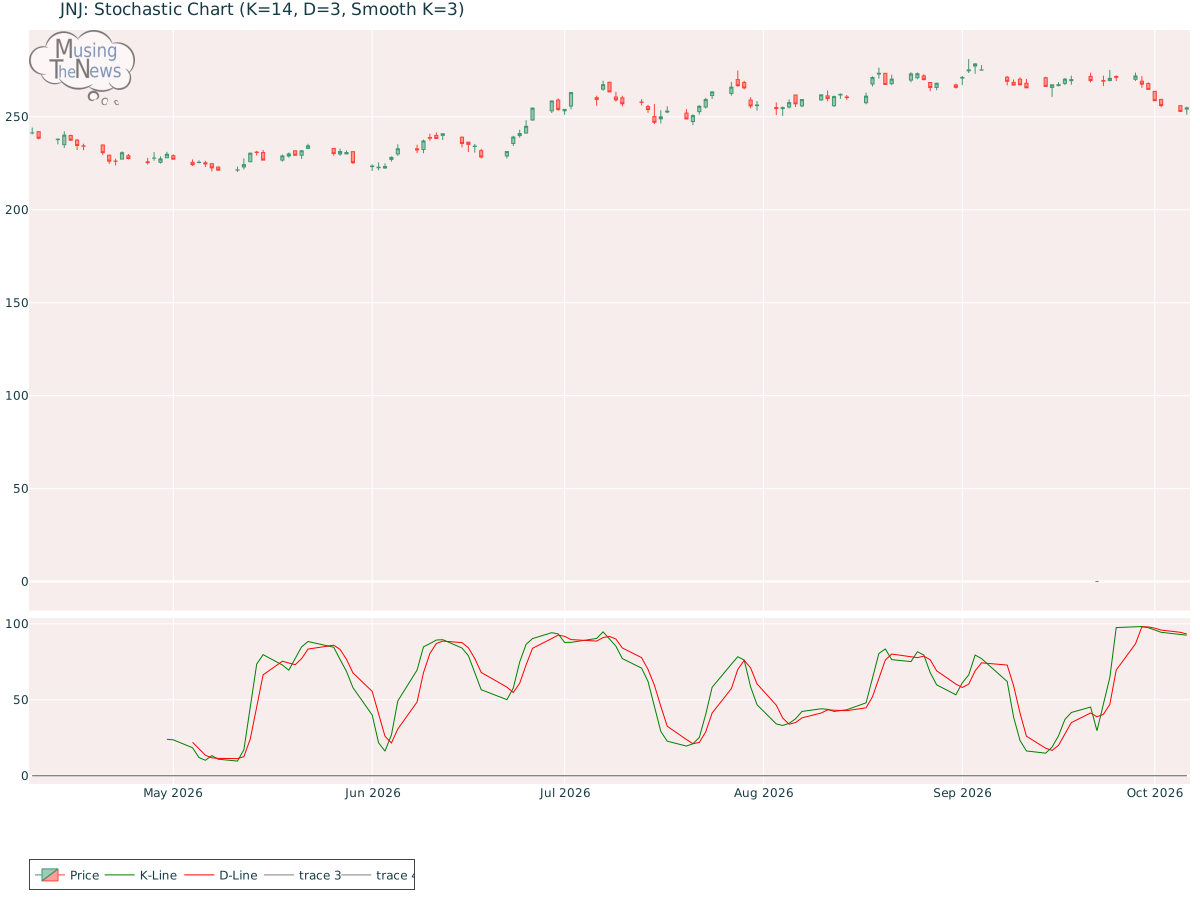
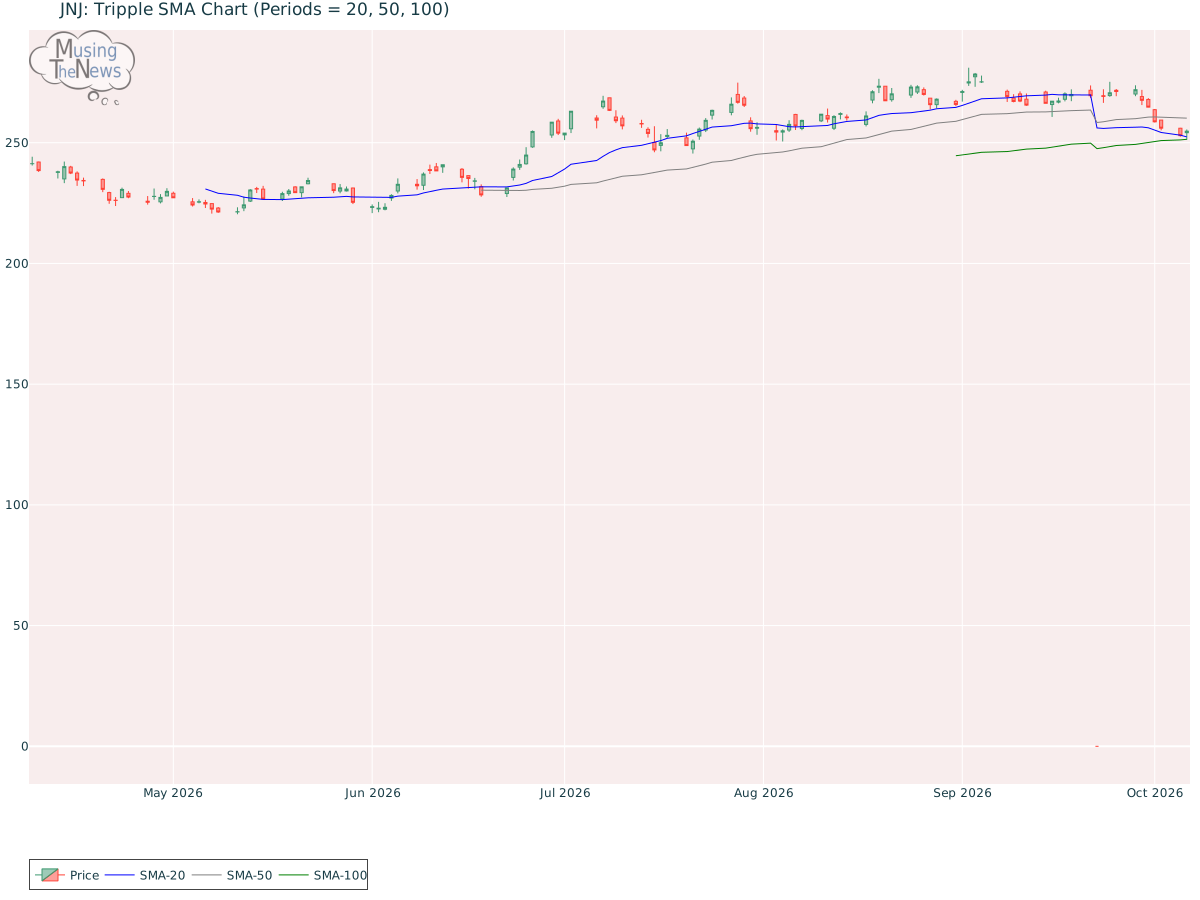
Support and Resistance: The price of 254.78 is supported at 247.02 and encounters resistance at 254.93. This suggests key levels where the price might find stability, with 247.02 providing a base and 254.93 acting as an upper boundary for JNJ.Support/Resistance for JNJAroon: The current state of the AROON is neutral, offering no clear signals of movement in either direction. This suggests a potential pause in market activity, with no strong trend emerging at the moment.Aroon chart for Johnson & JohnsonBol. Bands: The BOLL BANDS is currently in a neutral position for Johnson & Johnson, offering no clear guidance on whether the market is likely to move up or down. This neutral stance suggests that further observation may be necessary before a trend becomes apparent.Bolinger Bands chart for Johnson & JohnsonParabolic SAR: The PSAR continues its bullish outlook, establishing a support level that could help sustain the current upward trend. This level of support may act as a cushion against potential downturns, indicating continued strength in the market's bullish momentum for JNJ.Parabolic Stop and Reverse chart for Johnson & JohnsonStochastic: The K-line has dipped below the D-line on the stochastic indicator, even as it remains above 80, signaling the potential start of a bearish price move. This setup suggests that the market may be entering a period of weakening momentum, possibly leading to a decline. Investors should monitor the situation for additional bearish signals.Stochastic chart for Johnson & JohnsonTripple Moving Agerage: The current state of the Tripple MOVING AVG is neutral, offering no clear signals of movement in either direction. This suggests a potential pause in market activity, with no strong trend emerging at the moment.Tripple SMA chart for Johnson & Johnson A thorough analysis of a company involves looking at both its fundamentals and technical data. The fundamentals, including revenue, profitability, and management quality, offer insight into the company's long-term value. Additionally, understanding the broader industry context, such as market competition and regulatory challenges, helps to better interpret the company's stock performance. By combining both fundamental and technical analysis, you can derive more meaningful inferences about the company's future prospects.