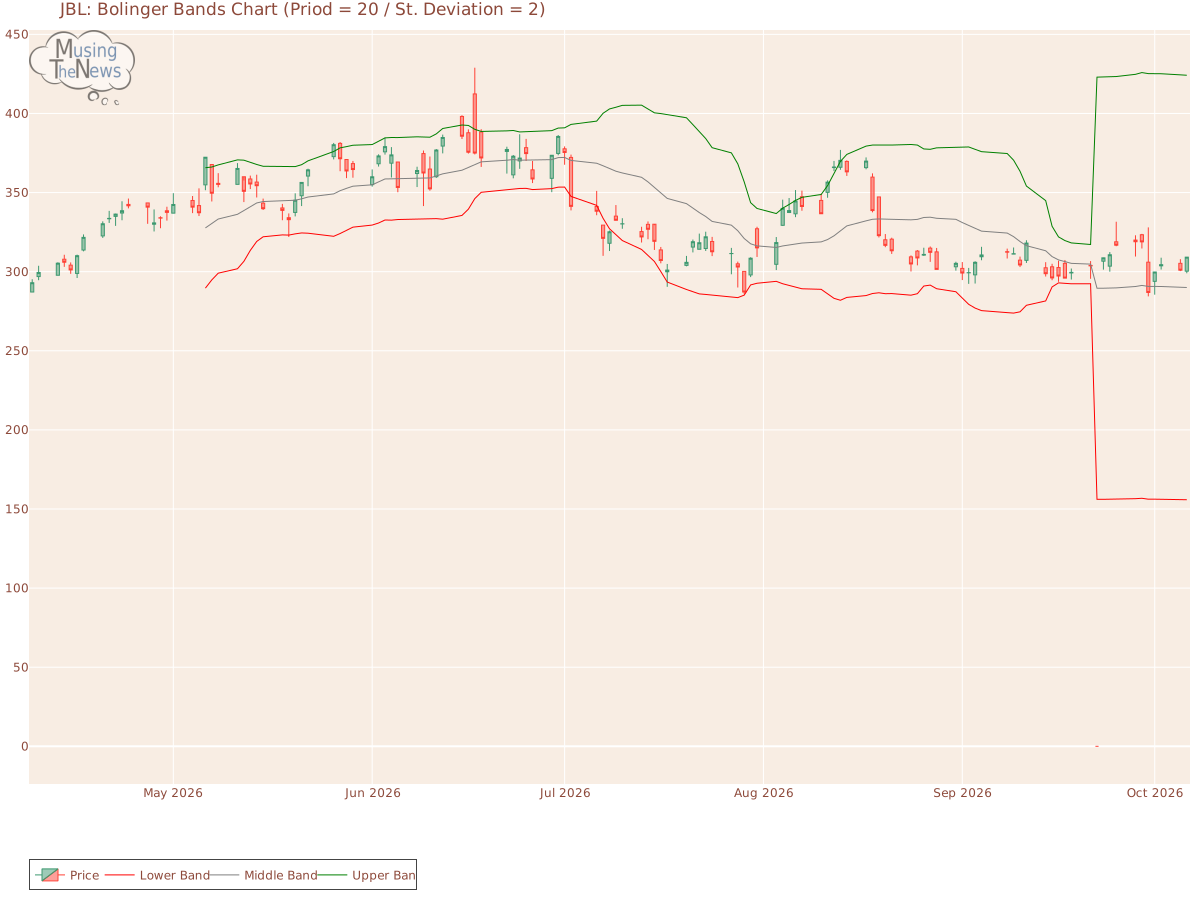
The BOLL BANDS is showing a neutral reading, with no clear direction indicated for upward or downward movement. This neutral position suggests a possible period of consolid...
By MusingTheNews
Updated 2026-10-07 23:26:28
Overall Technical outlook
Price Summary
Jabil Inc.'s stock spiked 2.95% today, marking a phenomenal performance in the market. On 2026-10-06, Jabil Inc.'s stock began at 300.32, peaked at 309.25, declined to 299.0, and ended the day 2.95% higher at 309.19, with 1222300 shares traded. The stock's highest value over the last 52 weeks is 385.63, and the lowest value is 0.0.
Technicals
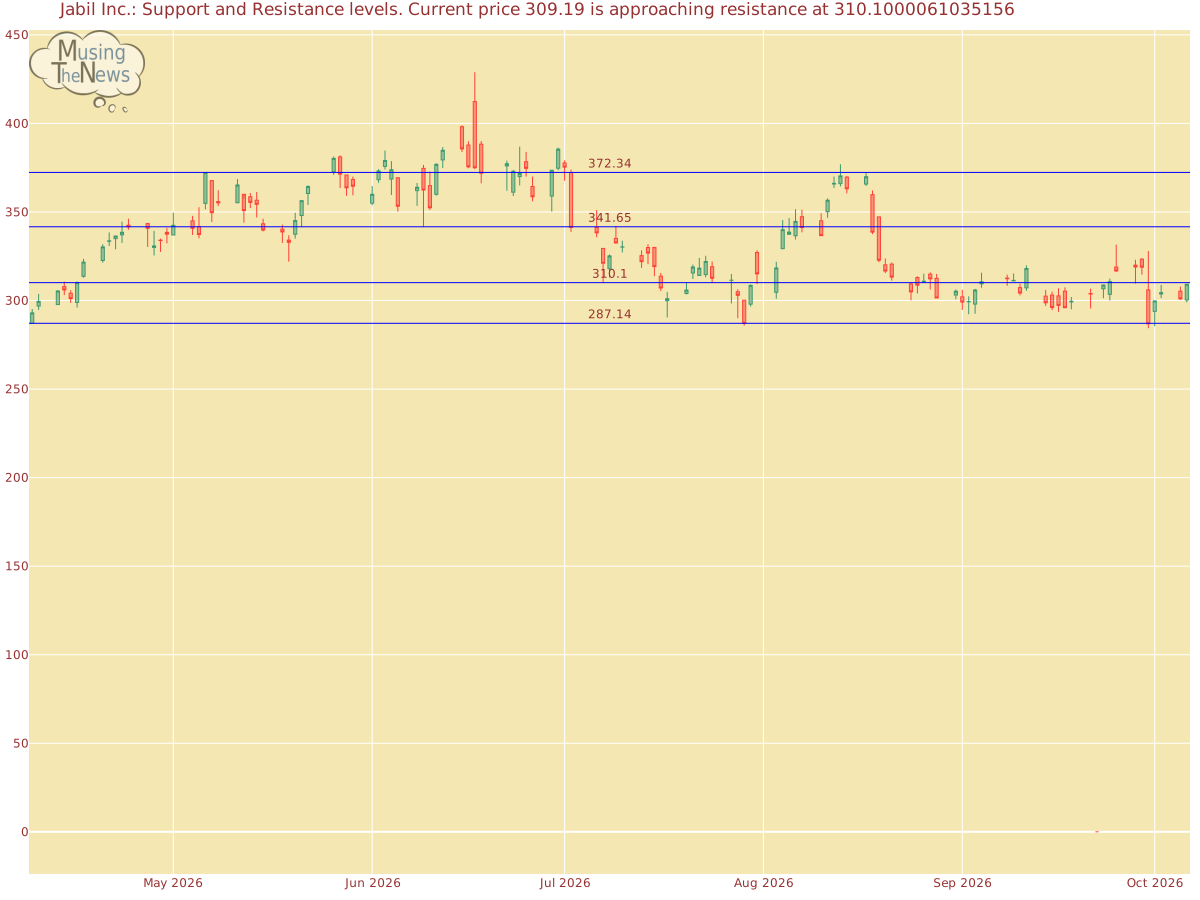
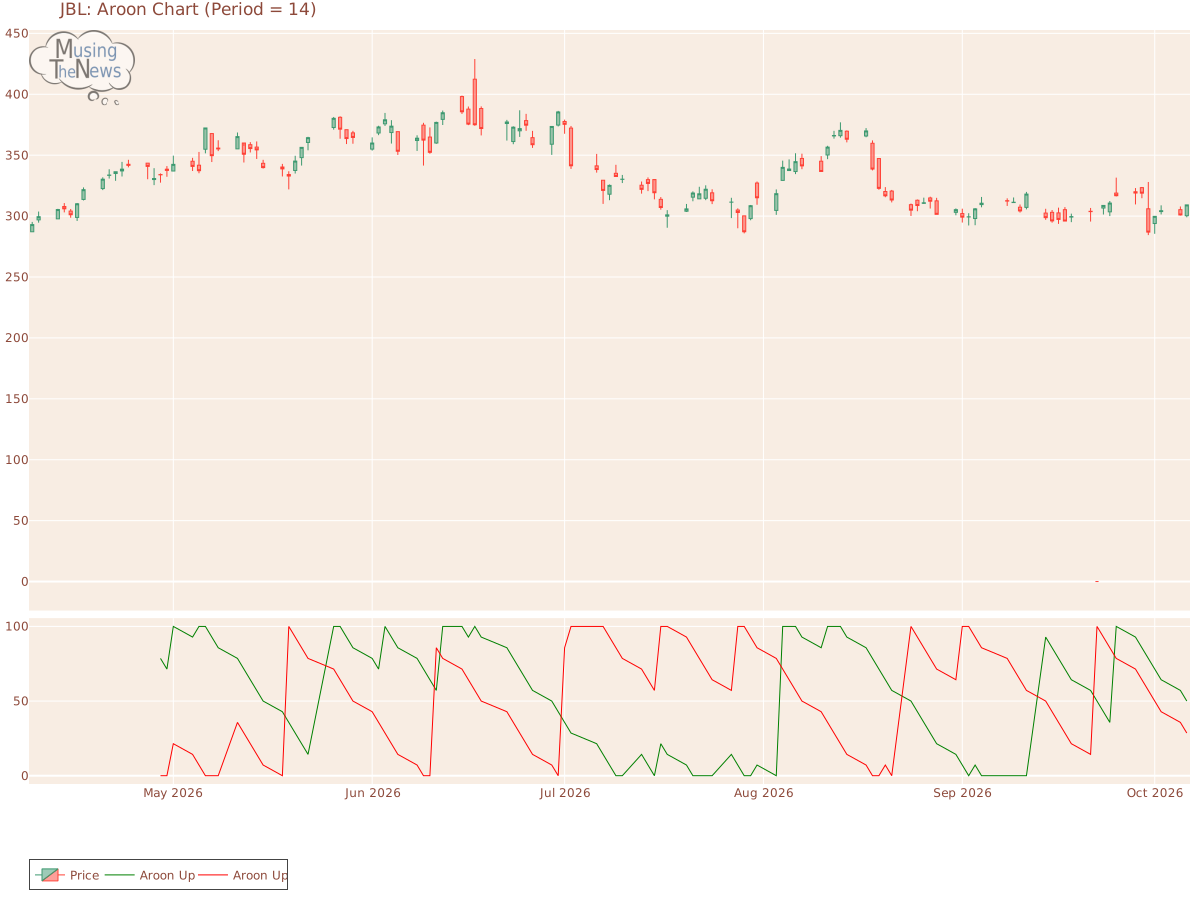
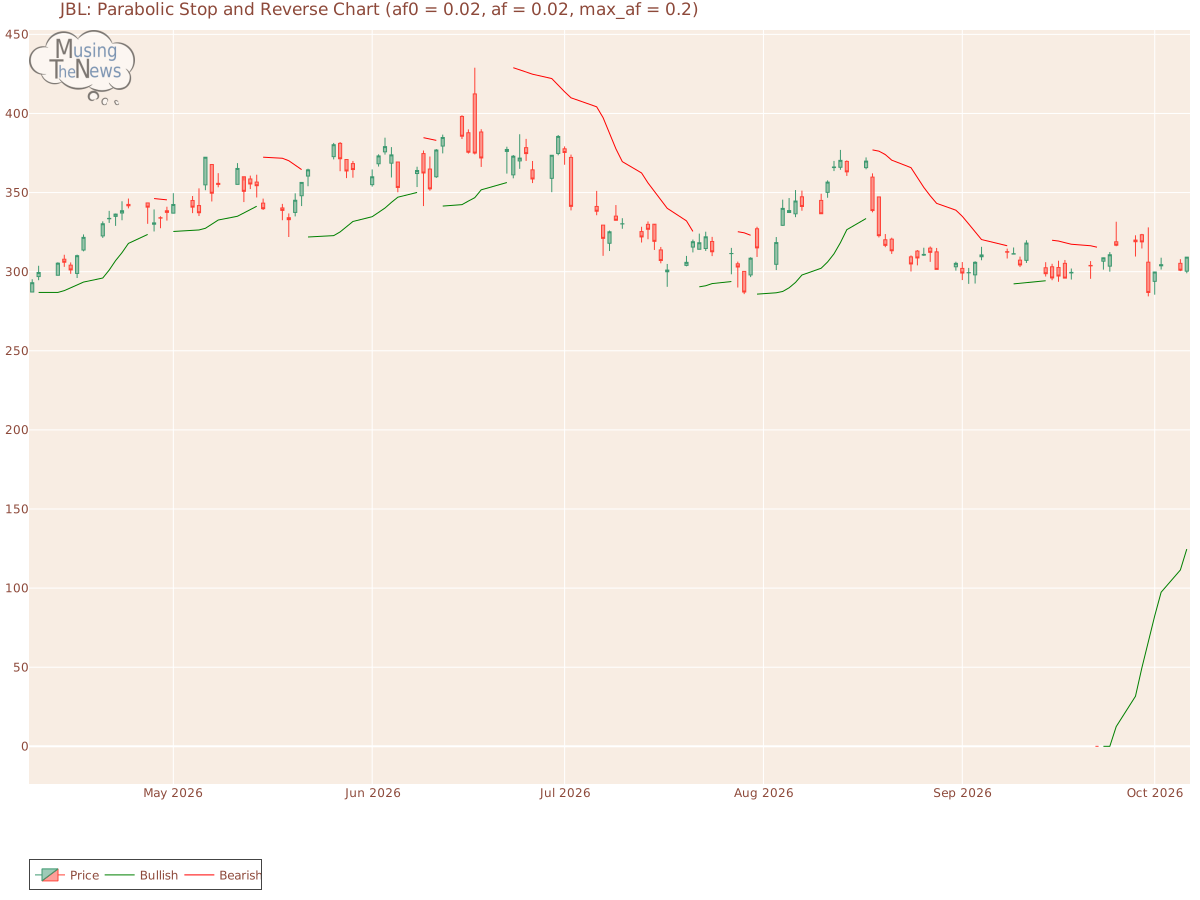
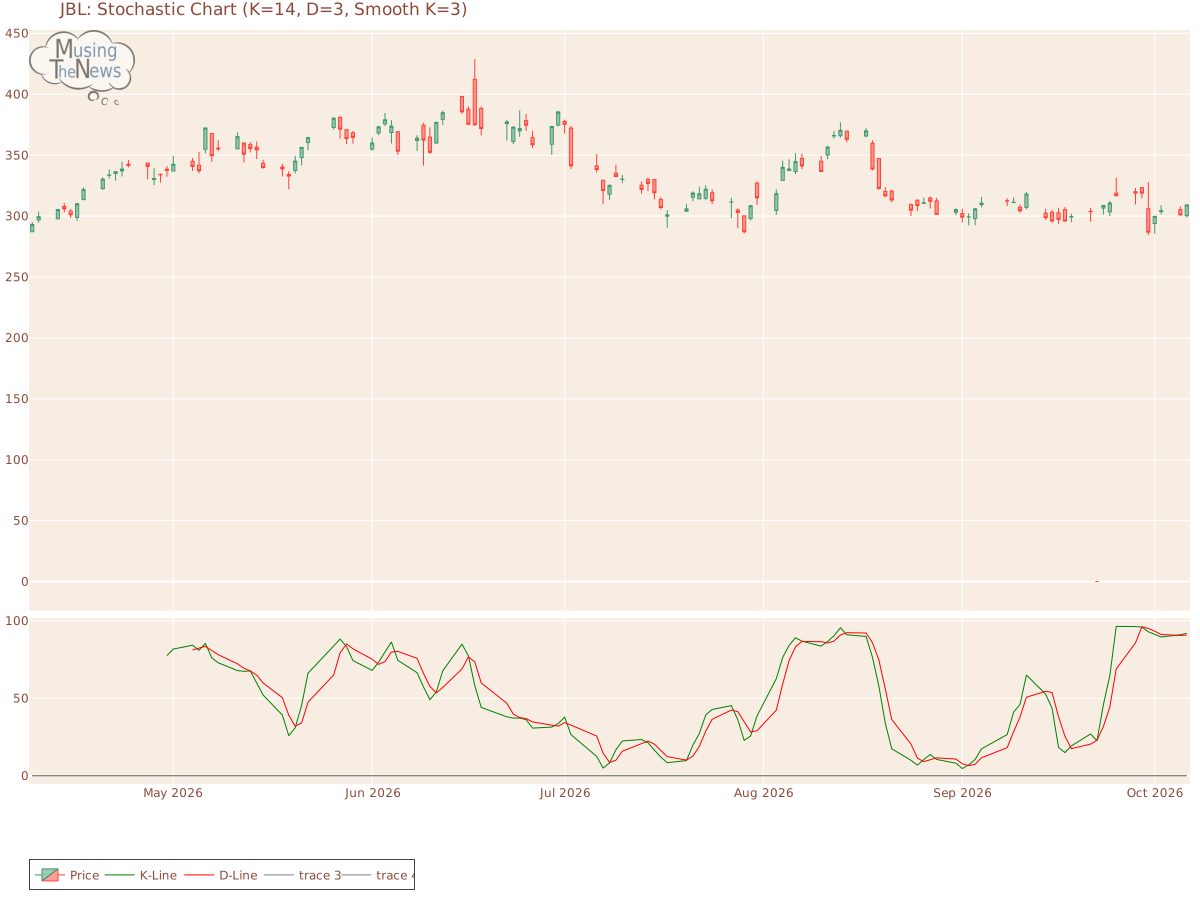
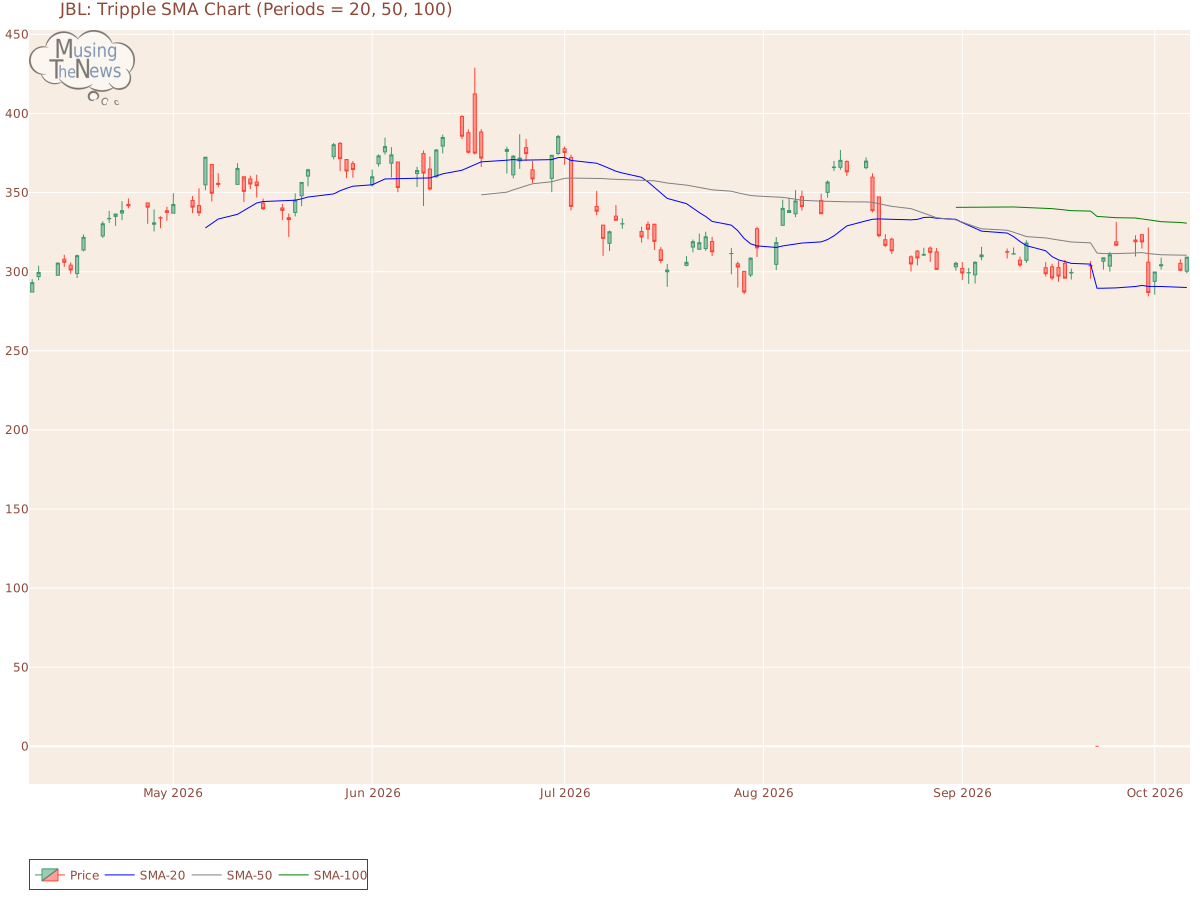
Support and Resistance: The price for JBL at 309.19 finds support at 287.14 and resistance at 310.1. This suggests a trading range, where 287.14 serves as a support level and 310.1 acts as a resistance point, potentially capping further gains.Support/Resistance for JBLAroon: The AROON is showing a neutral reading, with no clear direction indicated for upward or downward movement. This neutral position suggests a possible period of consolidation.Aroon chart for Jabil Inc.Bol. Bands: The BOLL BANDS is showing a neutral reading, with no clear direction indicated for upward or downward movement. This neutral position suggests a possible period of consolidation.Bolinger Bands chart for Jabil Inc.Parabolic SAR: The PSAR for JBL continues to be bullish, establishing a crucial support level that may help maintain the current upward trend. This level of support suggests that the market is poised to continue its positive trajectory, offering a foundation for further growth.Parabolic Stop and Reverse chart for Jabil Inc.Stochastic: The stochastic indicator is in a bullish mode, with the K-line crossing above the D-line and the 80 level for JBL. This alignment suggests strong upward momentum, indicating that the market may continue to trend higher. Investors could interpret this as a positive sign of sustained market growth.Stochastic chart for Jabil Inc.Tripple Moving Agerage: The alignment of the 20-50-100 period moving averages suggests a bullish trend, but the slopes of the faster averages hint at a potential reversal. The weakening signals from these shorter-term averages indicate that the current upward momentum may be fading, suggesting that a change in direction could be near.Tripple SMA chart for Jabil Inc. Before focusing on a company's technical data, such as stock price movements, it's essential to analyze its fundamentals. These include factors like profitability, cash flow, and debt management. Additionally, considering the broader industry landscape—including market trends, competition, and regulatory changes—offers deeper insights. This comprehensive approach allows for a more meaningful interpretation of the company's technical indicators, providing a clearer picture of its financial health and future prospects.