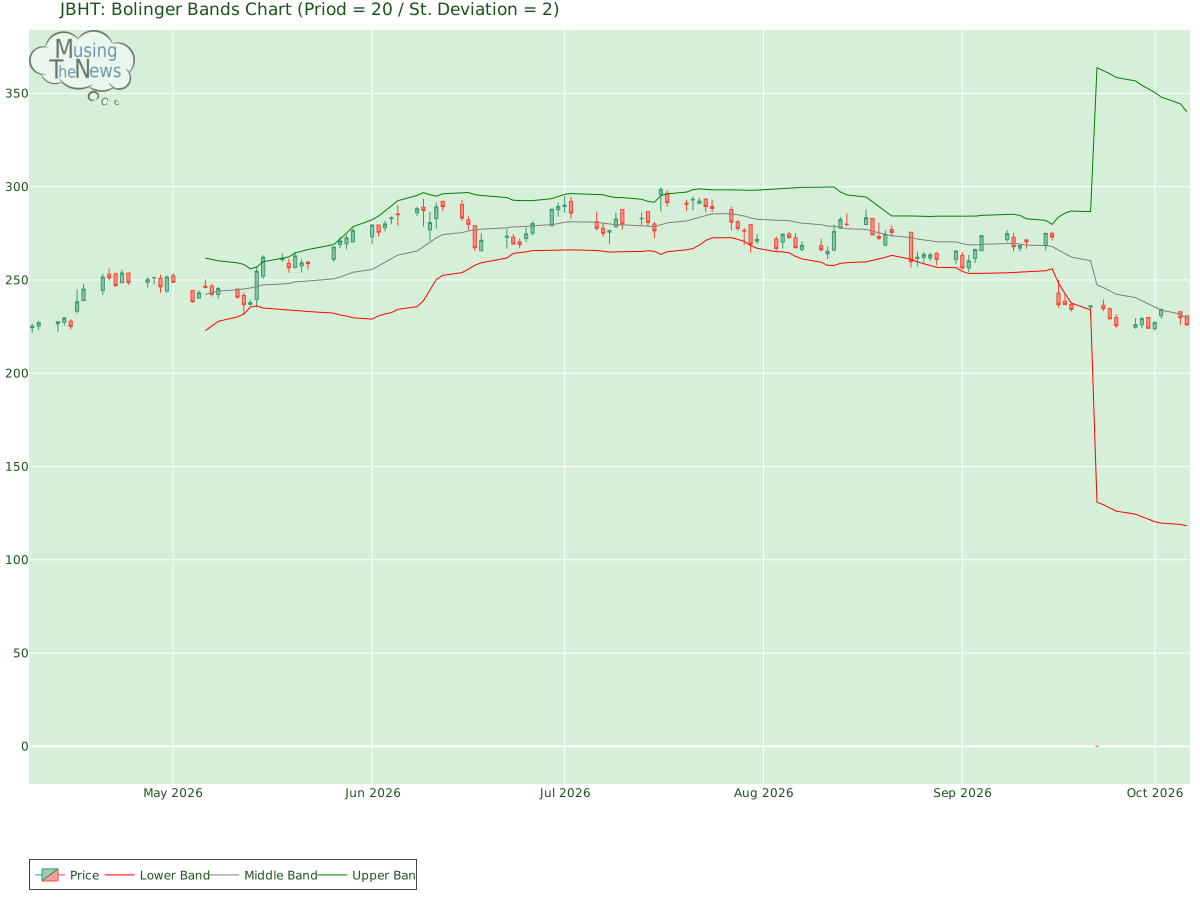
The BOLL BANDS is in a neutral stance, not pointing to a clear trend in either direction. This suggests that the market may be lacking strong momentum, making it difficult ...
By MusingTheNews
Updated 2026-10-07 23:26:28
Overall Technical outlook
Price Summary
J.B. Hunt Transport Services, Inc. had a lousy day at the stock market, and its shares fell -2.13%. J.B. Hunt Transport Services, Inc.'s stock began trading at 230.85 on 2026-10-06, soared to 230.95, dipped to 225.27, and finished the day -2.13% down at 225.93, with 651700 shares exchanged. Throughout the 52-week period, the stock hit a high of 298.41 and a low of 0.0.
Technicals
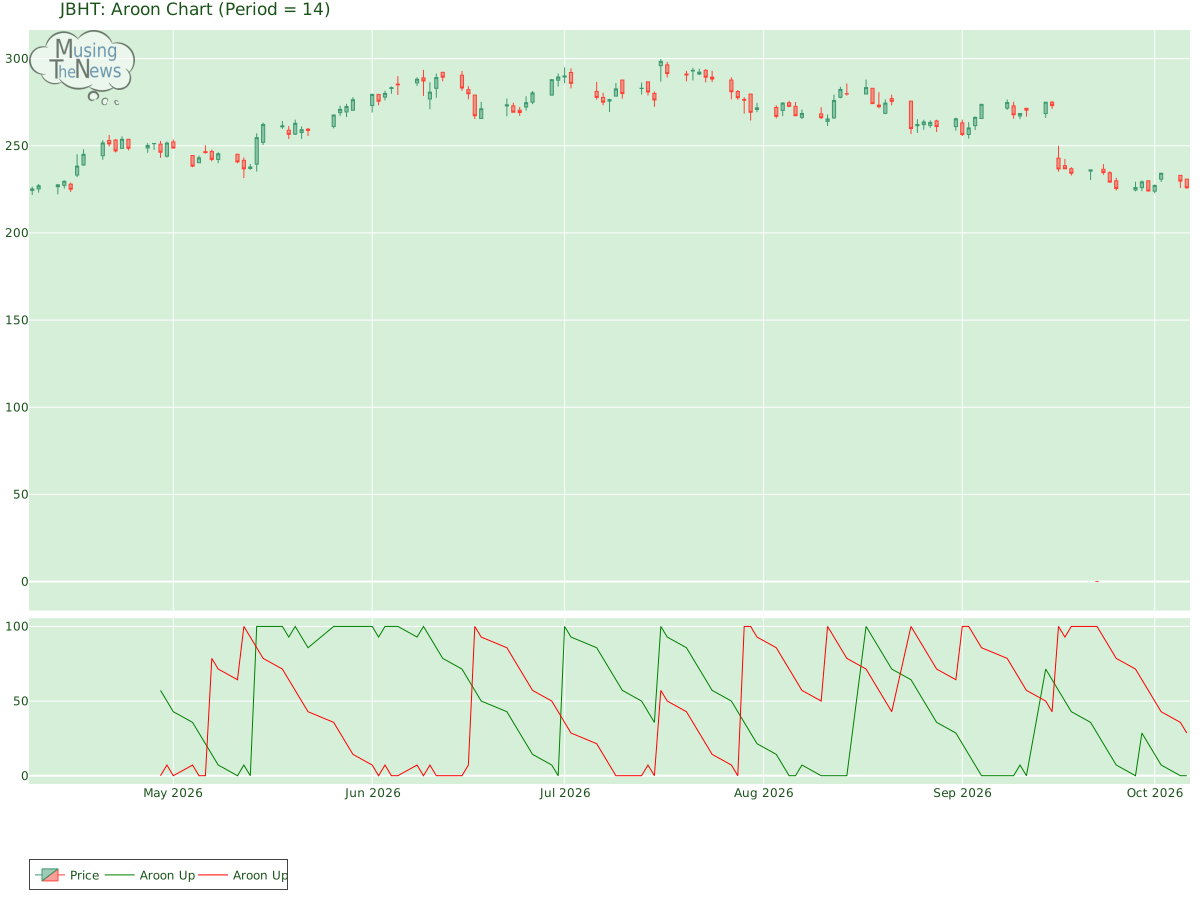
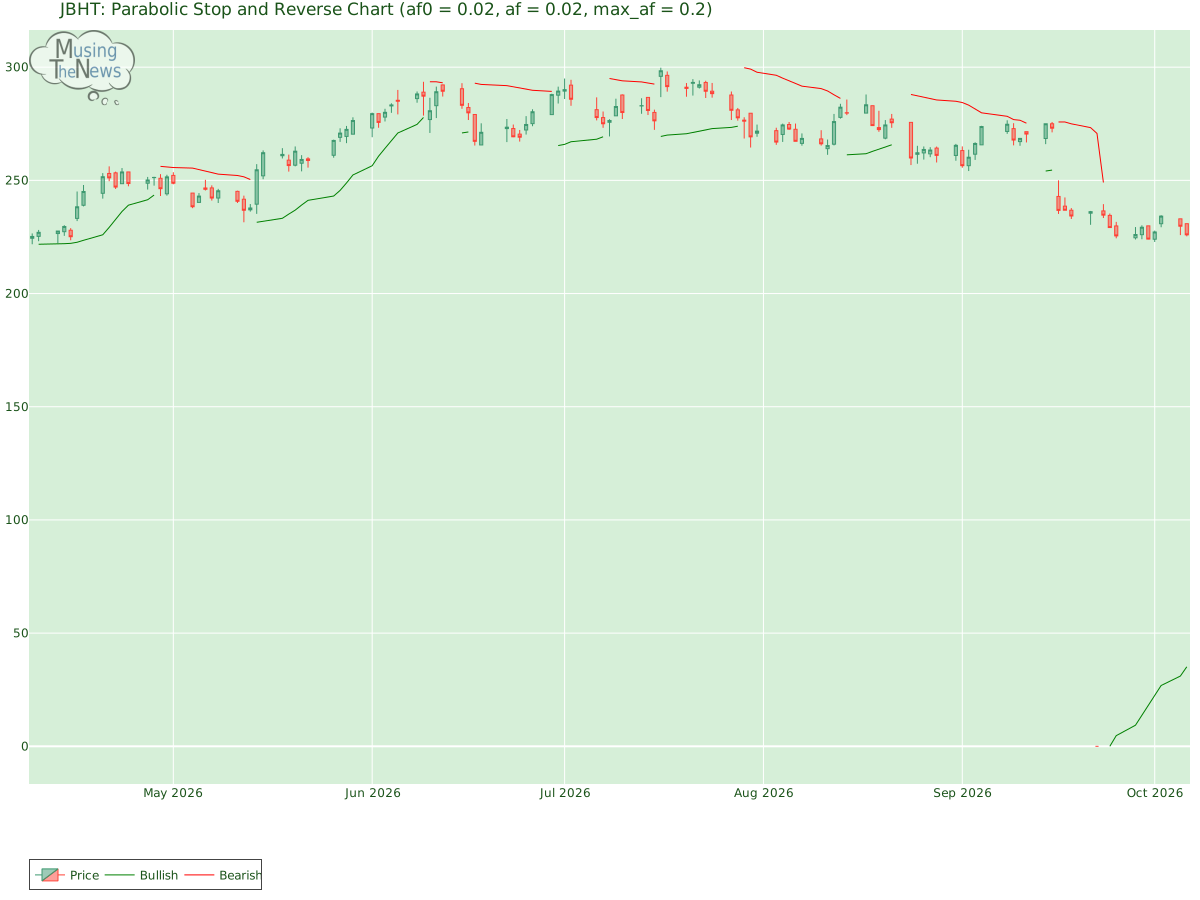
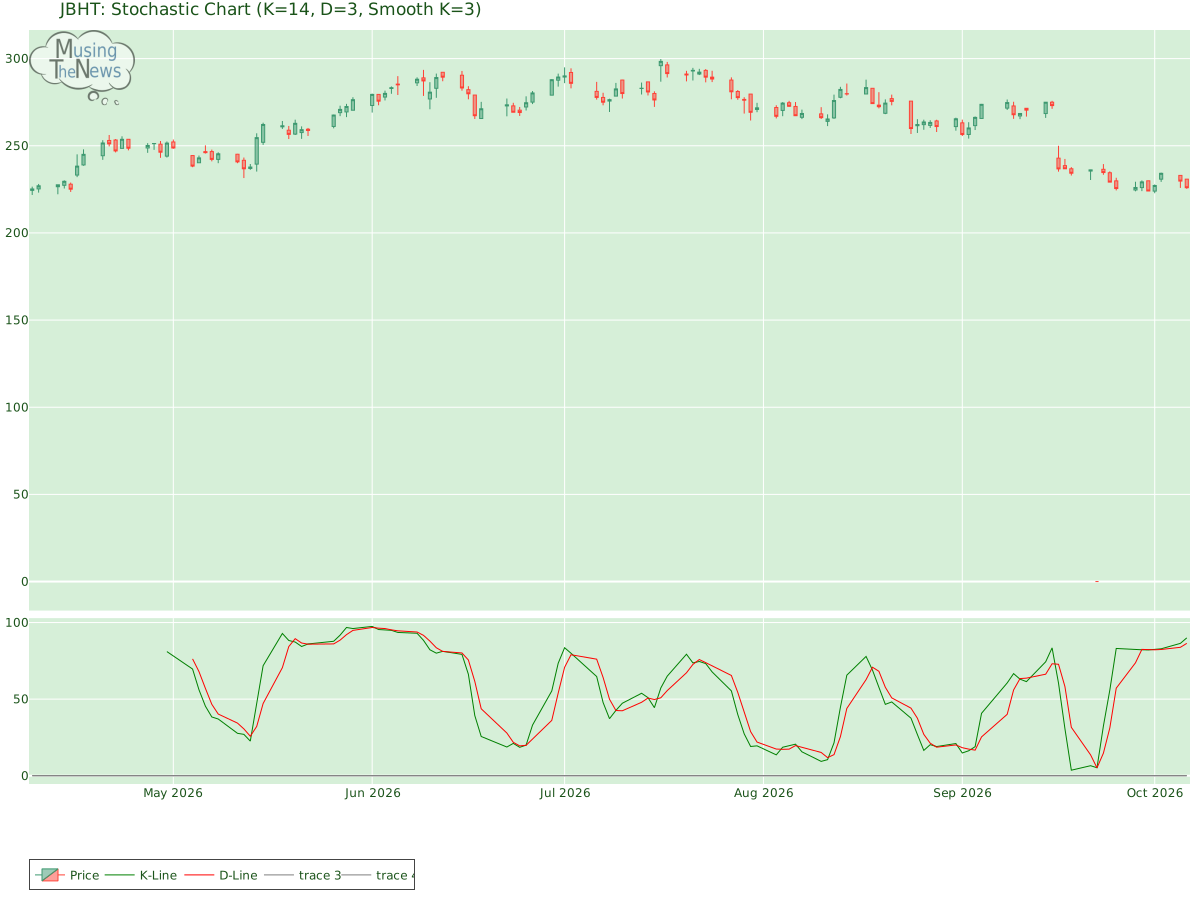
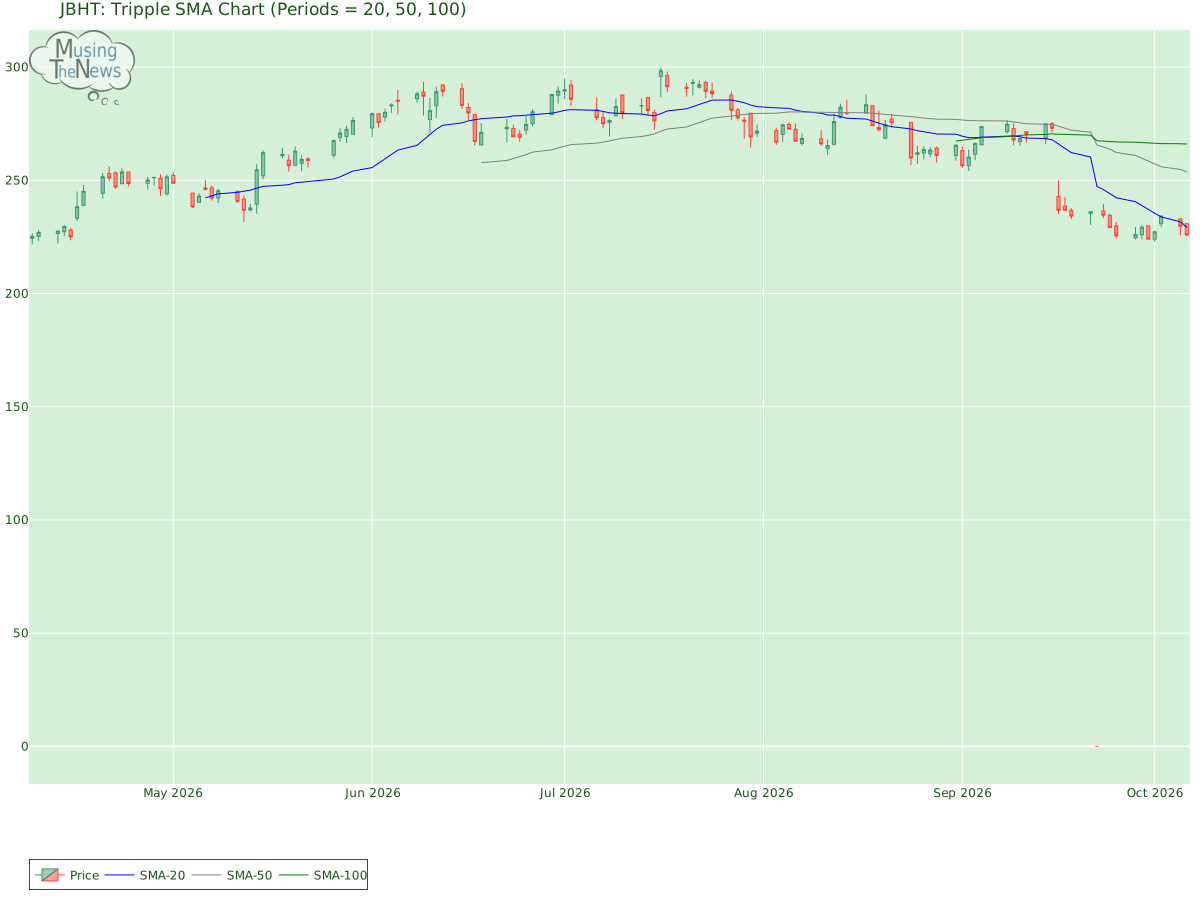
Aroon: The AROON is neutral, showing no definitive signals of a trend either upward or downward. This neutral stance indicates a period of market indecision, where the direction is unclear.Aroon chart for J.B. Hunt Transport Services, Inc.Bol. Bands: The BOLL BANDS is in a neutral stance, not pointing to a clear trend in either direction. This suggests that the market may be lacking strong momentum, making it difficult to predict the next move.Bolinger Bands chart for J.B. Hunt Transport Services, Inc.Parabolic SAR: The PSAR remains bullish in its outlook, reinforcing a key support level that could help sustain the market's upward movement for JBHT. This support suggests that the bullish momentum is likely to persist, offering a foundation for further growth.Parabolic Stop and Reverse chart for J.B. Hunt Transport Services, Inc.Stochastic: The stochastic indicator for JBHT reflects a bullish outlook, with the K-line positioned above the D-line and surpassing the 80 mark. This setup suggests strong upward momentum, implying that the market may continue to rise. Investors may interpret this as a positive signal for further gains.Stochastic chart for J.B. Hunt Transport Services, Inc.Tripple Moving Agerage: A bullish trend for J.B. Hunt Transport Services, Inc. is reflected in the alignment of the 20-50-100 period moving averages, though the slopes of the faster averages raise concerns about a potential reversal. The weakening momentum in the shorter-term averages suggests that the current trend may not last, signaling the possibility of a shift in direction.Tripple SMA chart for J.B. Hunt Transport Services, Inc. When evaluating a company, it is crucial to examine its fundamentals, including its financial statements, management structure, and market position. Additionally, understanding the broader industry trends, competition, and regulatory landscape helps to create a well-rounded view. By assessing both the company's internal factors and the external environment in which it operates, you can extract more valuable insights from its technical performance, such as stock price movements and trading patterns.