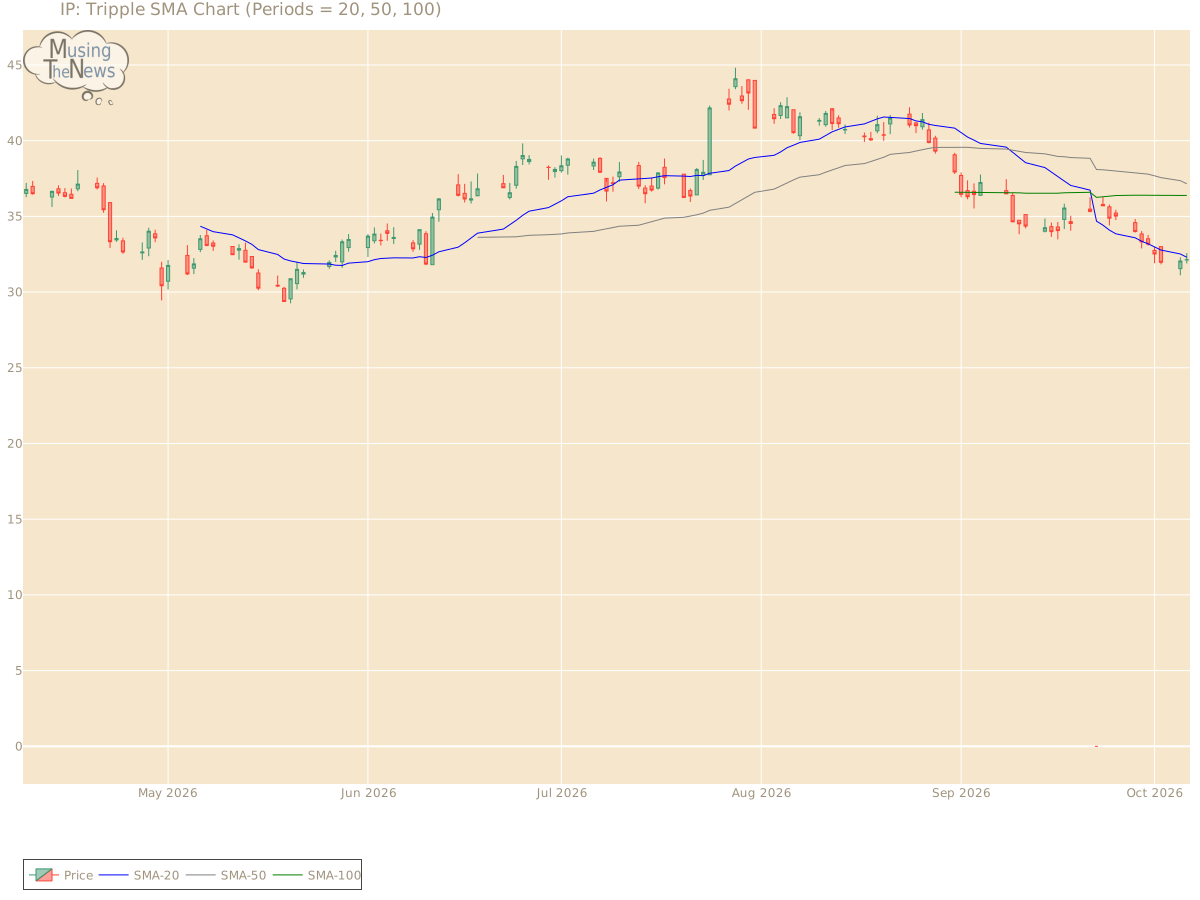
The Tripple MOVING AVG is in a neutral stance, with no clear direction indicated for the market. This lack of clarity suggests that the market may be in a state of equilibr...
By MusingTheNews
Updated 2026-10-07 23:26:26
Overall Technical outlook
Price Summary
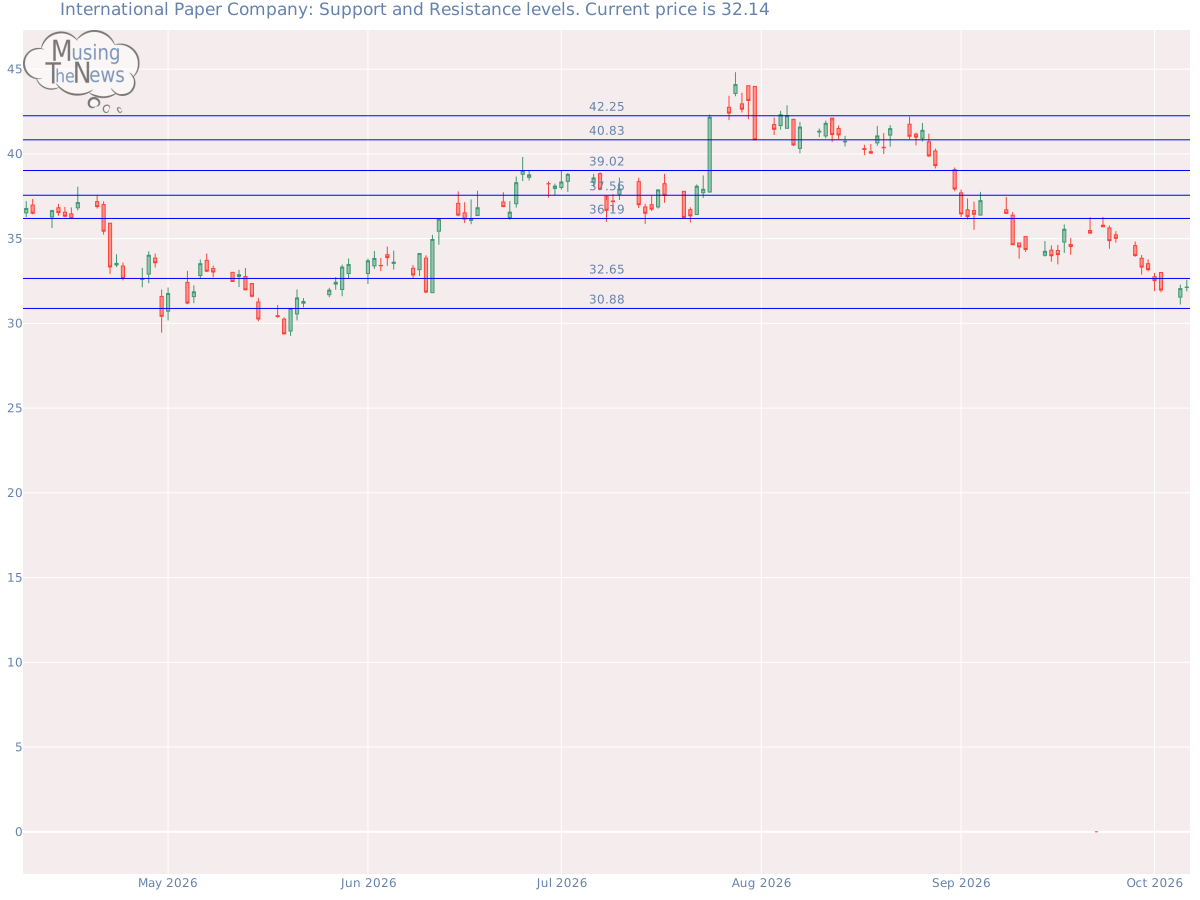
On 2026-10-06, International Paper Company's stock opened at 32.12, peaked at 32.58, hit a low of 31.89, and closed 0.06% up at 32.14, with 4751400 shares changing hands. Over the past year, the stock's highest price was 49.19, and its lowest was 0.0.
Technicals
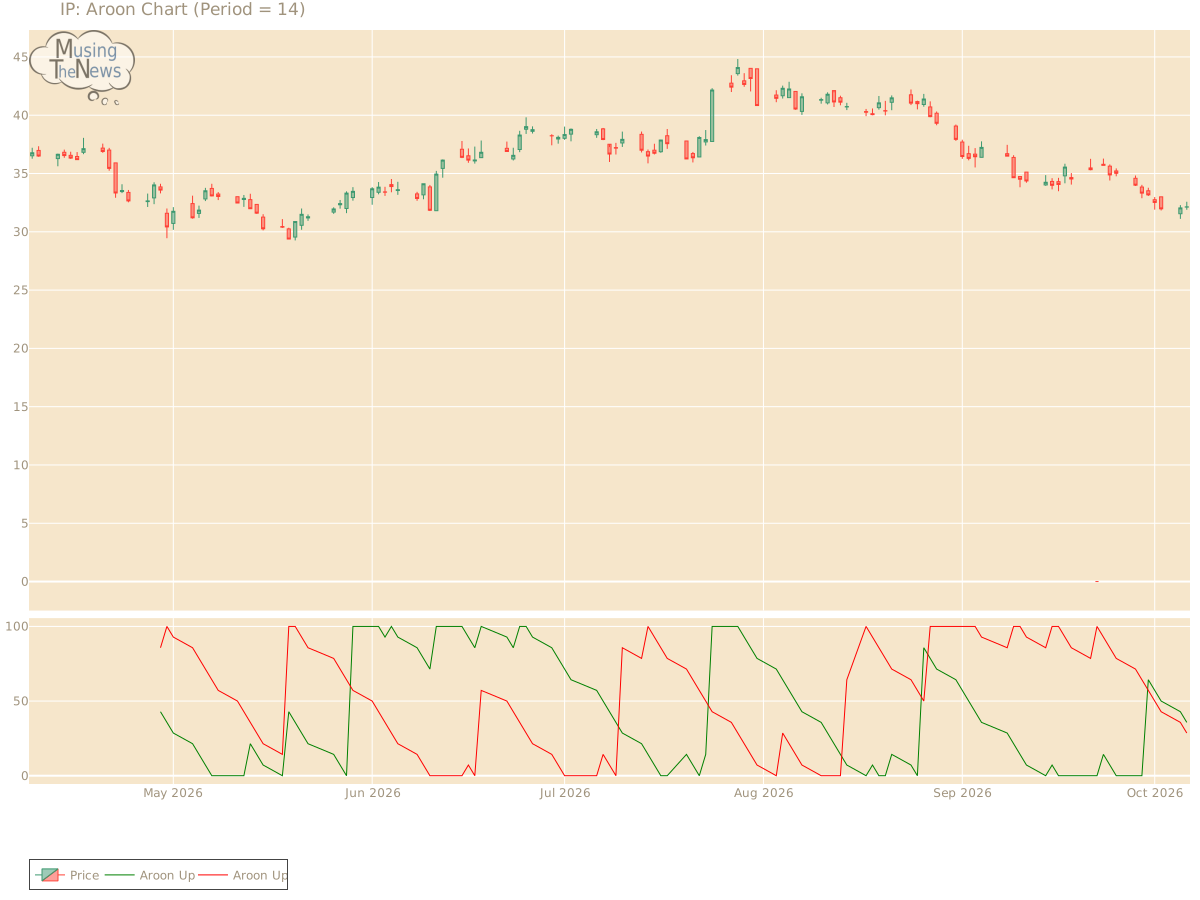
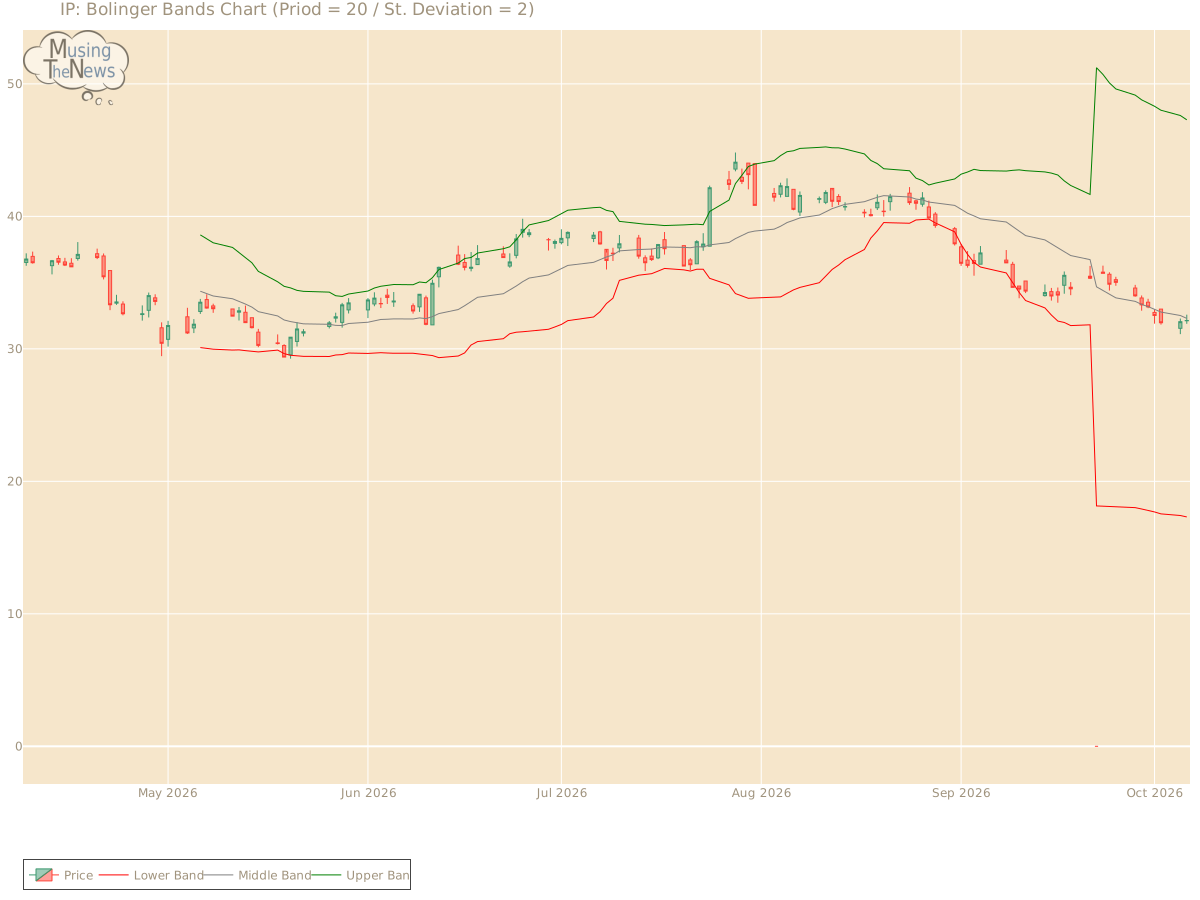
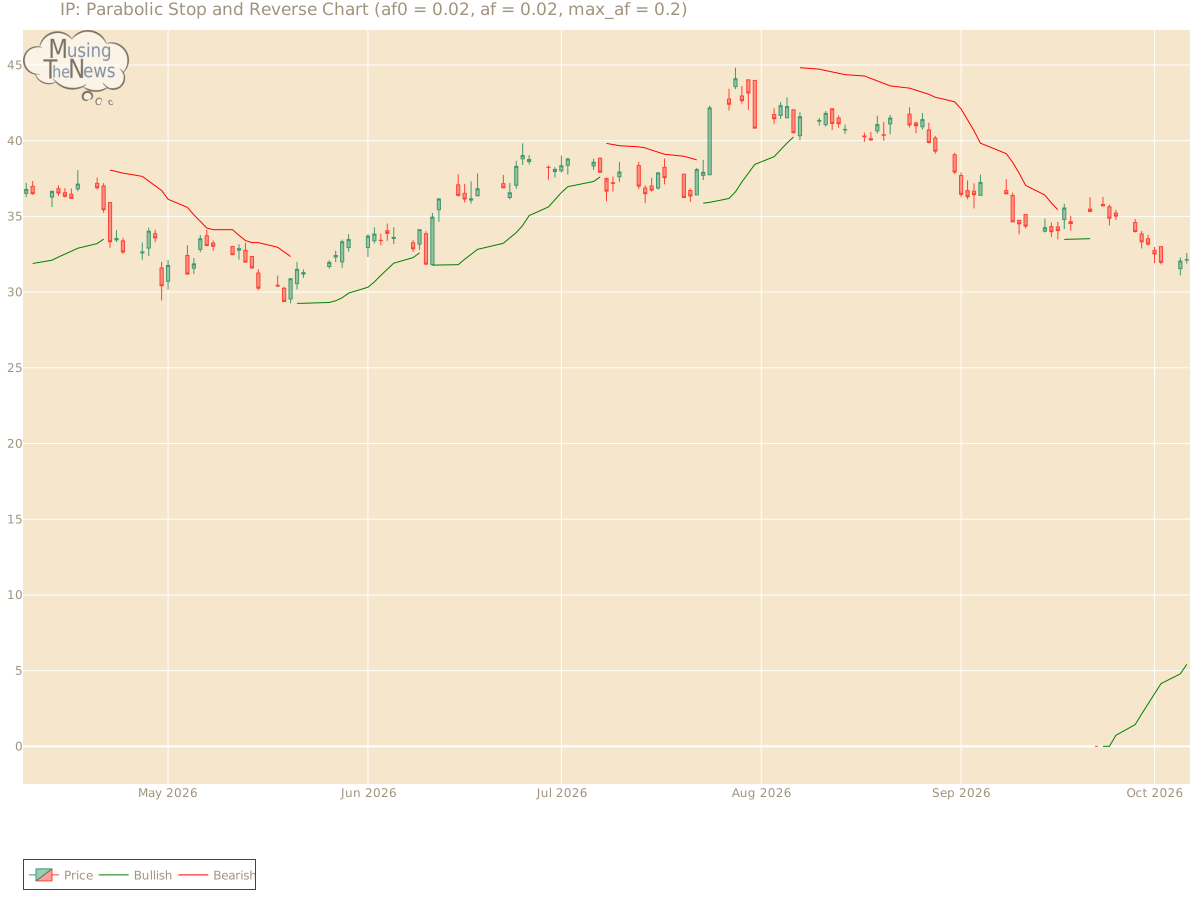
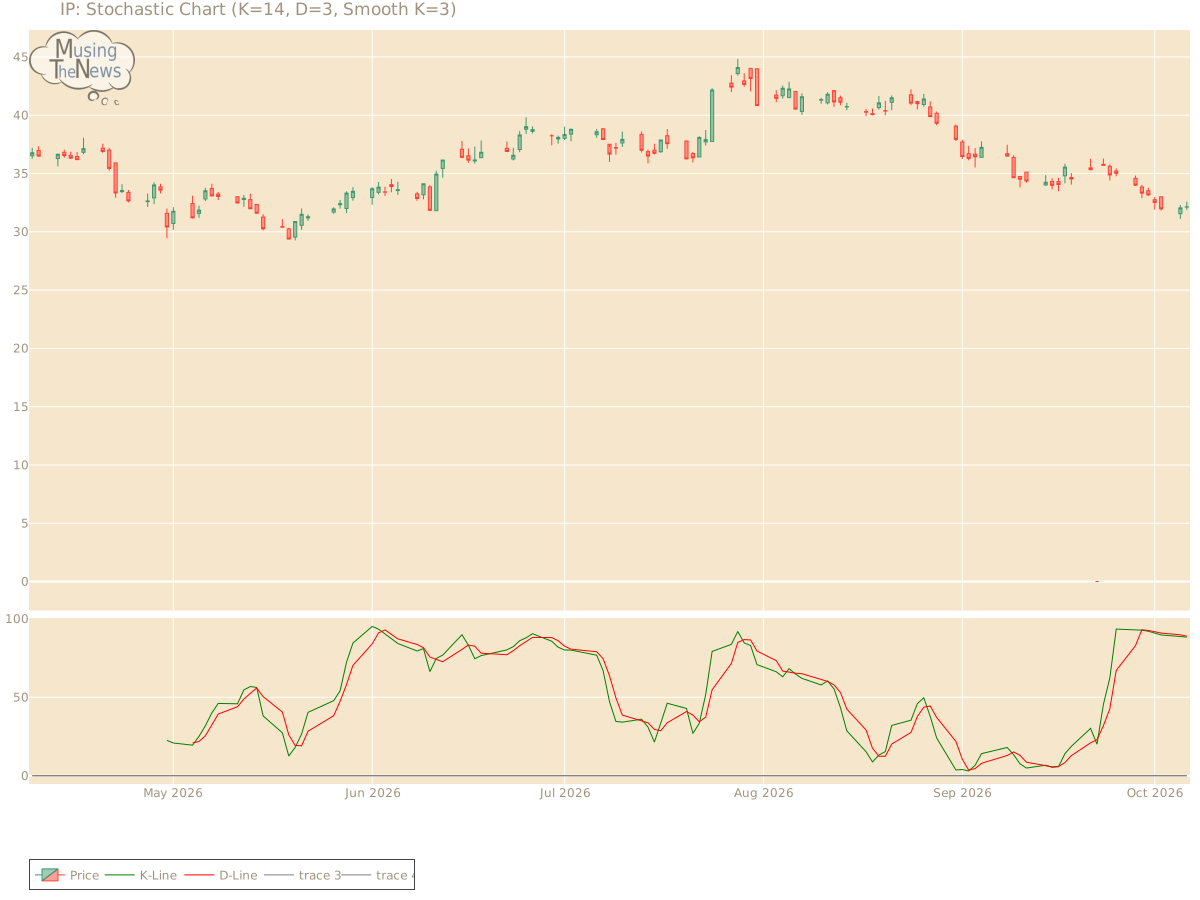
Support and Resistance: The current price is 32.14, with support at 30.88 and resistance at 32.65. This range suggests that the price might move between these levels, with 30.88 offering support and 32.65 capping further gains for International Paper Company.Support/Resistance for IPAroon: The AROON is showing a neutral reading, with no clear direction indicated for upward or downward movement. This neutral position suggests a possible period of consolidation.Aroon chart for International Paper CompanyBol. Bands: The BOLL BANDS is in a neutral stance for IP, not indicating a clear upward or downward trend. This suggests a period of market indecision, where neither bulls nor bears have the upper hand.Bolinger Bands chart for International Paper CompanyParabolic SAR: The PSAR remains bullish, setting a strong support level that could underpin further upward movement. This persistent bullish outlook suggests that the market may continue its positive trajectory, with the established support acting as a safety net.Parabolic Stop and Reverse chart for International Paper CompanyStochastic: The K-line has slipped below the D-line on the stochastic indicator while staying above 80, suggesting the onset of a bearish price move. This pattern may indicate that the market's upward momentum is starting to fade, which could lead to a reversal. Investors should be mindful of this possible shift for IP.Stochastic chart for International Paper CompanyTripple Moving Agerage: The Tripple MOVING AVG is in a neutral stance, with no clear direction indicated for the market. This lack of clarity suggests that the market may be in a state of equilibrium for IP, with no strong trend emerging.Tripple SMA chart for International Paper Company To make the most of a company's technical analysis, it's important to start with an understanding of its fundamentals. These include profitability, cash flow, and competitive positioning. Additionally, the industry in which the company operates plays a critical role, as trends and external factors can influence its market performance. By considering both the company's internal fundamentals and the external industry environment, more meaningful and accurate conclusions can be drawn from the technical data.
International Paper CompanyIP share priceIP technical chartIP stock chartIP techncal analysisIP price trendsIP stock signalsIP stock pricestock marketNSE stock chart