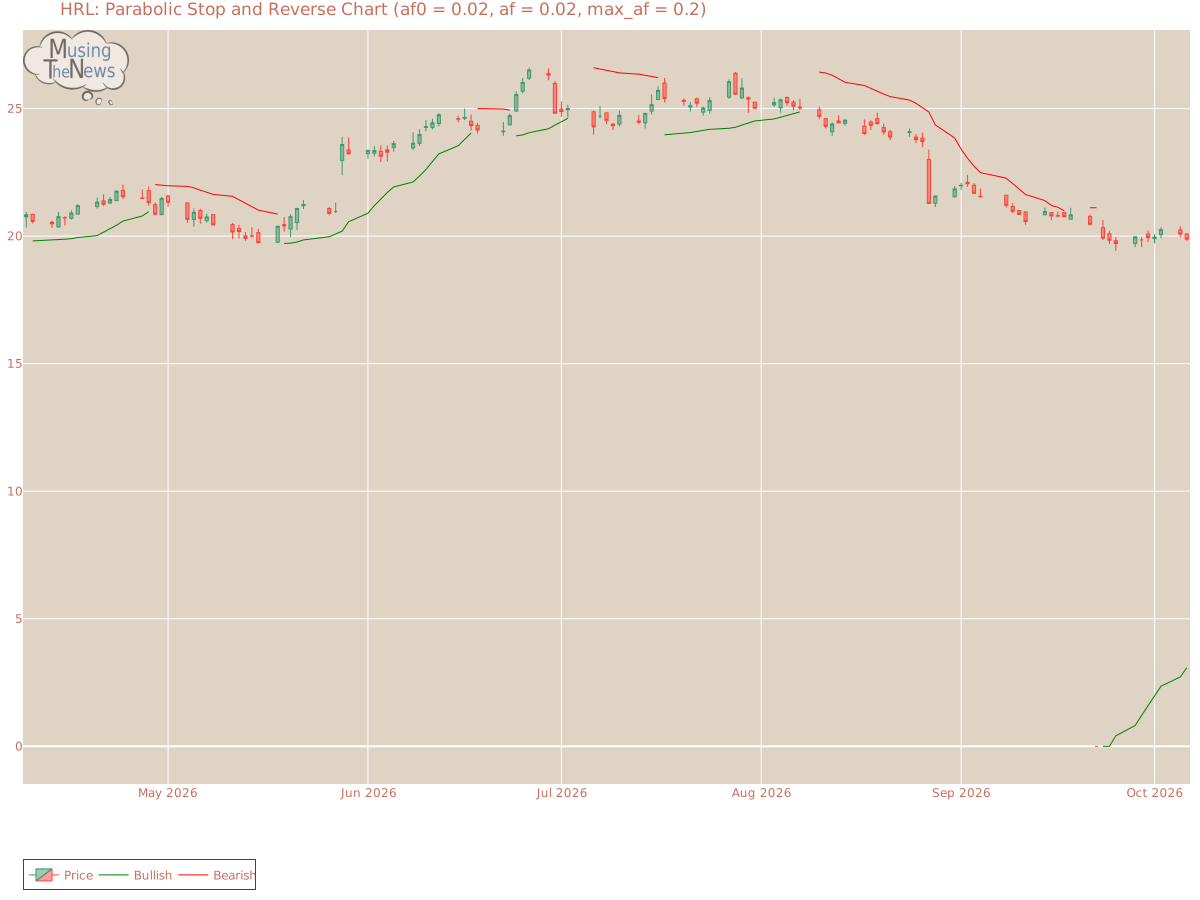
The PSAR continues to indicate a bullish outlook, establishing a key support level that could sustain the market's upward trend. This support suggests that the bullish mome...
By MusingTheNews
Updated 2026-10-07 23:26:23
Overall Technical outlook
Price Summary
On 2026-10-06, HRL's stock started at 20.08, reached a high of 20.11, fell to 19.81, and ended -1.0% down at 19.88, with 6380600 shares traded. In the 52-week period, the stock's peak price is 26.51, and the lowest price recorded is 0.0.
Technicals
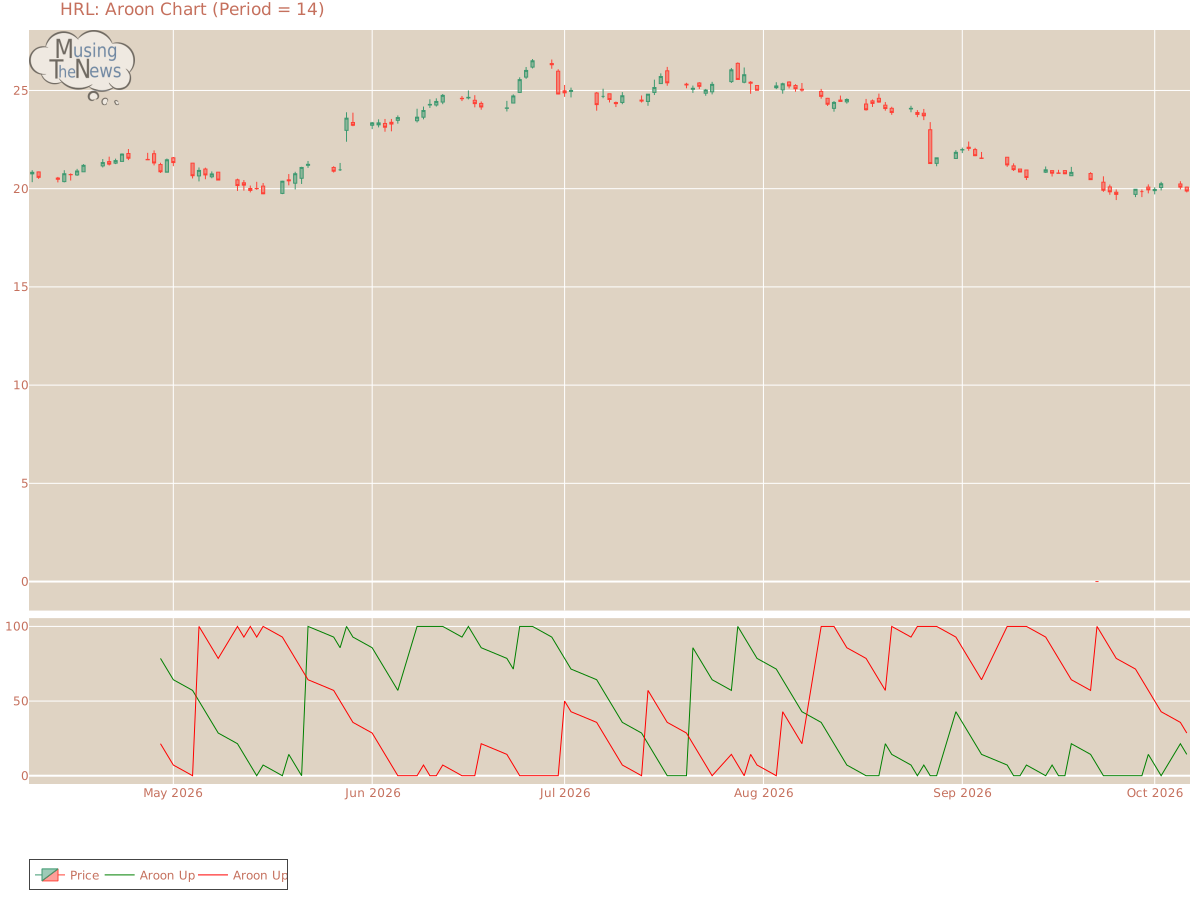
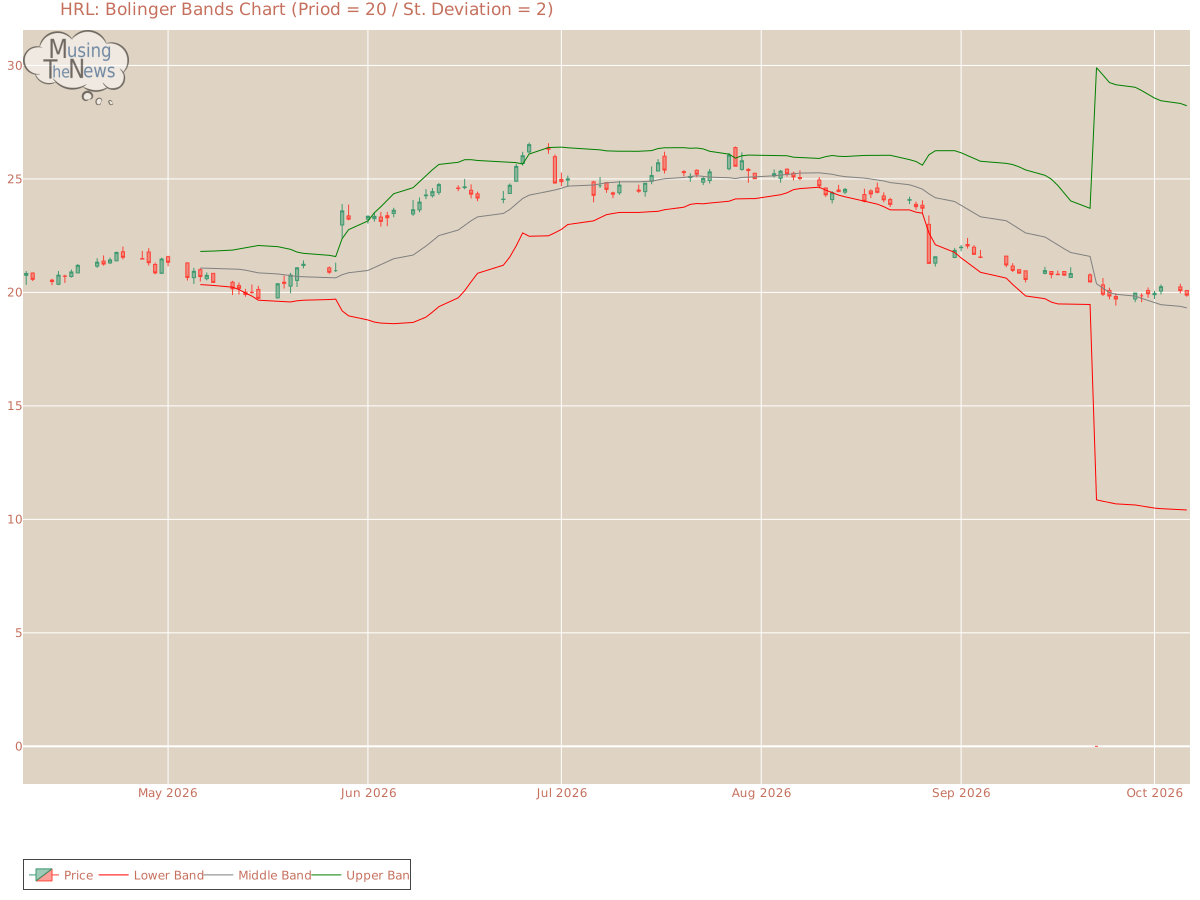
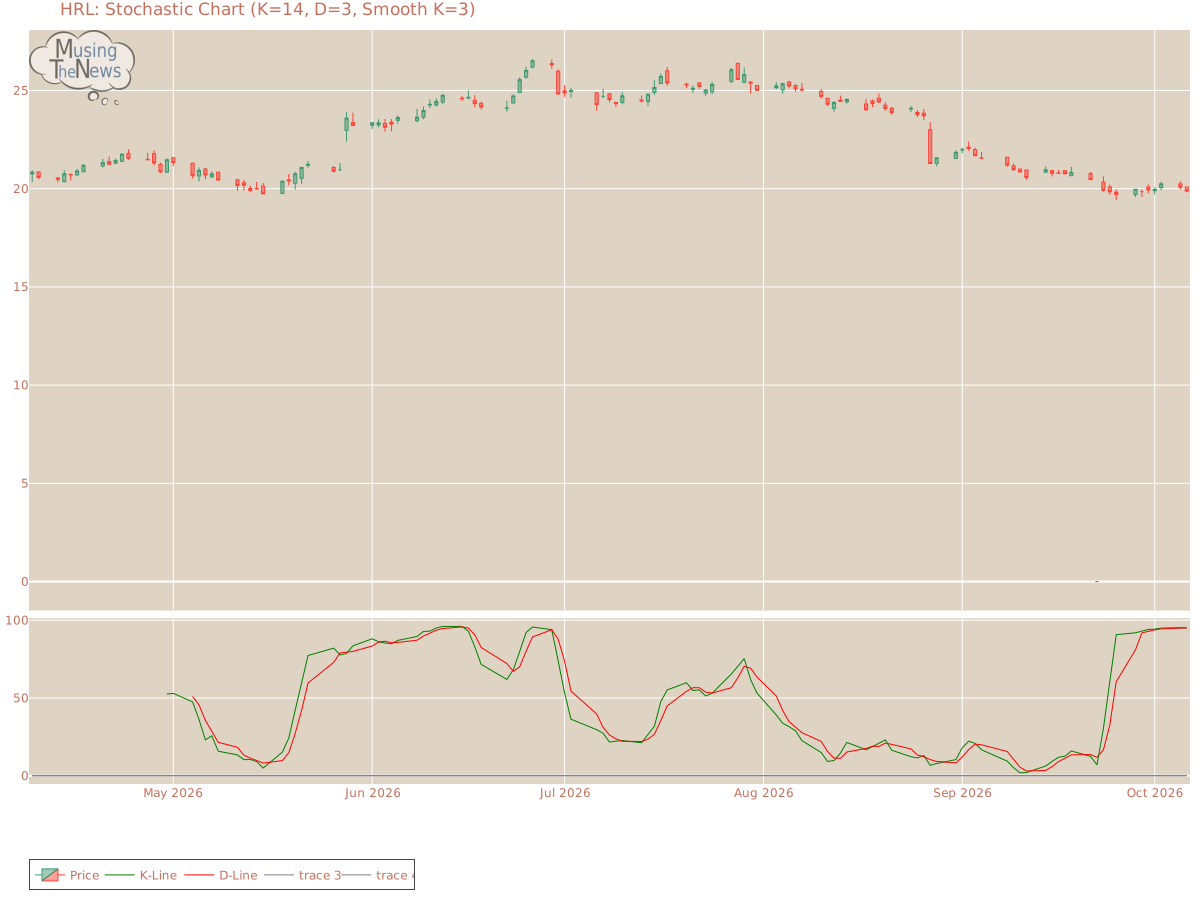
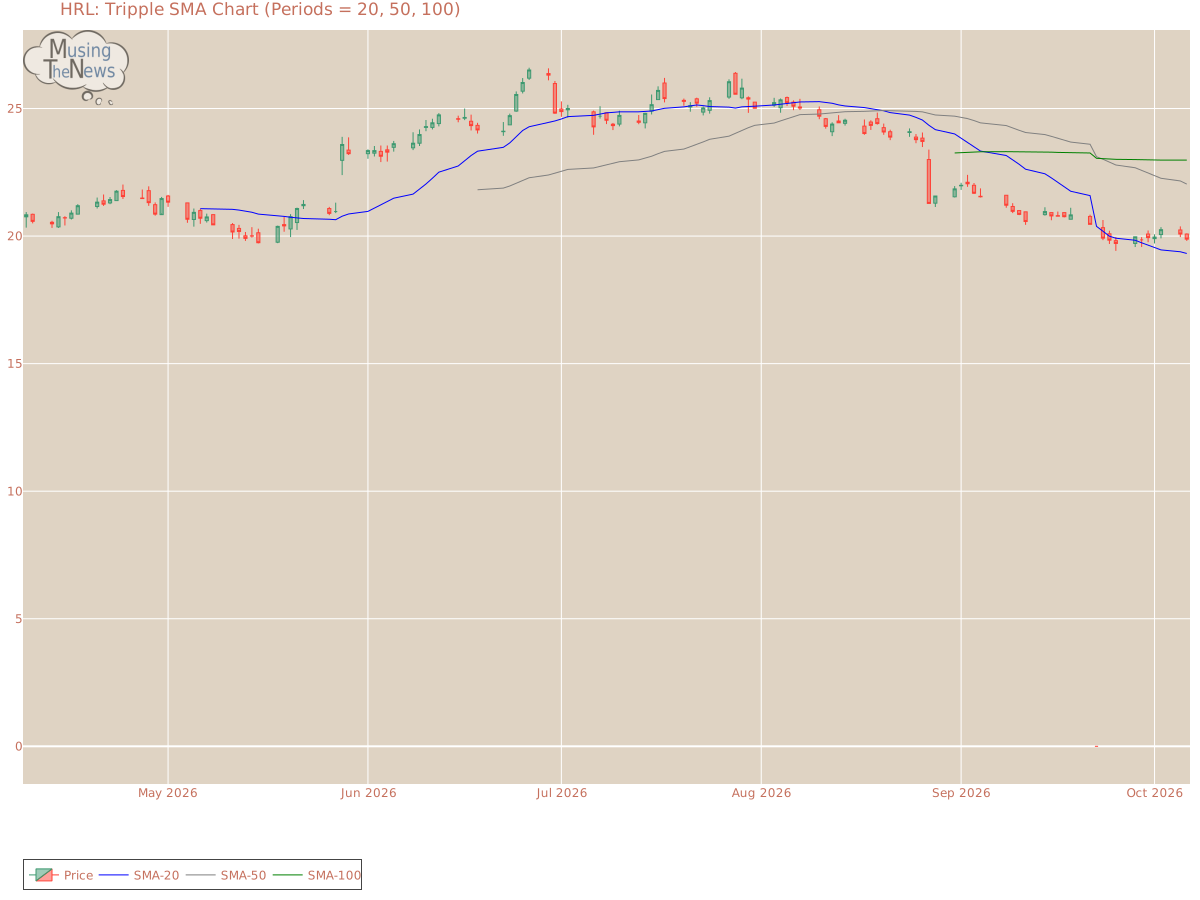
Aroon: The AROON is currently in a neutral position, offering no clear indication of movement up or down. This suggests that the market may be experiencing a period of equilibrium, with no strong trend in play.Aroon chart for Hormel Foods CorporationBol. Bands: The current reading of the BOLL BANDS indicator suggests a neutral stance, with no clear signals indicating an upward or downward direction. This lack of directional bias suggests the market may be in a period of consolidation or uncertainty.Bolinger Bands chart for Hormel Foods CorporationParabolic SAR: The PSAR continues to indicate a bullish outlook, establishing a key support level that could sustain the market's upward trend. This support suggests that the bullish momentum is likely to persist, offering a foundation for further growth.Parabolic Stop and Reverse chart for Hormel Foods CorporationStochastic: The stochastic indicator is in a bullish phase, as the K-line is above the D-line and the 80 mark. This setup suggests strong upward momentum, implying that HRL may continue to experience gains. Investors may consider this a positive signal for continued market growth.Stochastic chart for Hormel Foods CorporationTripple Moving Agerage: The moving averages for HRL for the 20-50-100 periods point to a bullish trend, but the slopes of the faster averages suggest this strength may be waning. The potential for a reversal is becoming apparent, as the shorter-term averages indicate that the upward momentum could be weakening, signaling a possible trend change.Tripple SMA chart for Hormel Foods Corporation Before focusing on technical indicators like stock price and volume, it's important to consider a company's fundamentals. These include financial metrics such as profitability, revenue growth, and debt levels. Furthermore, understanding the industry landscape, including competition and consumer trends, provides essential context. By combining this fundamental analysis with technical data, investors can make more informed decisions and draw deeper conclusions about the company's potential for future growth and success.