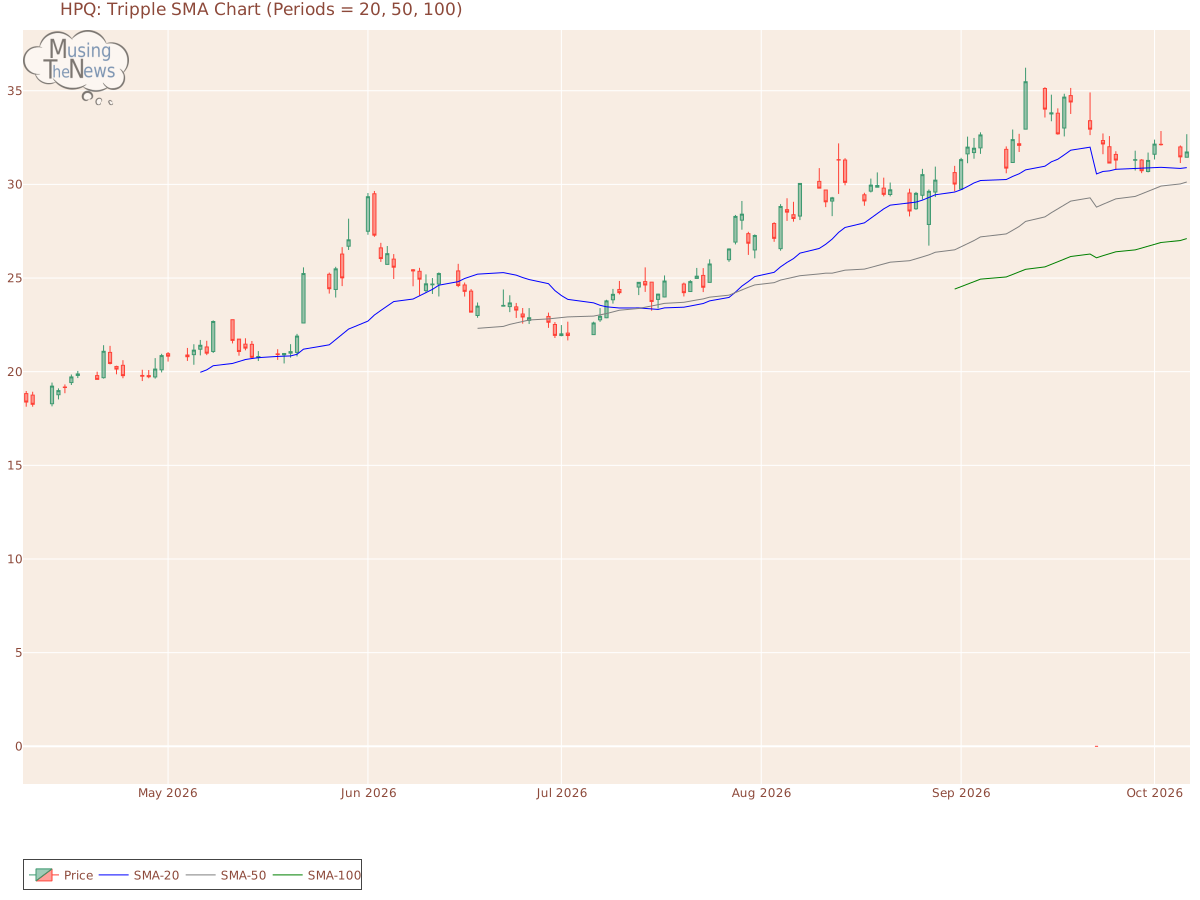
The Tripple MOVING AVG is in a neutral stance, not pointing to a clear trend in either direction. This suggests that the market may be lacking strong momentum, making it di...
By MusingTheNews
Updated 2026-10-07 23:26:24
Overall Technical outlook
Price Summary
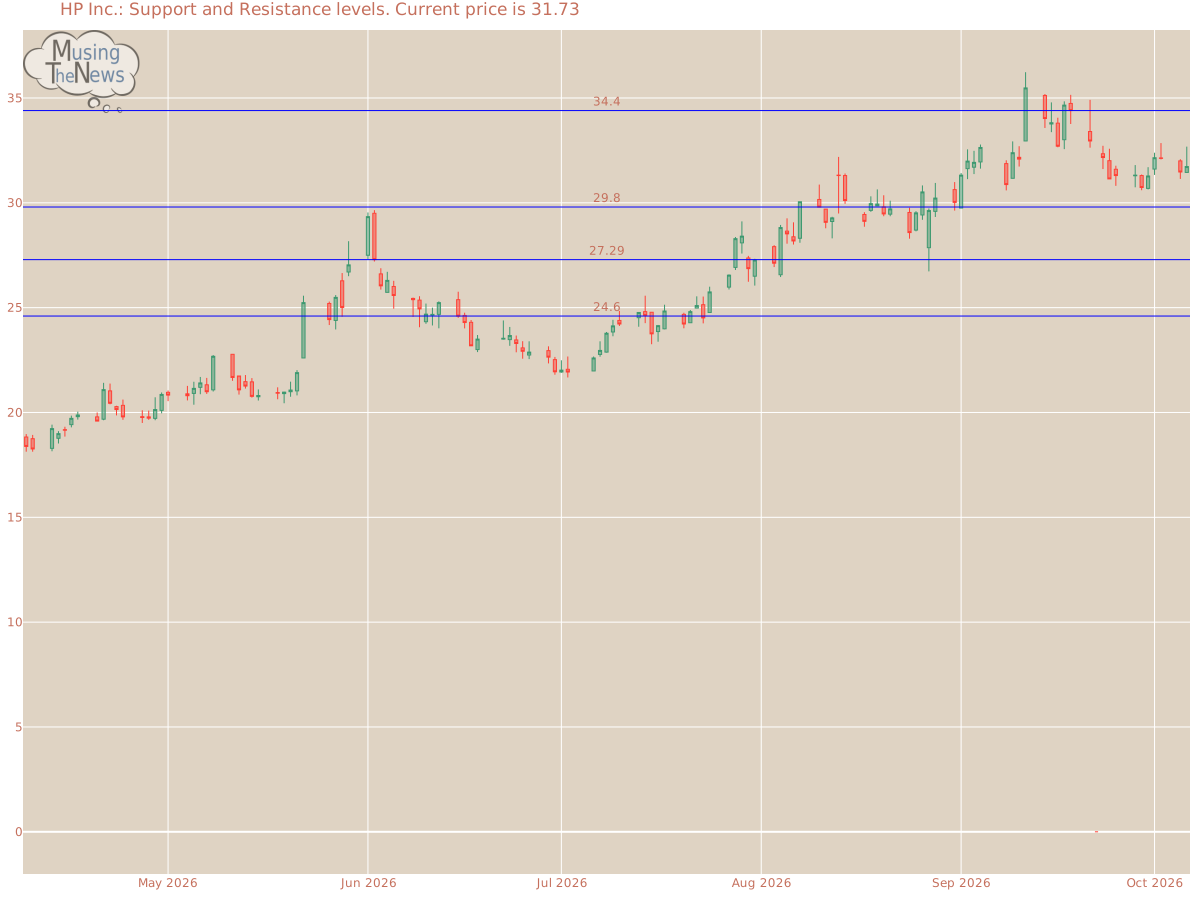
On 2026-10-06, HP Inc.'s stock opened at 31.45, spiked to 32.68, declined to 31.45, and closed 0.89% up at 31.73, with 9945500 shares traded. In the past year, the highest stock price was 35.48, and the lowest was 0.0.
Technicals
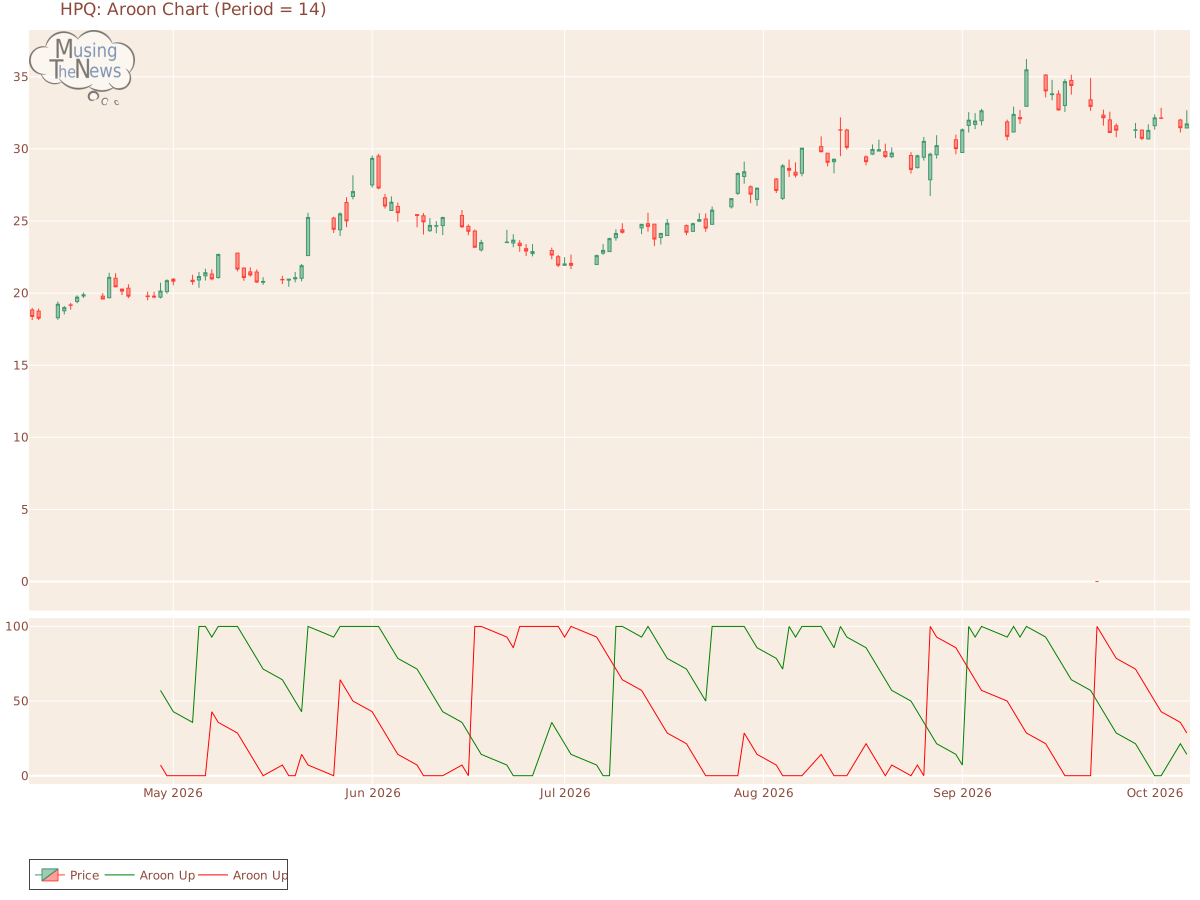
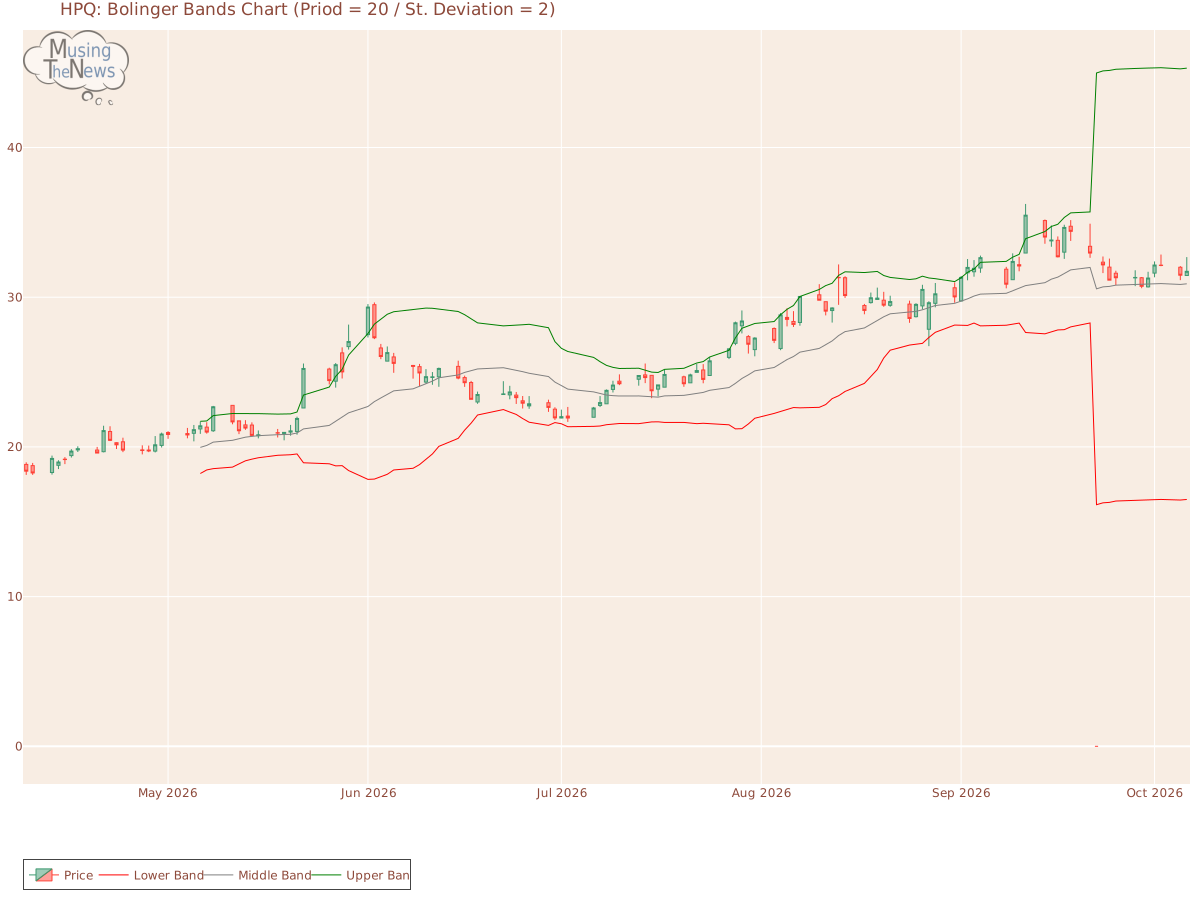
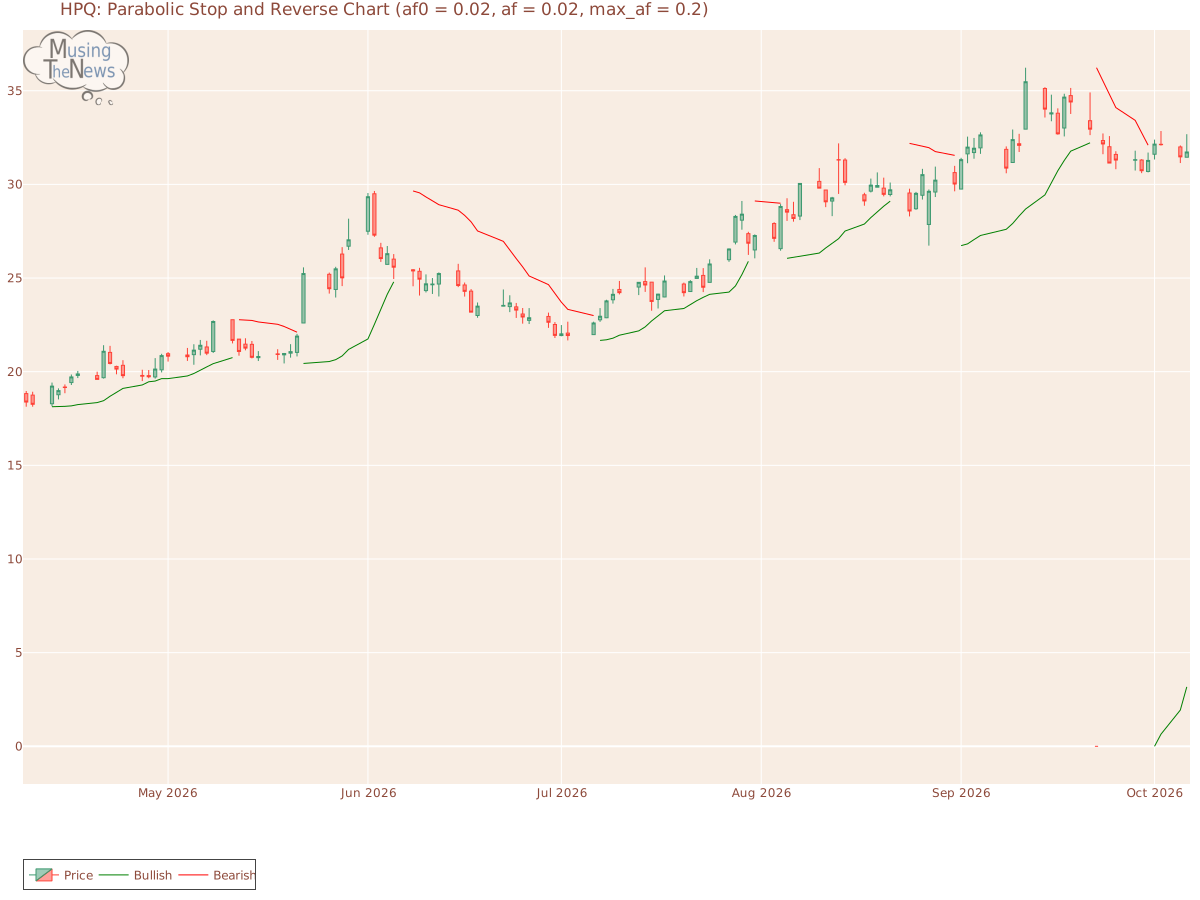
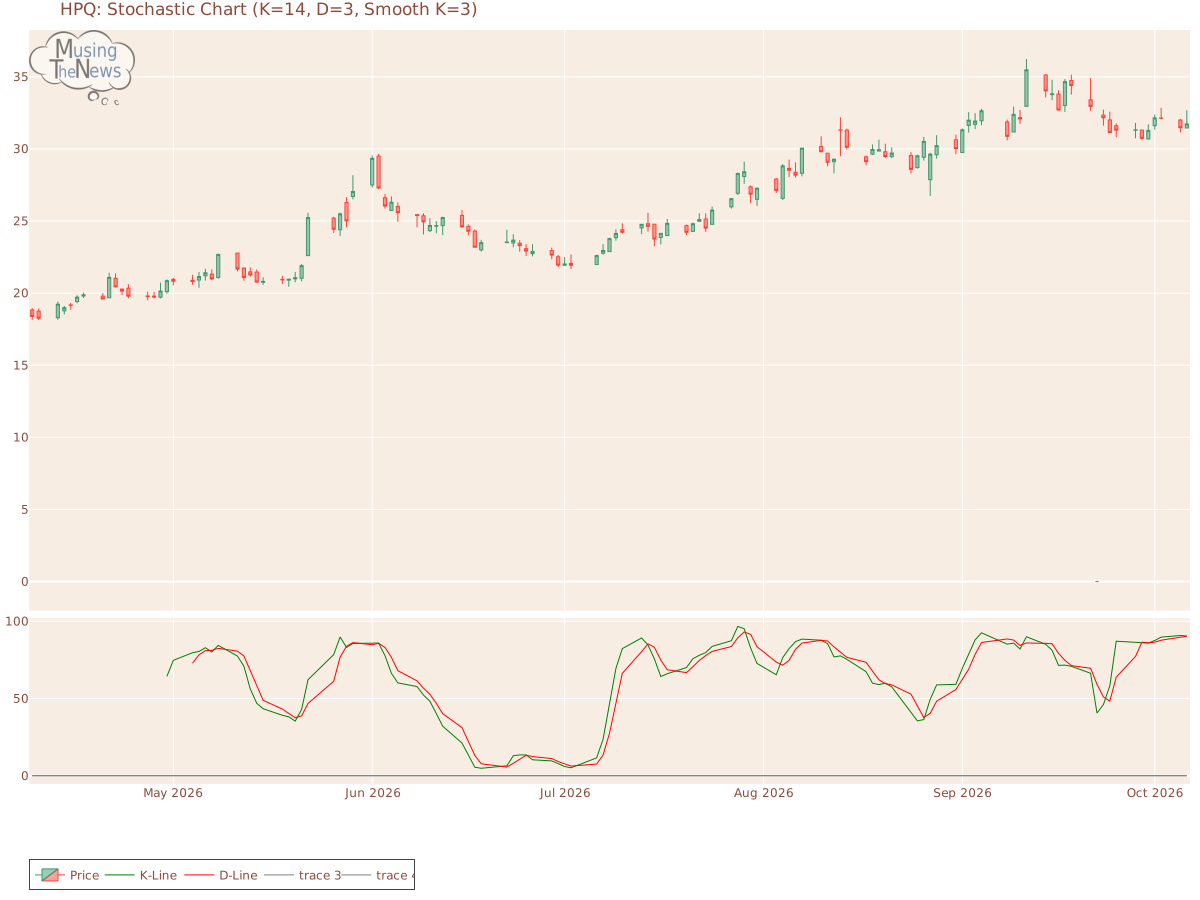
Support and Resistance: The price is currently at 31.73, supported by 29.8 and resisted by 34.4. This indicates a range where 29.8 may provide a base for the price, while 34.4 serves as a cap on further upward movement for HPQ.Support/Resistance for HPQAroon: The current reading of the AROON is neutral, offering no clear signals for a movement in either direction. This suggests that the market may be in a holding pattern, with no dominant trend in place.Aroon chart for HP Inc.Bol. Bands: The BOLL BANDS is currently neutral, offering no clear guidance on market direction. This suggests that the market may be in a state of pause, with no strong trend emerging.Bolinger Bands chart for HP Inc.Parabolic SAR: The PSAR remains bullish in its outlook, establishing a key support level that could serve as a foundation for further upward movement. This persistent bullish stance suggests that the market may continue to trend higher, with the established support providing a potential safety net for investors.Parabolic Stop and Reverse chart for HP Inc.Stochastic: The stochastic indicator for HPQ shows a bullish signal, with the K-line positioned above the D-line and also above the 80 mark. This suggests strong upward momentum, indicating that the market may continue to trend higher. Traders might view this as a sign of continued strength and potential buying opportunities.Stochastic chart for HP Inc.Tripple Moving Agerage: The Tripple MOVING AVG is in a neutral stance, not pointing to a clear trend in either direction. This suggests that the market may be lacking strong momentum, making it difficult to predict the next move.Tripple SMA chart for HP Inc. Understanding a company's fundamentals—such as revenue, earnings, and debt levels—provides a solid foundation for analyzing its technical performance. Similarly, knowledge of the industry, including key competitors and market trends, is critical. Combining this fundamental analysis with technical indicators like stock charts, moving averages, and trading volume enables a more comprehensive approach to evaluating the company's overall health and potential future performance.