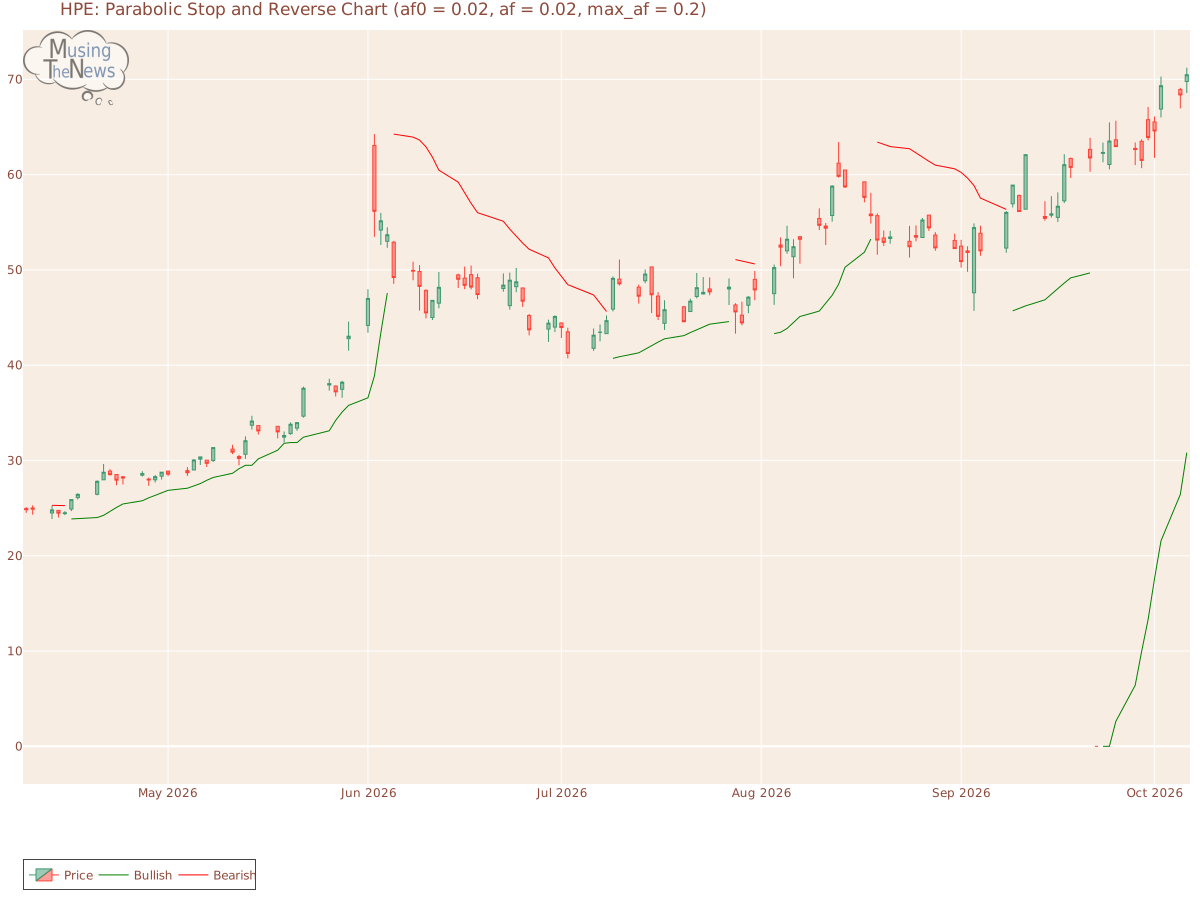
The PSAR continues to indicate a bullish outlook, setting a crucial support level. This strong support could bolster the ongoing upward trend, suggesting that the market ma...
By MusingTheNews
Updated 2026-10-07 23:26:22
Overall Technical outlook
Price Summary
On 2026-10-06, Hewlett Packard Enterprise Company's stock opened at 69.77, reached a high of 71.22, dropped to a low of 68.56, and closed higher 1.02% at 70.48, with a trading volume of 16627800 shares. Over the past year, the stock's highest price was 70.48, and its lowest was 0.0.
Technicals
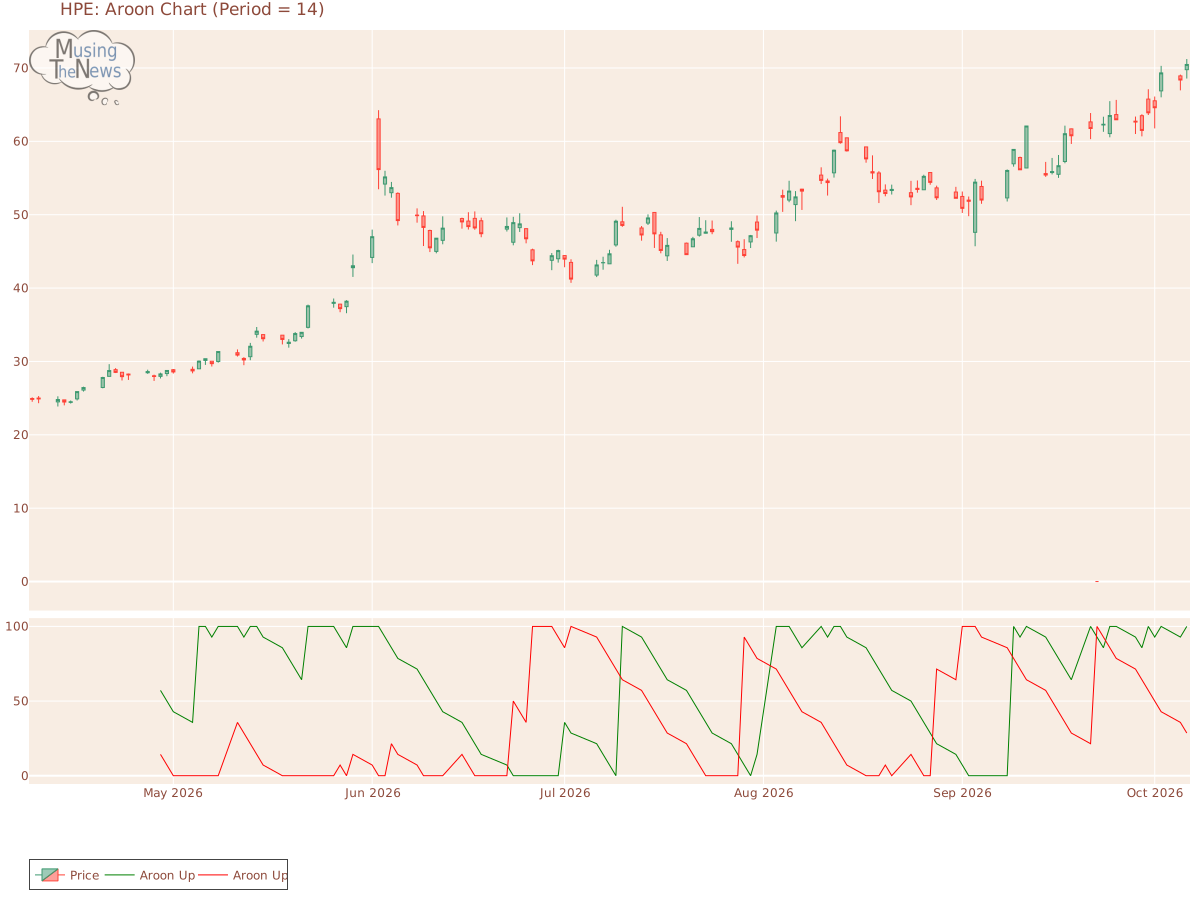
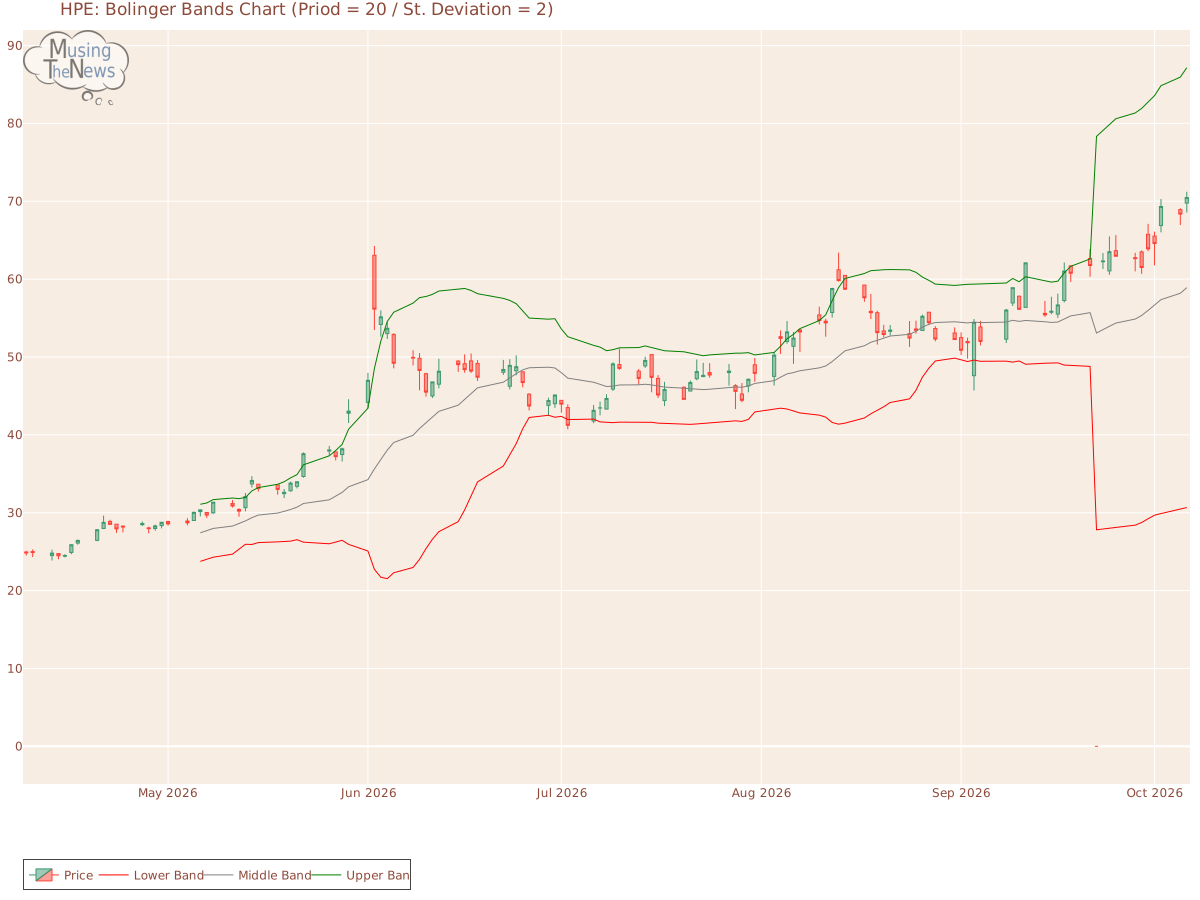
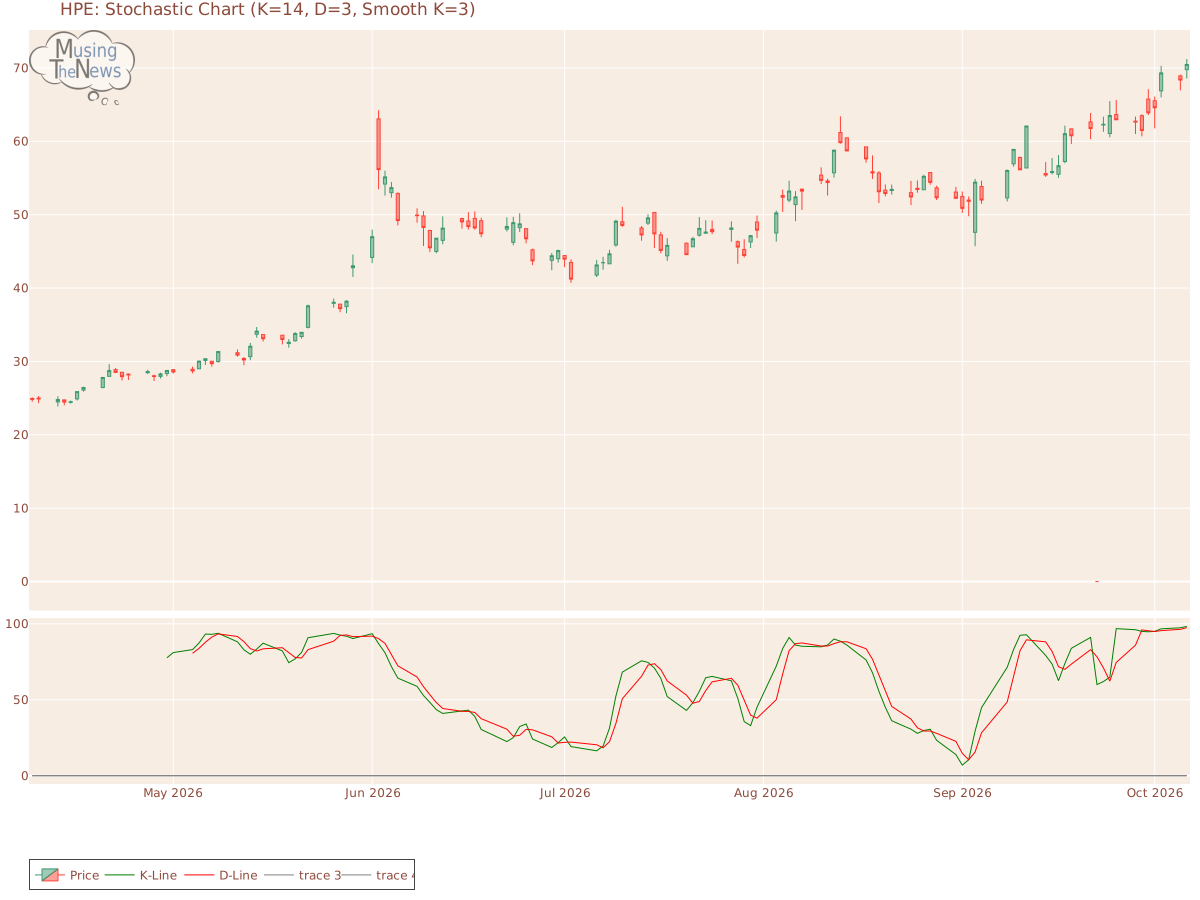
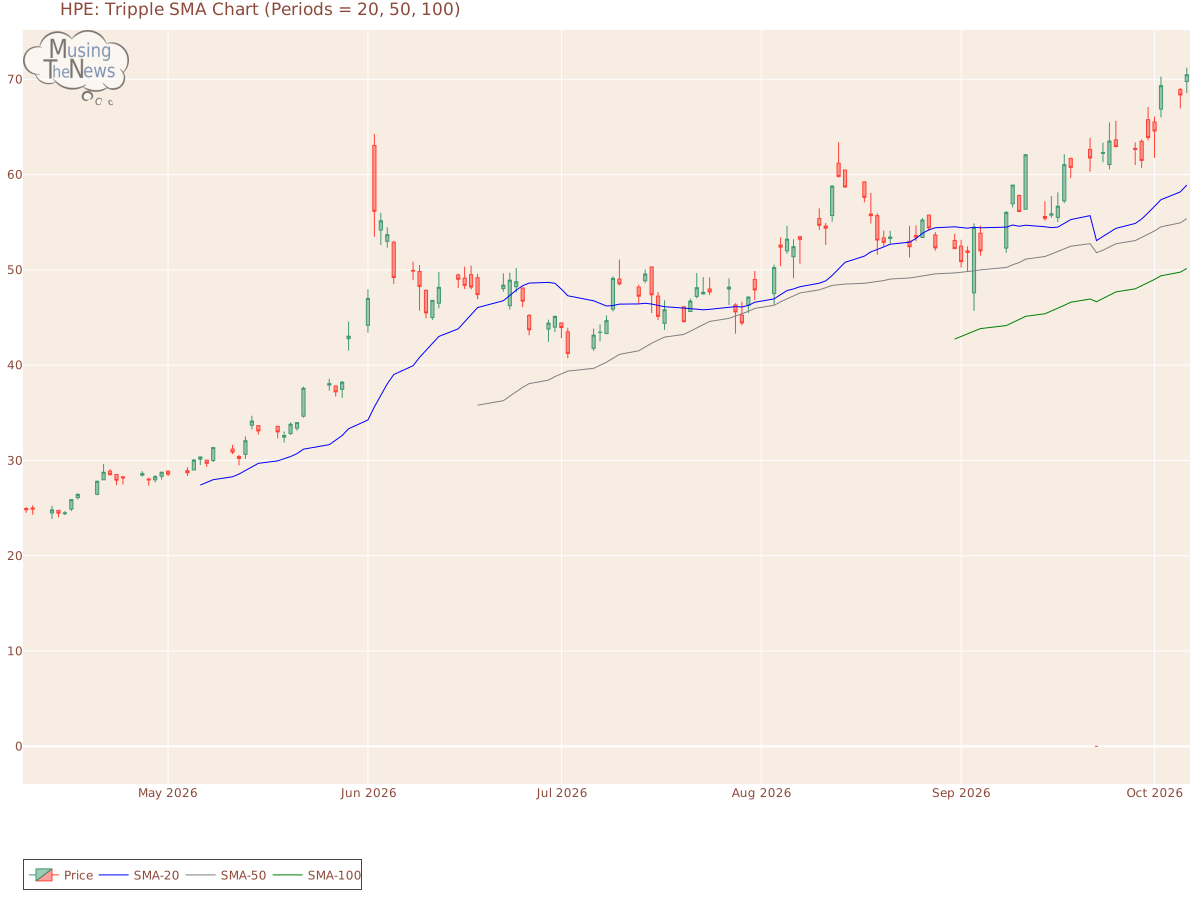
Aroon: The bullish trend indicated by Aroon persists, with Aroon Up holding steady at the 100 level. This shows strong market momentum, but further exploration using additional indicators is necessary to confirm the trend's strength and future potential.Aroon chart for Hewlett Packard Enterprise CompanyBol. Bands: The BOLL BANDS is showing a neutral stance, not indicating a clear upward or downward trend for Hewlett Packard Enterprise Company. This suggests a period of market balance, where neither side is showing dominance.Bolinger Bands chart for Hewlett Packard Enterprise CompanyParabolic SAR: The PSAR continues to indicate a bullish outlook, setting a crucial support level. This strong support could bolster the ongoing upward trend, suggesting that the market may remain in a positive trajectory. Investors may view this as a sign of sustained bullish momentum.Parabolic Stop and Reverse chart for Hewlett Packard Enterprise CompanyStochastic: With the K-line above both the D-line and the 80 mark, the stochastic indicator signals a bullish trend. This configuration suggests that the market is experiencing strong upward momentum, likely leading to further gains. Investors may see this as a favorable condition for potential growth.Stochastic chart for Hewlett Packard Enterprise CompanyTripple Moving Agerage: The 20, 50, and 100 moving averages for Hewlett Packard Enterprise Company are currently aligned in a bearish formation, signaling a downtrend. However, the wavering slopes of the 20 and 50 SMAs suggest that this bearish momentum may be weakening. This could indicate an upcoming shift towards bullish price action, as the loss of downward momentum might lead to a potential reversal in the market's current trend.Tripple SMA chart for Hewlett Packard Enterprise Company Understanding a company's fundamentals—such as revenue, earnings, and debt levels—provides a solid foundation for analyzing its technical performance. Similarly, knowledge of the industry, including key competitors and market trends, is critical. Combining this fundamental analysis with technical indicators like stock charts, moving averages, and trading volume enables a more comprehensive approach to evaluating the company's overall health and potential future performance.