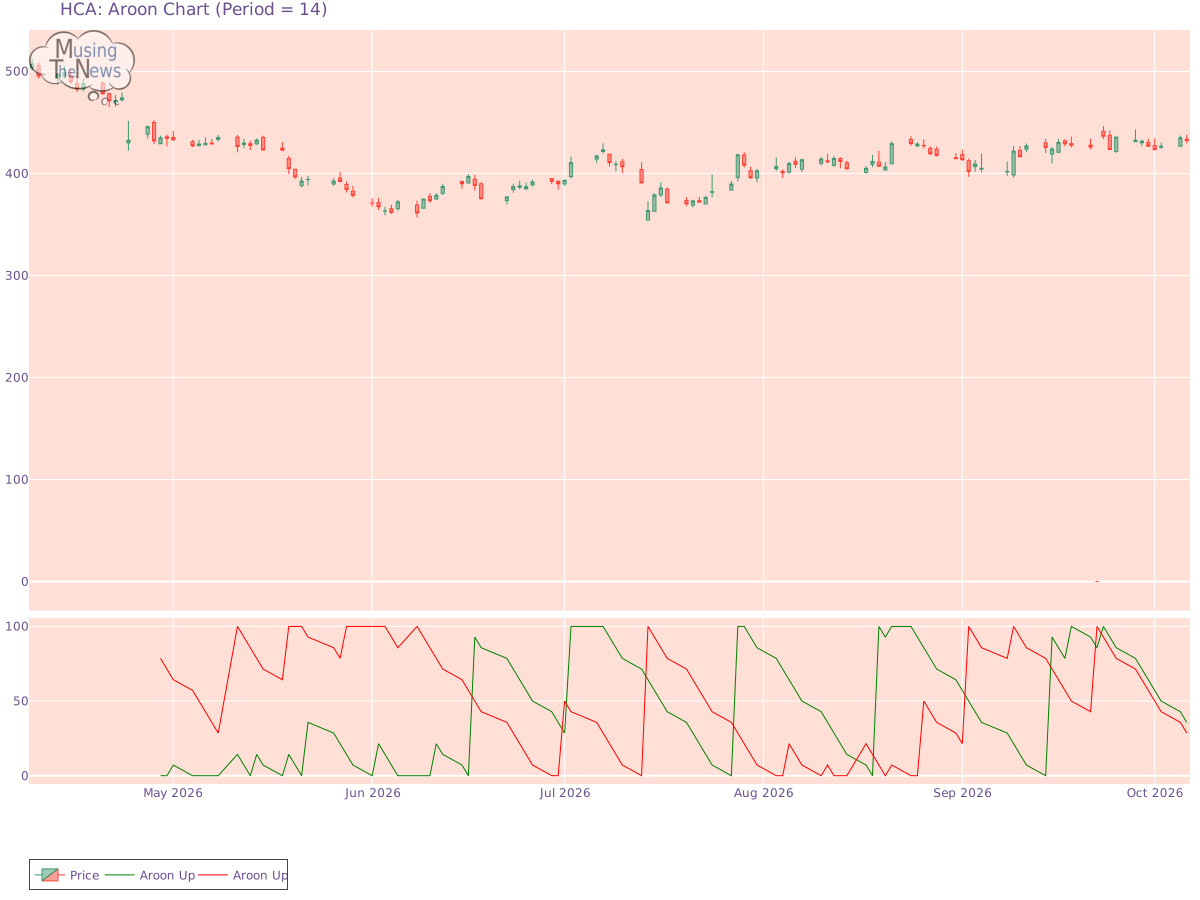
The AROON is currently in a neutral position, offering no clear indication of movement up or down. This suggests that the market may be experiencing a period of equilibrium...
By MusingTheNews
Updated 2026-10-07 23:26:21
Overall Technical outlook
Price Summary
HCA Healthcare, Inc.'s stock opened at 433.61 on 2026-10-06, surged to a high of 438.11, hit a low of 429.49, and closed up -0.33% at 432.2, with 999200 shares traded. During the past 52 weeks, the highest stock price was 544.32, and the lowest was 0.0.
Technicals
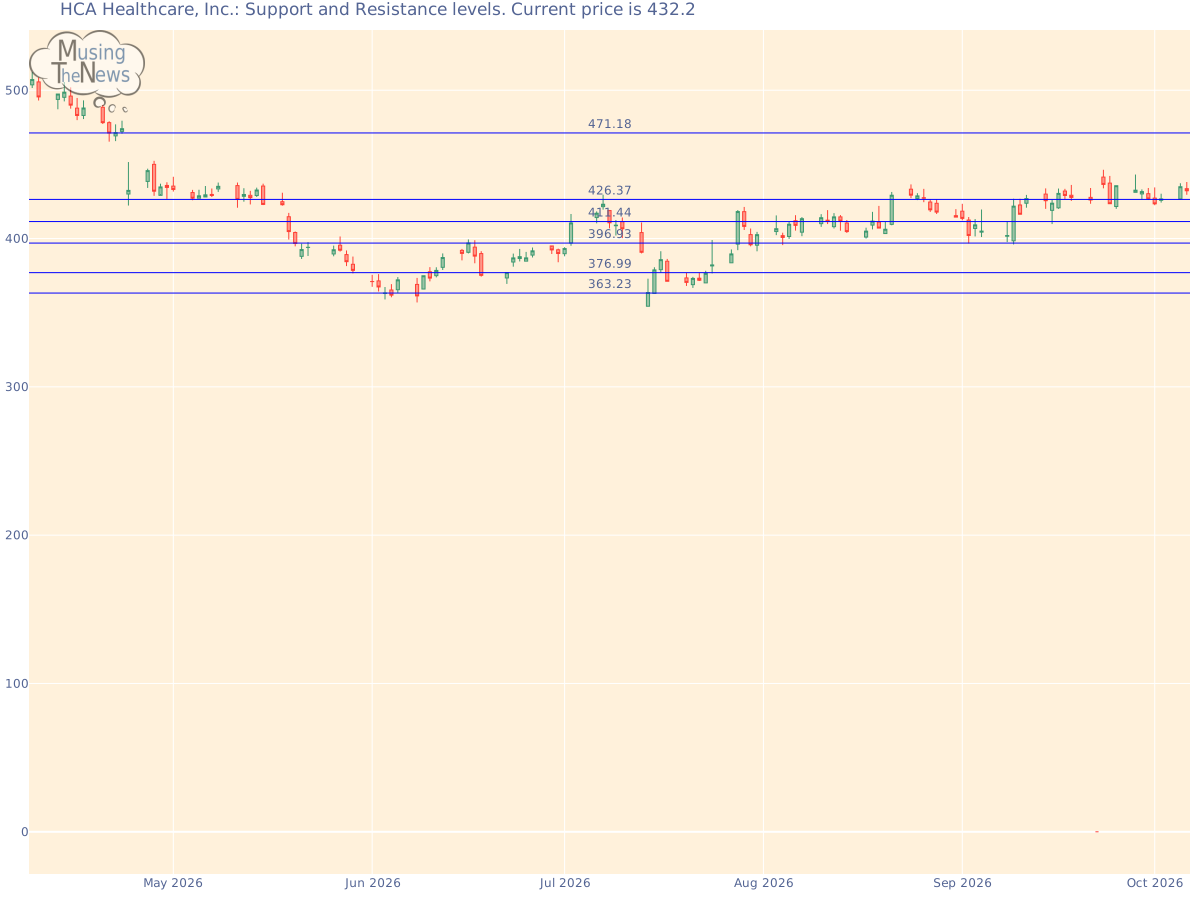
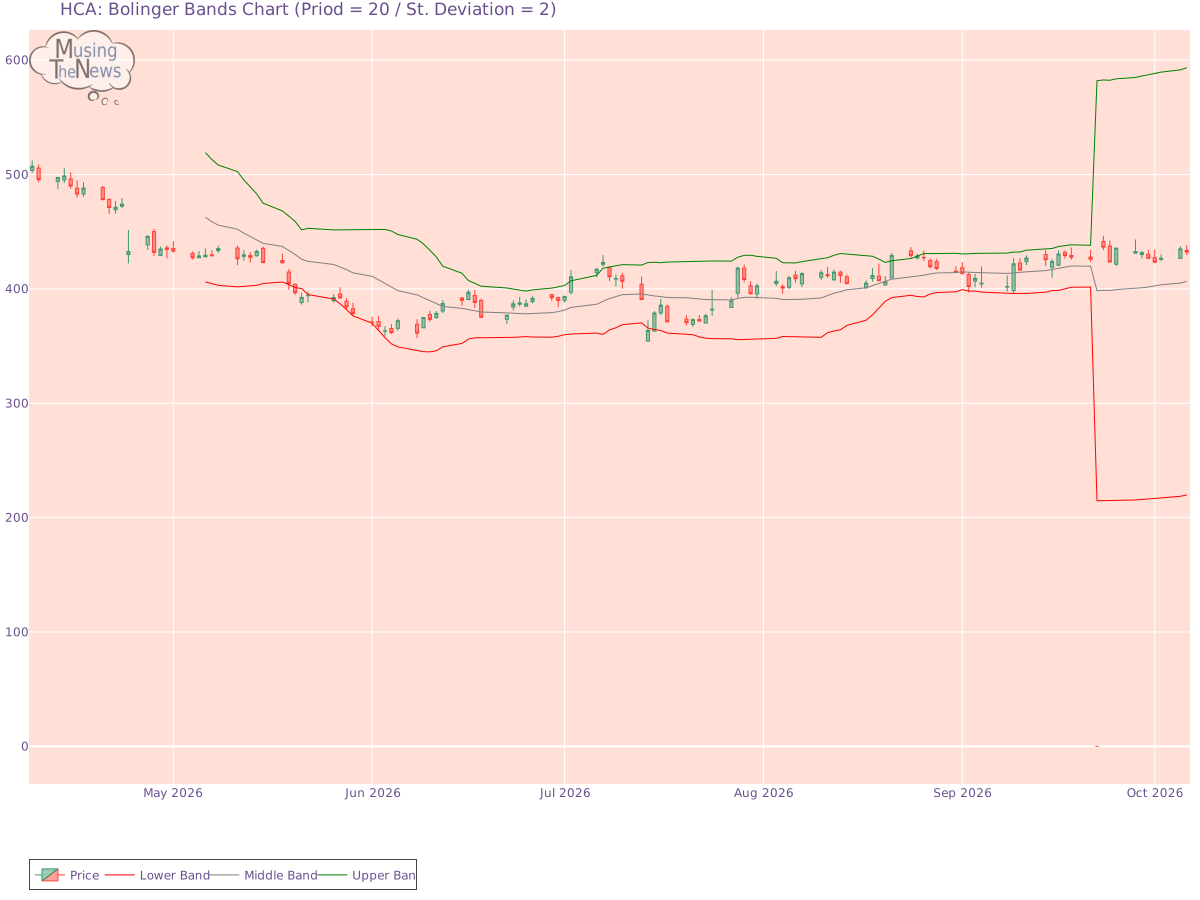
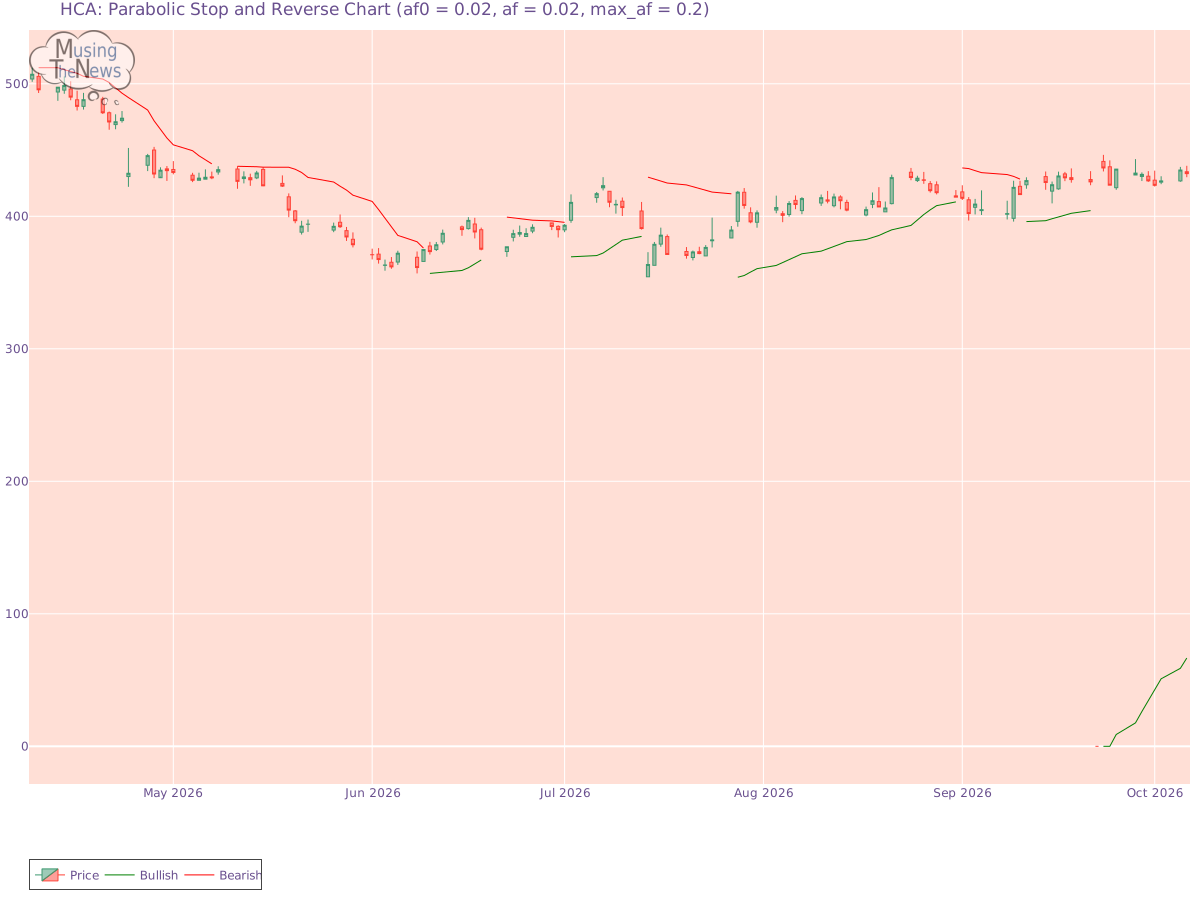
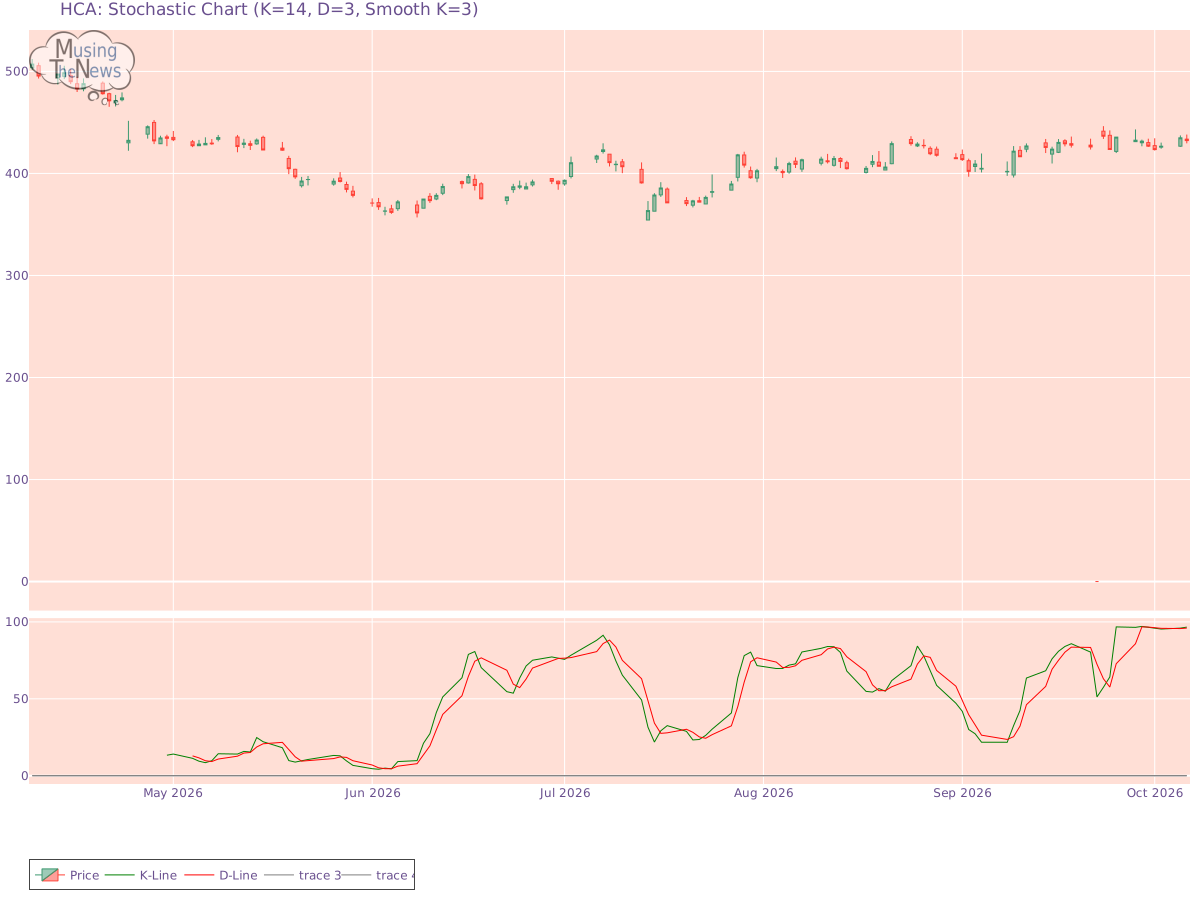
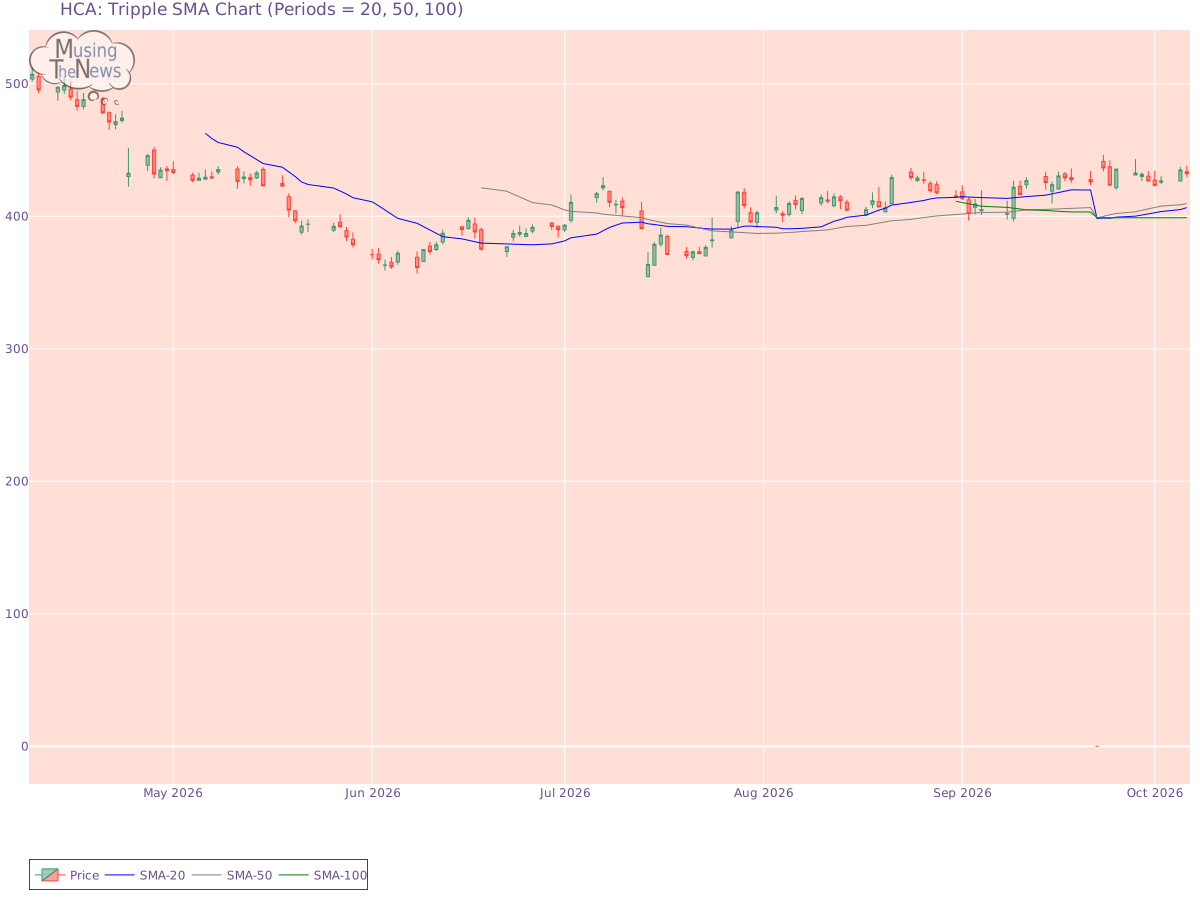
Support and Resistance: The current price of 432.2 for HCA finds support at 426.37 and resistance at 471.18. These levels define a range in which the price might oscillate, with 426.37 as a potential support and 471.18 as a resistance level.Support/Resistance for HCAAroon: The AROON is currently in a neutral position, offering no clear indication of movement up or down. This suggests that the market may be experiencing a period of equilibrium, with no strong trend in play.Aroon chart for HCA Healthcare, Inc.Bol. Bands: The BOLL BANDS is in a neutral stance, not pointing to a clear trend in either direction. This suggests that the market may be lacking strong momentum, making it difficult to predict the next move.Bolinger Bands chart for HCA Healthcare, Inc.Parabolic SAR: The PSAR remains bullish in its outlook, setting a key support level that could sustain the ongoing upward trend. This strong support indicates that the market may continue to rise, with the bullish momentum likely to persist for HCA.Parabolic Stop and Reverse chart for HCA Healthcare, Inc.Stochastic: The stochastic indicator is in a bullish phase, as the K-line is above the D-line and the 80 mark. This setup suggests strong upward momentum, implying that HCA may continue to experience gains. Investors may consider this a positive signal for continued market growth.Stochastic chart for HCA Healthcare, Inc.Tripple Moving Agerage: The current state of the Tripple MOVING AVG is neutral, providing no clear signals for either an upward or downward movement. This indicates that the market may be in a state of equilibrium, with no strong momentum in either direction.Tripple SMA chart for HCA Healthcare, Inc. When assessing a company's technical performance, such as stock price fluctuations and trading volume, it is crucial to first examine its fundamentals. These fundamentals include financial health, profitability, and growth potential. Additionally, understanding the industry's dynamics, including competitive pressures and market trends, is key to contextualizing the company's performance. By integrating these factors, a more comprehensive and meaningful analysis can be conducted, leading to more informed investment decisions.