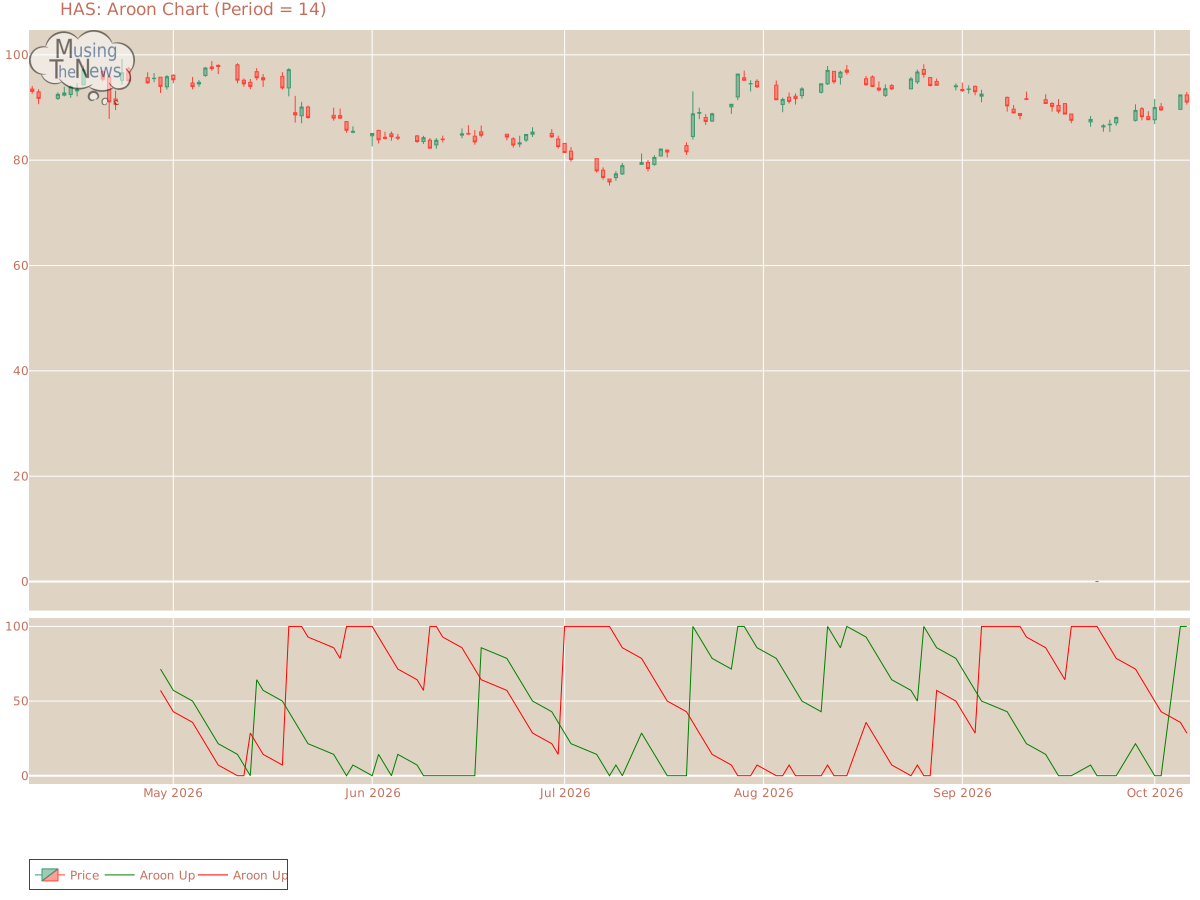
Aroon's bullish trend is ongoing, with Aroon Up consistently at the 100 level. While this suggests strong market momentum, it's important to analyze this trend further with...
By MusingTheNews
Updated 2026-10-07 23:26:21
Overall Technical outlook
Price Summary
Hasbro, Inc.'s stock started the year at 92.38, climbed to a high of 92.94, fell to 90.55, and closed -1.46% down at 91.03, with 1708100 shares traded on 2026-10-06. In the 52-week period, the stock's peak price is 105.94, and the lowest price recorded is 0.0.
Technicals
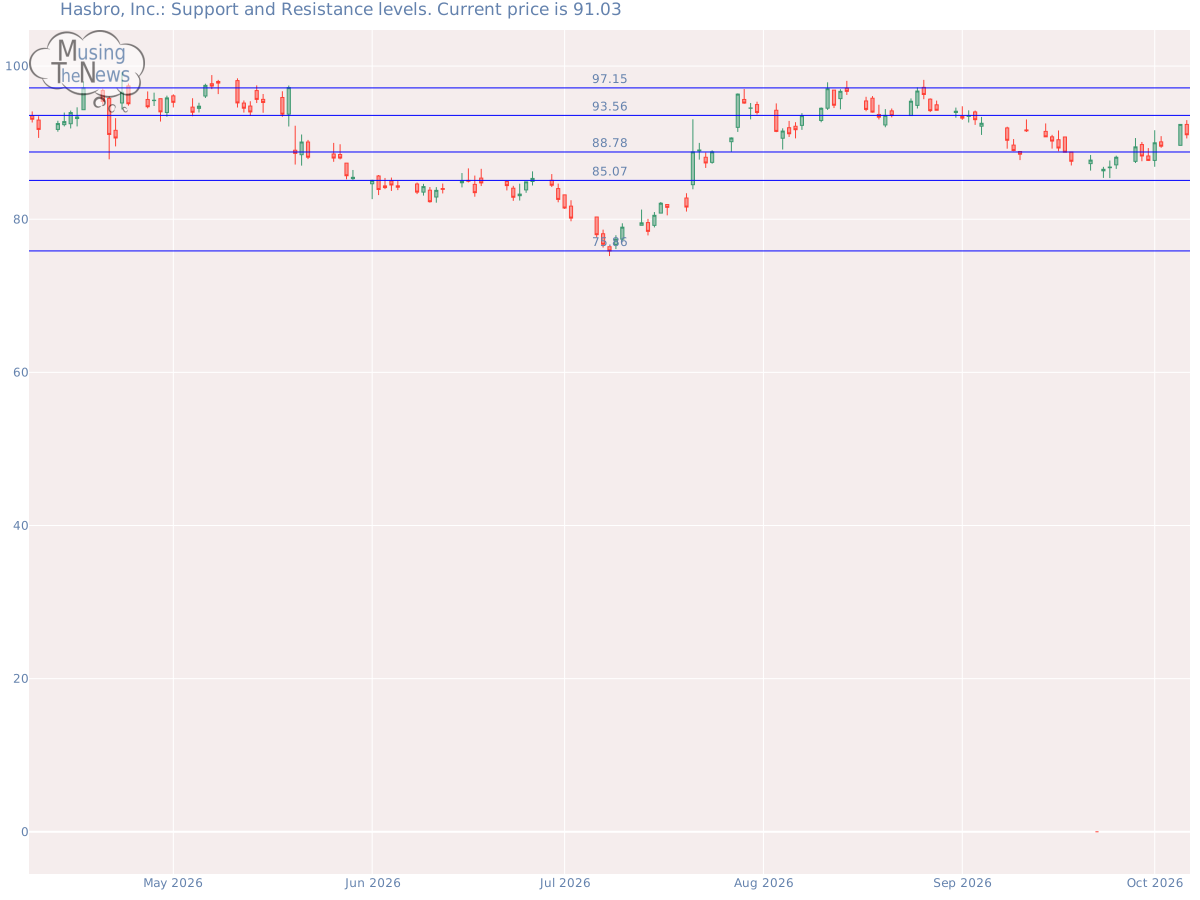
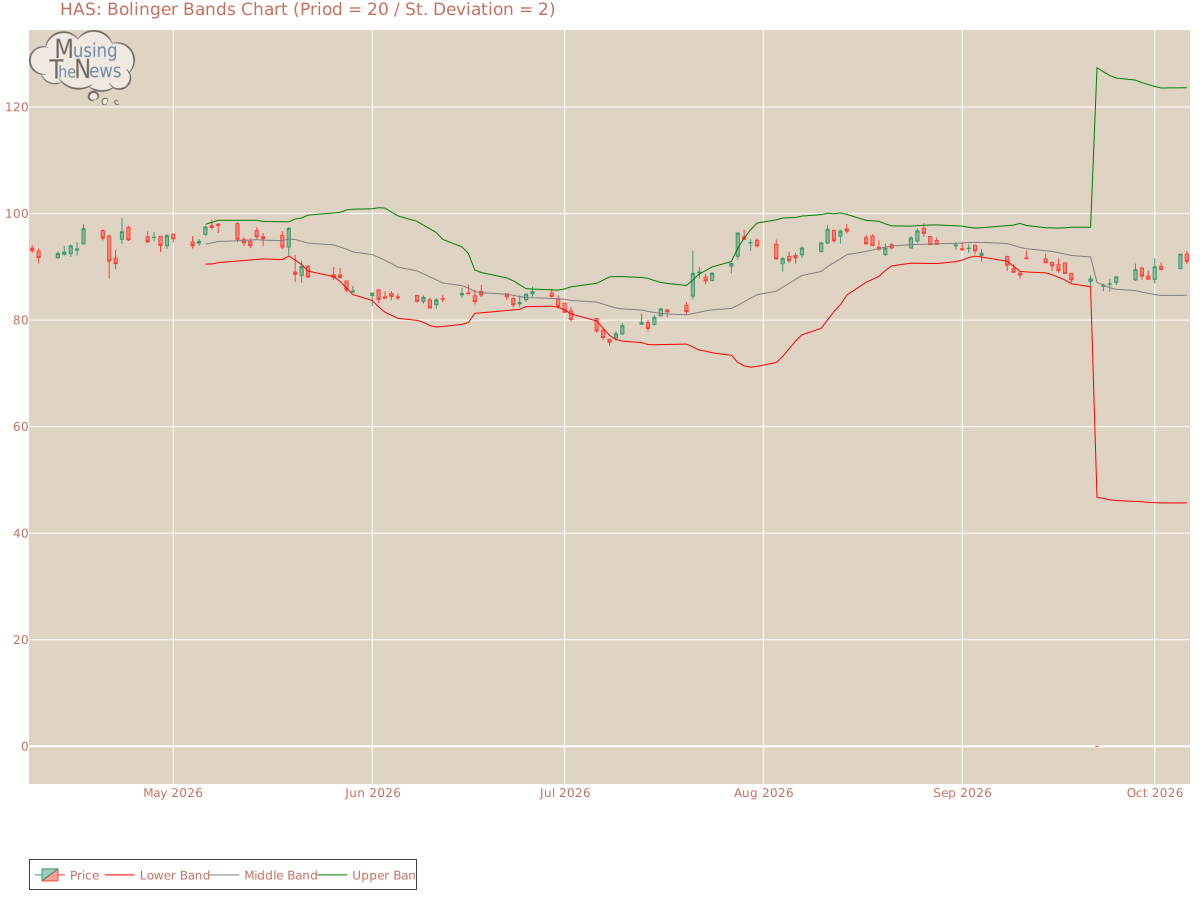
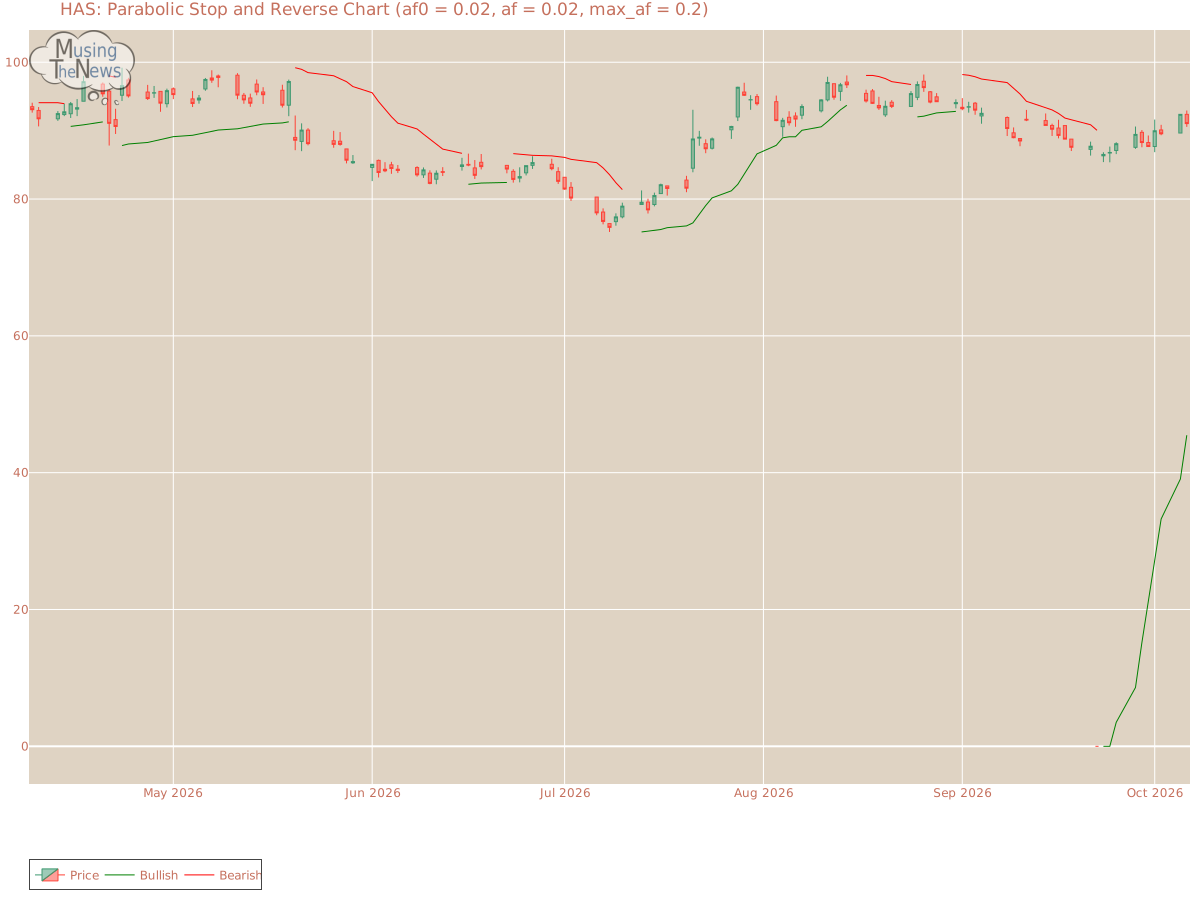
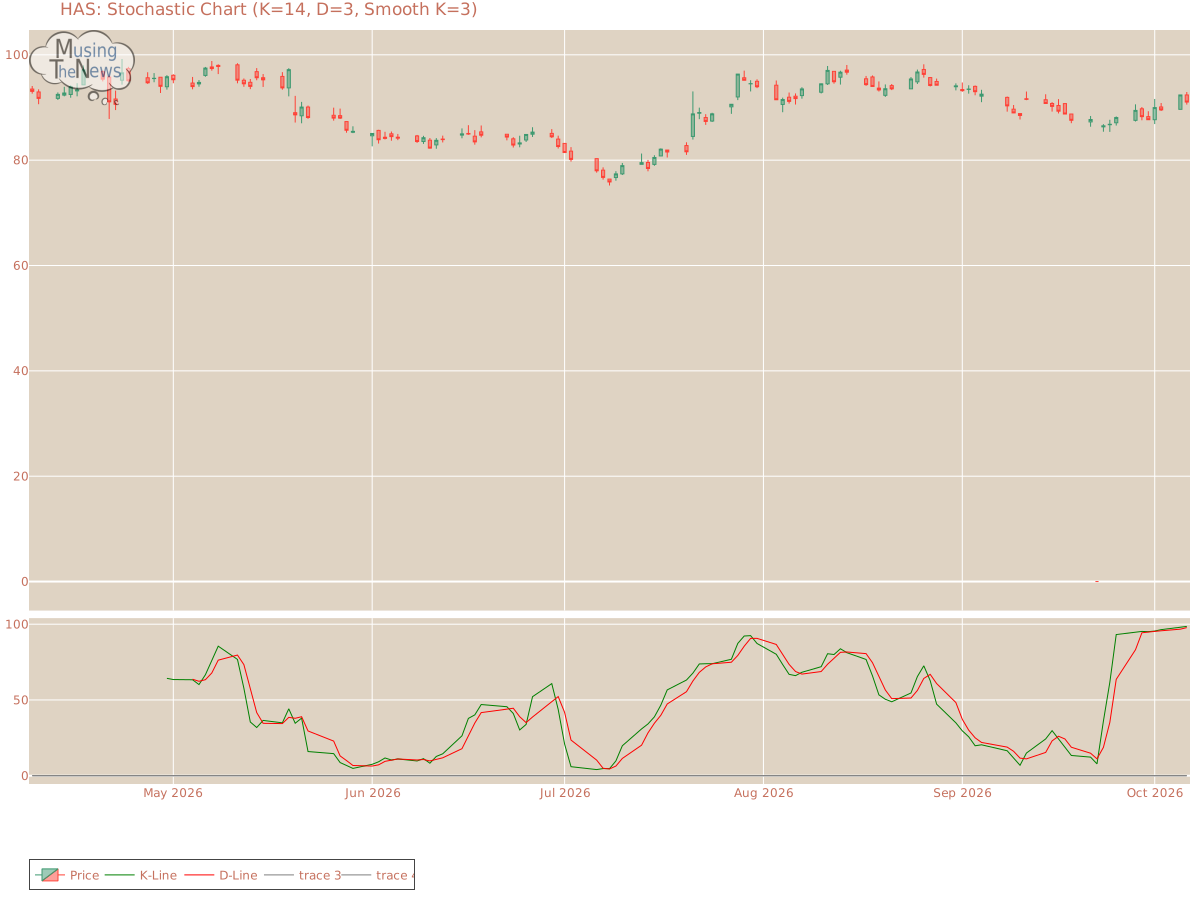
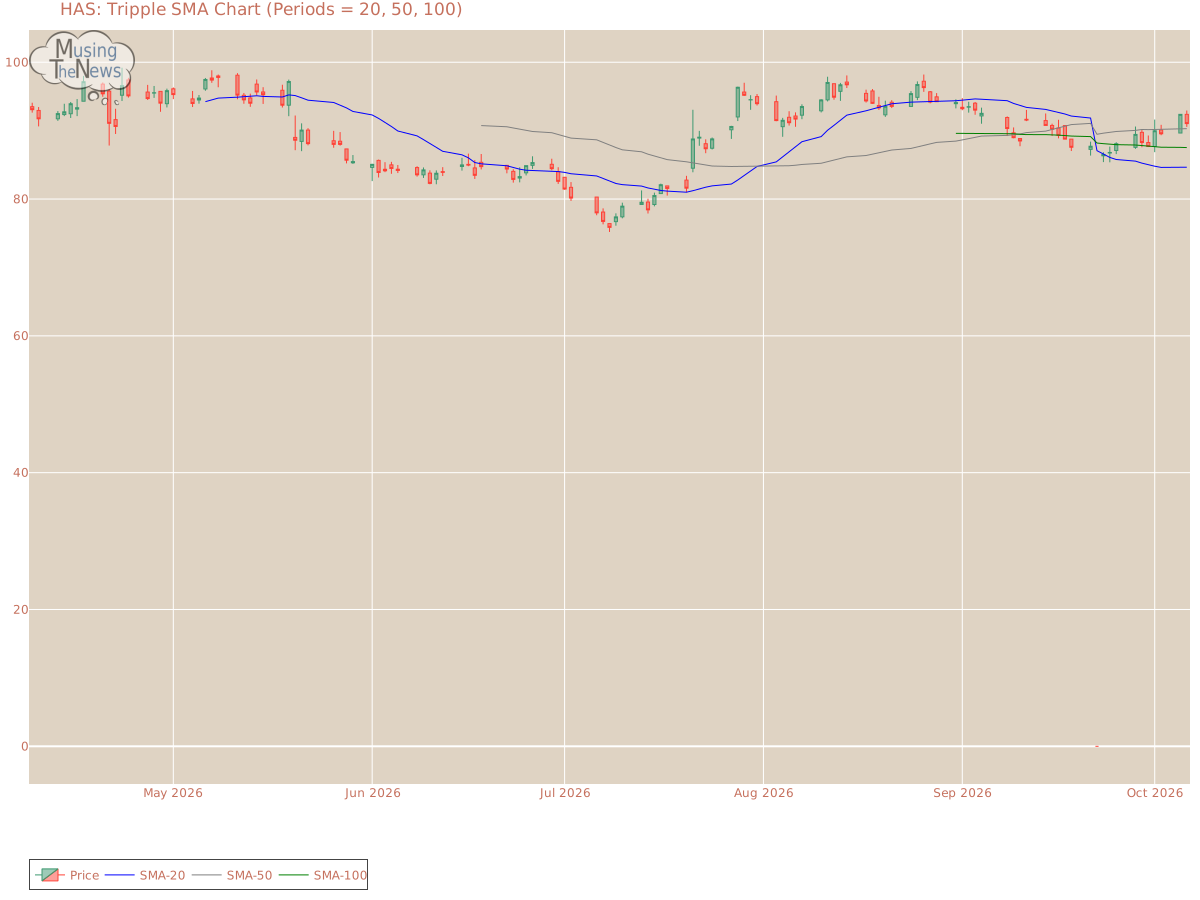
Support and Resistance: At 91.03, the price for HAS is supported at 88.78 and resisted at 93.56. This indicates a trading range where 88.78 serves as a support level, potentially preventing further decline, while 93.56 could limit upward movement.Support/Resistance for HASAroon: Aroon's bullish trend is ongoing, with Aroon Up consistently at the 100 level. While this suggests strong market momentum, it's important to analyze this trend further with other indicators to gain a comprehensive understanding of the market's direction.Aroon chart for Hasbro, Inc.Bol. Bands: The BOLL BANDS is currently neutral, offering no clear guidance on market direction. This suggests that the market may be in a state of pause, with no strong trend emerging.Bolinger Bands chart for Hasbro, Inc.Parabolic SAR: The PSAR continues to be bullish for HAS, setting a strong support level that could sustain the ongoing upward trend. This level of support indicates that the market is likely to continue its positive trajectory, offering a base for continued bullish movement.Parabolic Stop and Reverse chart for Hasbro, Inc.Stochastic: The stochastic indicator is currently bullish, with the K-line exceeding both the D-line and the 80 level. This configuration indicates robust upward momentum, suggesting that the market may experience further gains. Investors may interpret this as a positive signal for continued upward movement.Stochastic chart for Hasbro, Inc.Tripple Moving Agerage: The Tripple MOVING AVG is currently neutral, showing no clear bias toward an upward or downward trend. This suggests that the market may be in a phase of indecision or consolidation.Tripple SMA chart for Hasbro, Inc. The technical analysis of a company's stock performance is valuable, but only when considered in conjunction with the company's fundamentals. These fundamentals, including financial strength, earnings growth, and leadership, provide a foundation for understanding market movements. Additionally, industry trends and competitive pressures play an important role. By integrating both fundamental and technical analysis, one can better evaluate the company's true potential and make more informed investment decisions.