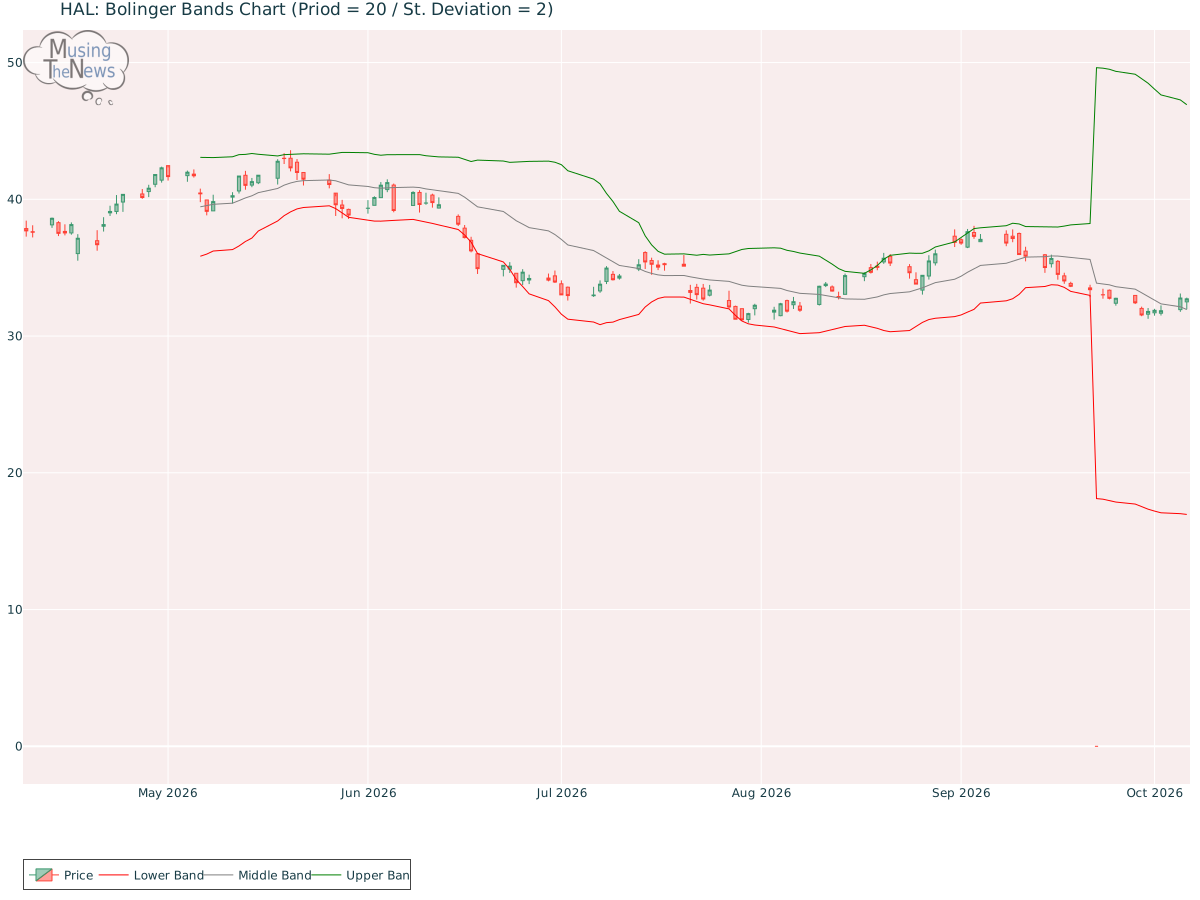
The current state of the BOLL BANDS is neutral, providing no clear signals for either an upward or downward movement. This indicates that the market may be in a state of eq...
By MusingTheNews
Updated 2026-10-07 23:26:21
Overall Technical outlook
Price Summary
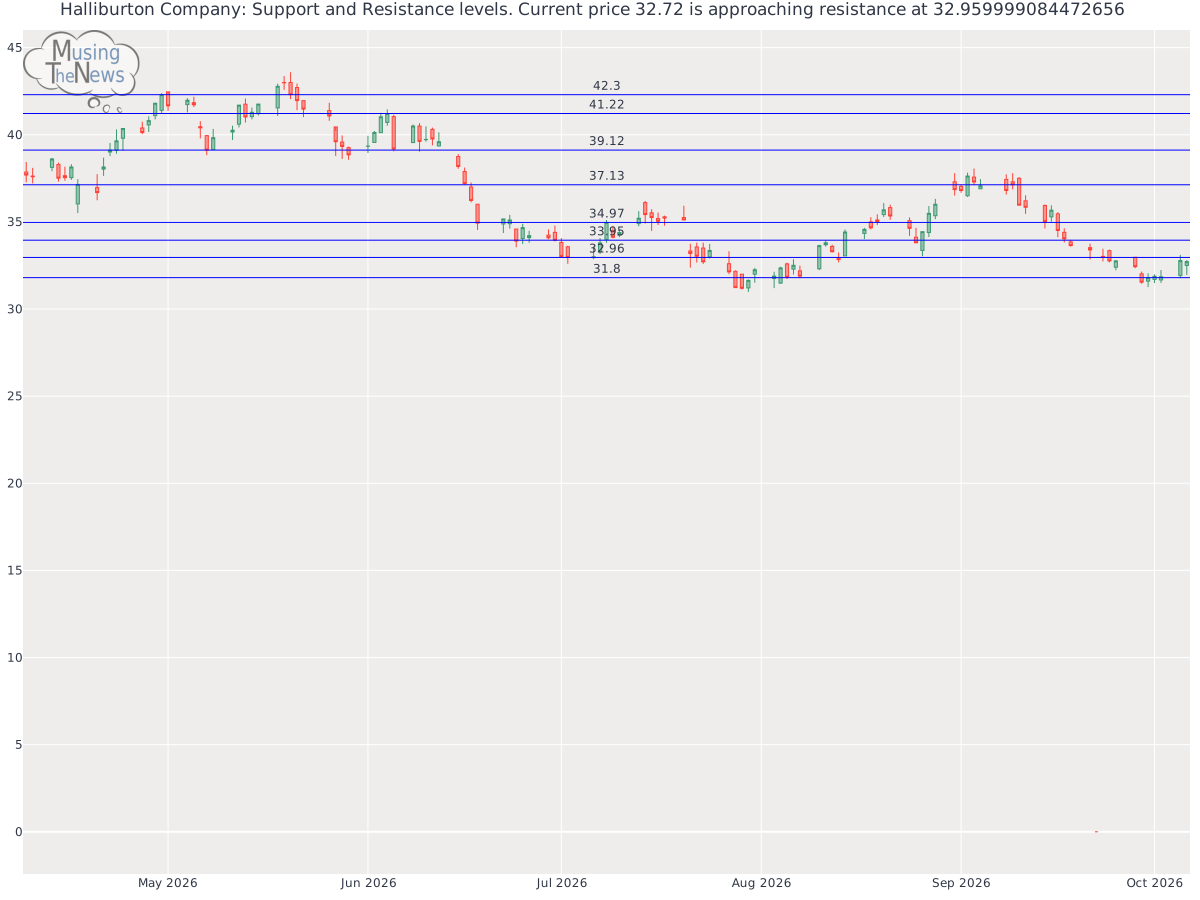
On 2026-10-06, HAL's stock started at 32.5, reached a high of 32.81, fell to 31.96, and ended 0.68% higher at 32.72, with 6801900 shares traded. In the last 52 weeks, the stock's top price was 42.98 and the bottom price was 0.0.
Technicals
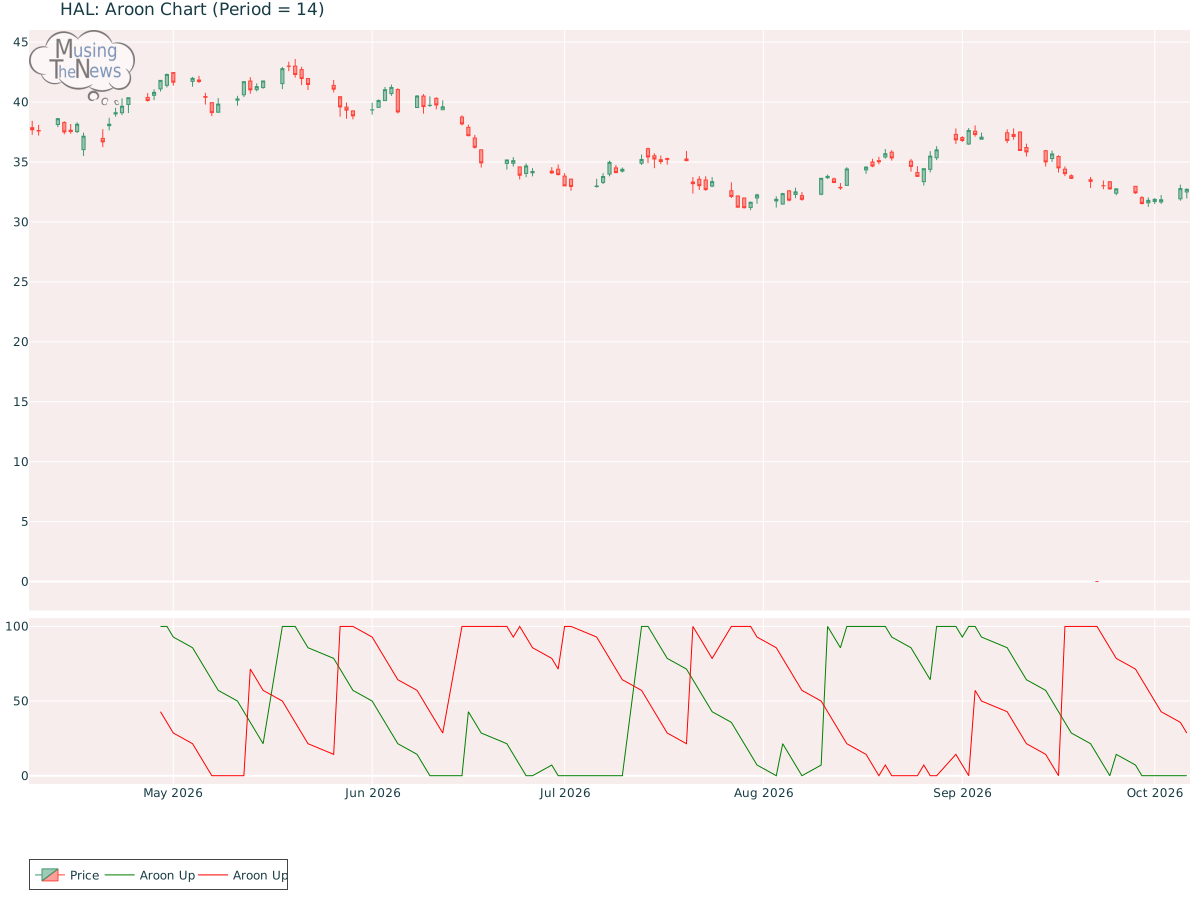
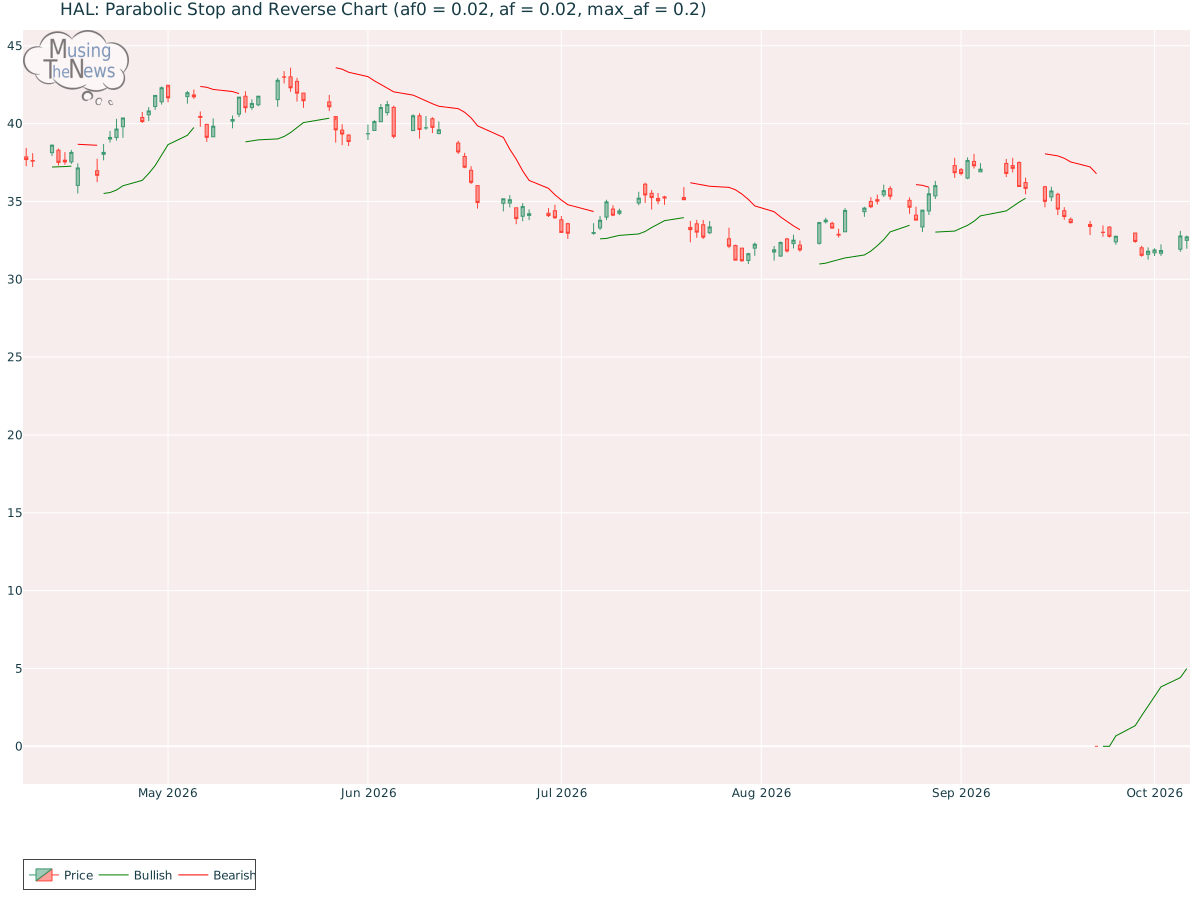
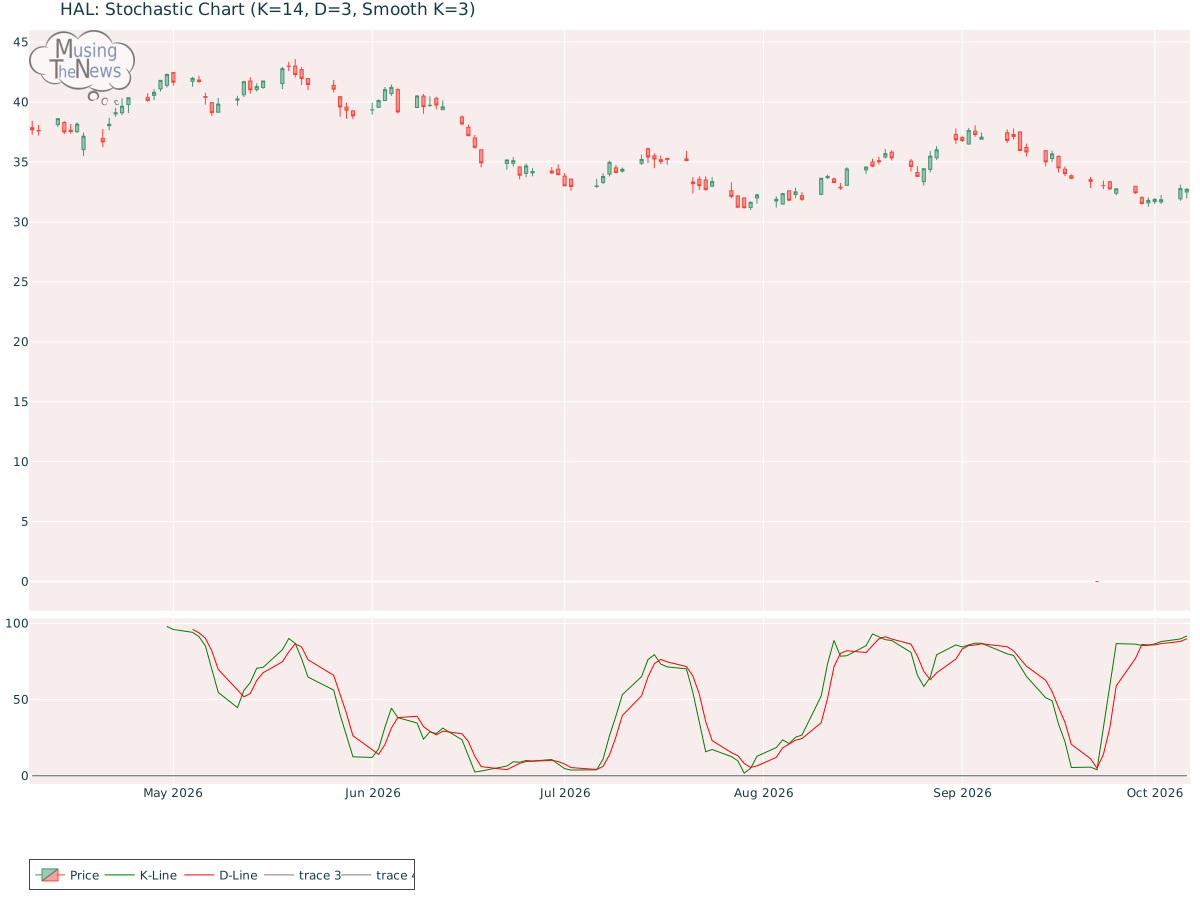
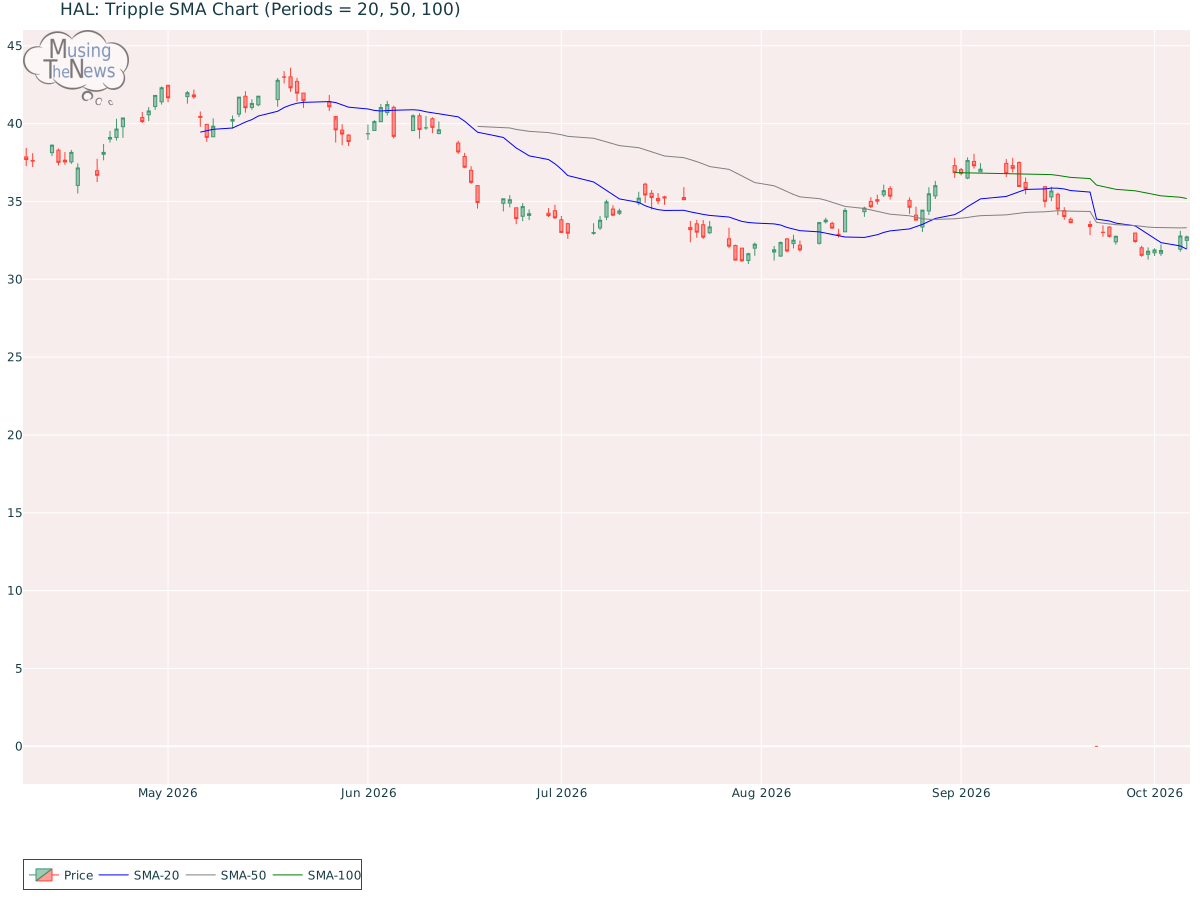
Support and Resistance: The price for HAL at 32.72 is supported by the 31.8 level and faces resistance at 32.96. This range indicates key levels where the price may find buyers near 31.8 and sellers near 32.96, defining a trading range.Support/Resistance for HALAroon: The current state of the AROON is neutral, providing no clear signals for either an upward or downward movement. This indicates that the market may be in a state of equilibrium, with no strong momentum in either direction.Aroon chart for Halliburton CompanyBol. Bands: The current state of the BOLL BANDS is neutral, providing no clear signals for either an upward or downward movement. This indicates that the market may be in a state of equilibrium, with no strong momentum in either direction.Bolinger Bands chart for Halliburton CompanyParabolic SAR: The PSAR continues to be bullish for HAL, setting a strong support level that could sustain the ongoing upward trend. This level of support indicates that the market is likely to continue its positive trajectory, offering a base for continued bullish movement.Parabolic Stop and Reverse chart for Halliburton CompanyStochastic: With the K-line exceeding both the D-line and the 80 level, the stochastic indicator is showing a bullish signal. This suggests strong upward momentum, indicating that the market may continue to trend higher. Traders could view this as a sign of ongoing strength in the market.Stochastic chart for Halliburton CompanyTripple Moving Agerage: A bullish trend is indicated by the alignment of the 20-50-100 period moving averages for HAL, but this strength is tempered by the slopes of the faster averages, which hint at a possible reversal. The overall trend remains positive, yet the weakening signals from the shorter-term averages suggest that a change in direction may be imminent.Tripple SMA chart for Halliburton Company Understanding a company's fundamentals—such as revenue, earnings, and debt levels—provides a solid foundation for analyzing its technical performance. Similarly, knowledge of the industry, including key competitors and market trends, is critical. Combining this fundamental analysis with technical indicators like stock charts, moving averages, and trading volume enables a more comprehensive approach to evaluating the company's overall health and potential future performance.