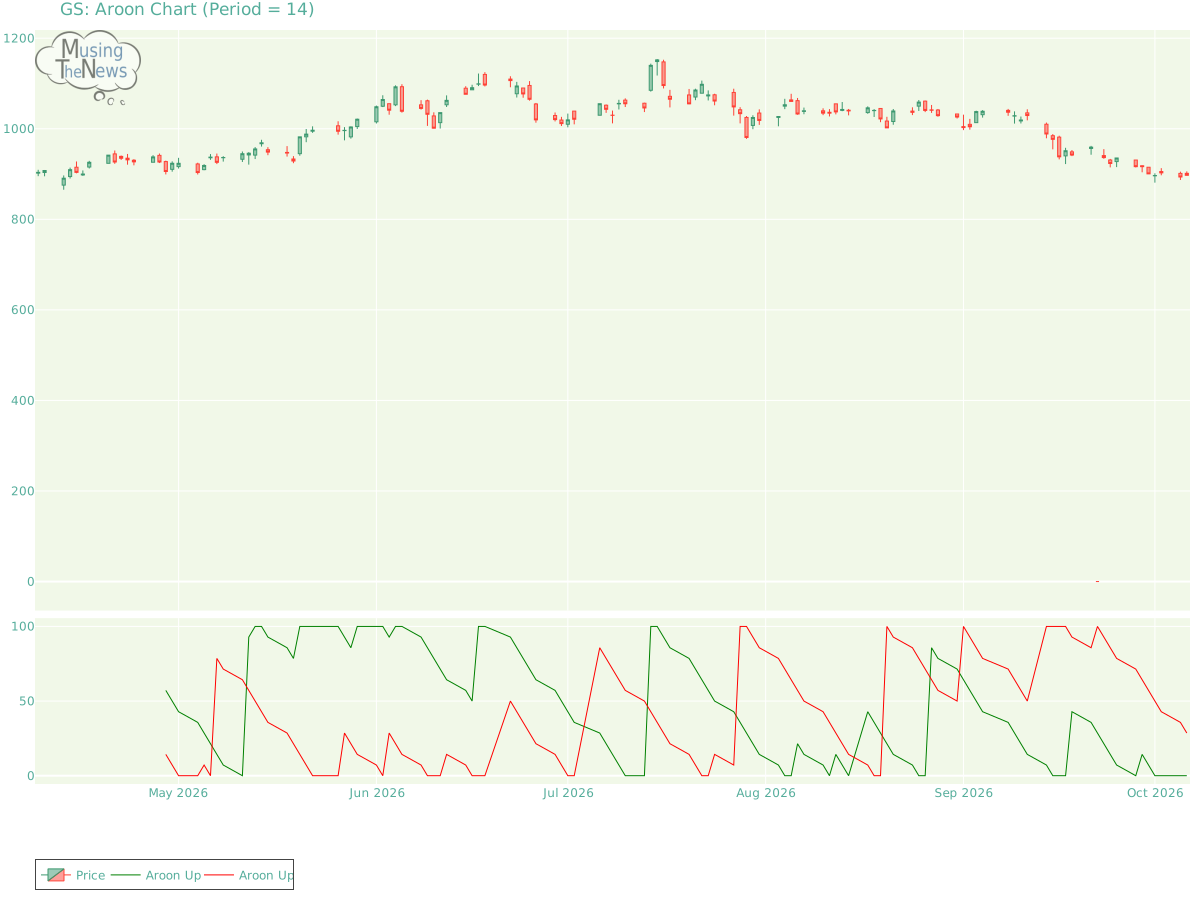
The AROON is neutral, showing no definitive signals of a trend either upward or downward. This neutral stance indicates a period of market indecision, where the direction i...
By MusingTheNews
Updated 2026-10-07 23:26:21
Overall Technical outlook
Price Summary
On 2026-10-06, The Goldman Sachs Group, Inc.'s stock began at 901.57, peaked at 905.94, declined to 896.0, and ended the day -0.49% down at 897.18, with 2048700 shares traded. In the last 52 weeks, the stock's top price was 1152.07 and the bottom price was 0.0.
Technicals
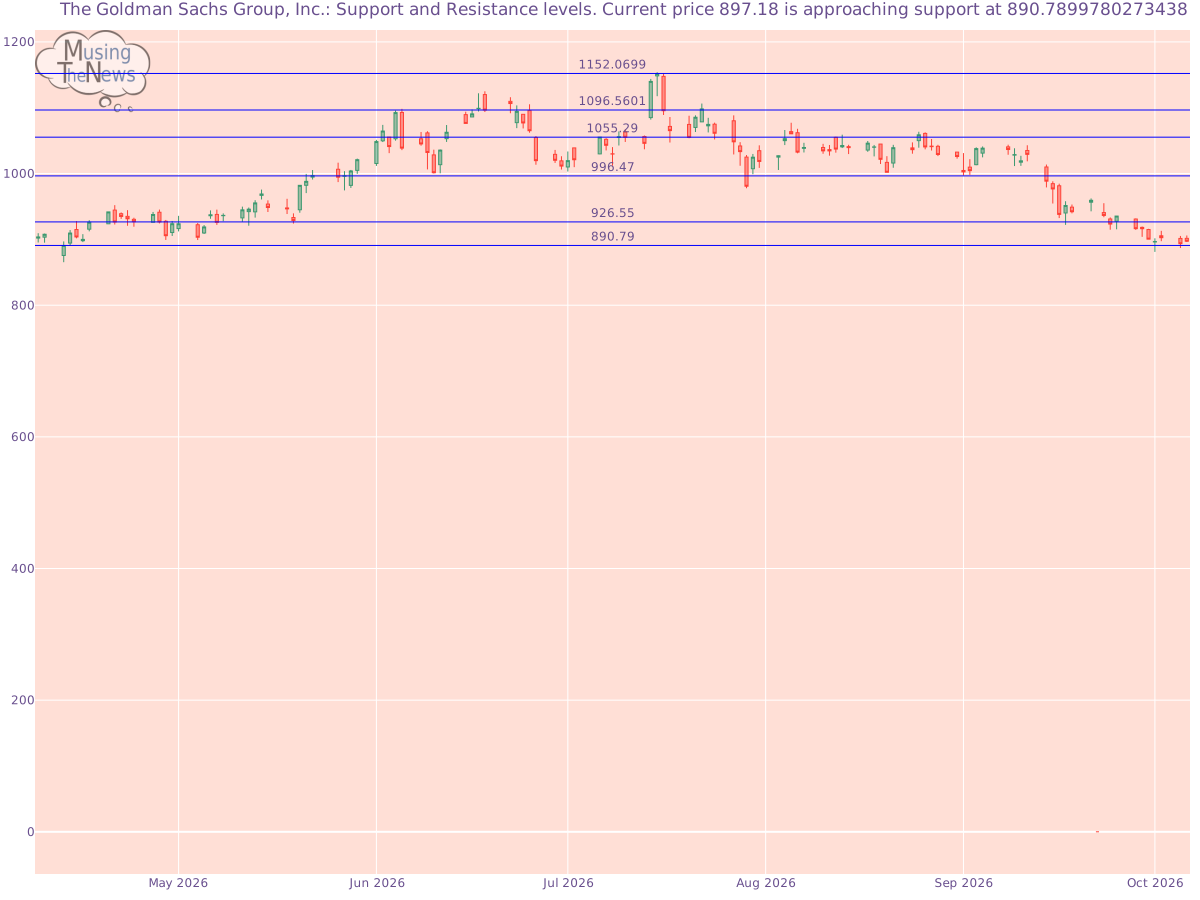
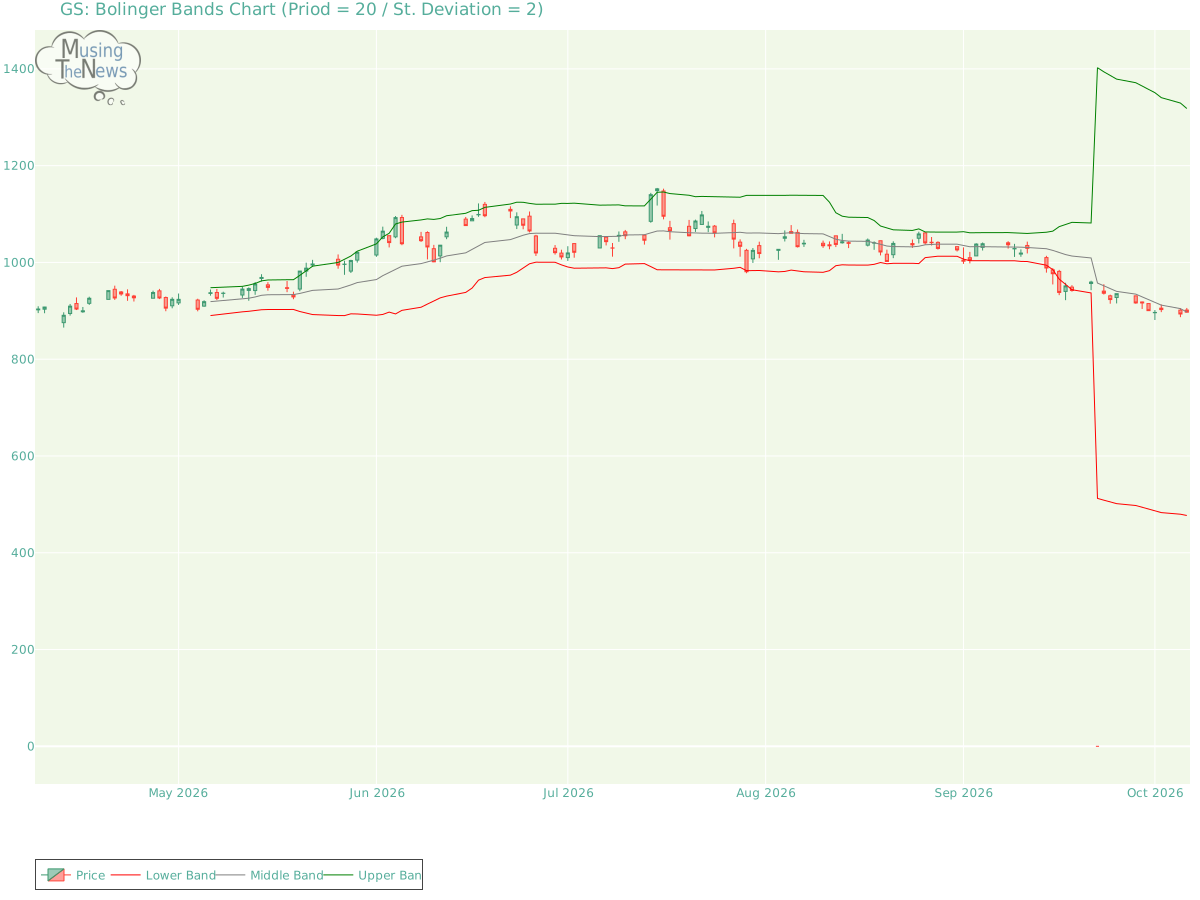
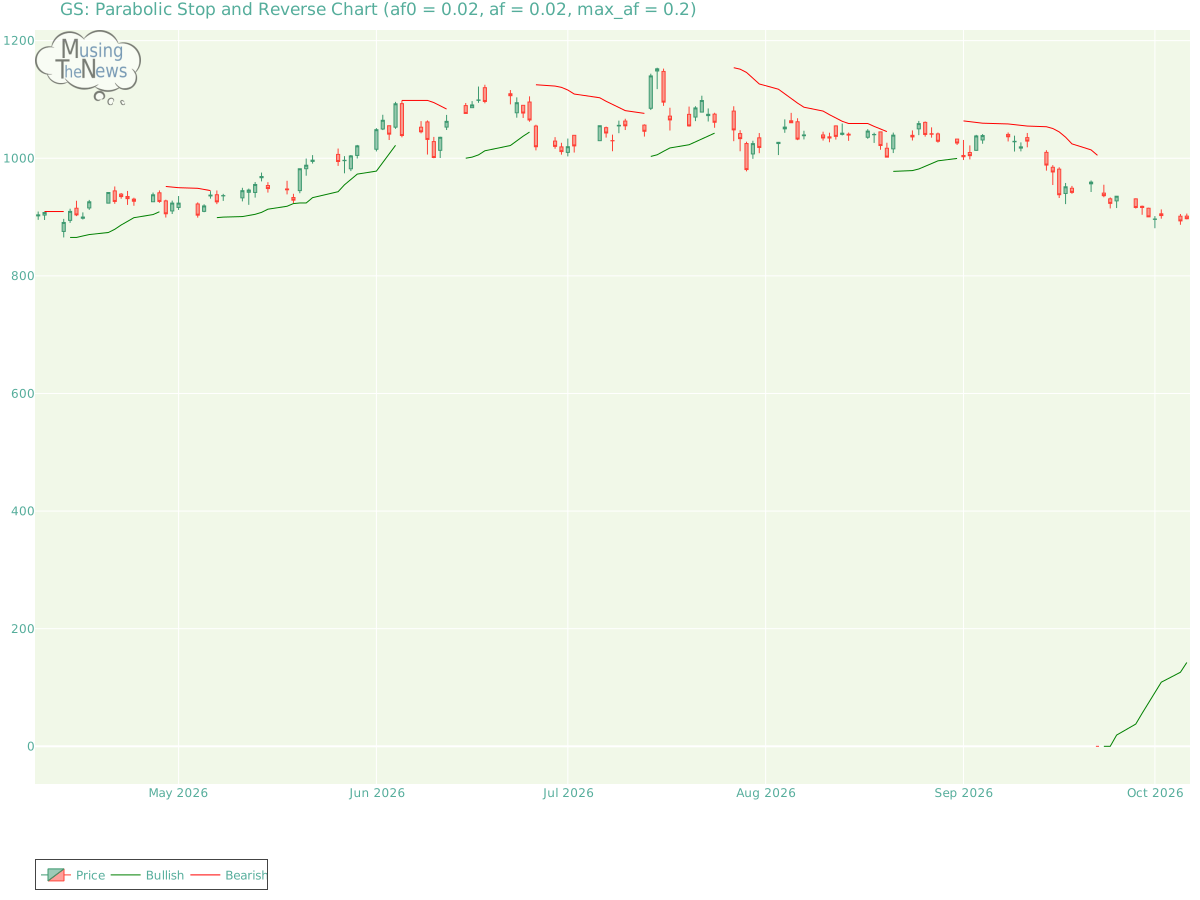
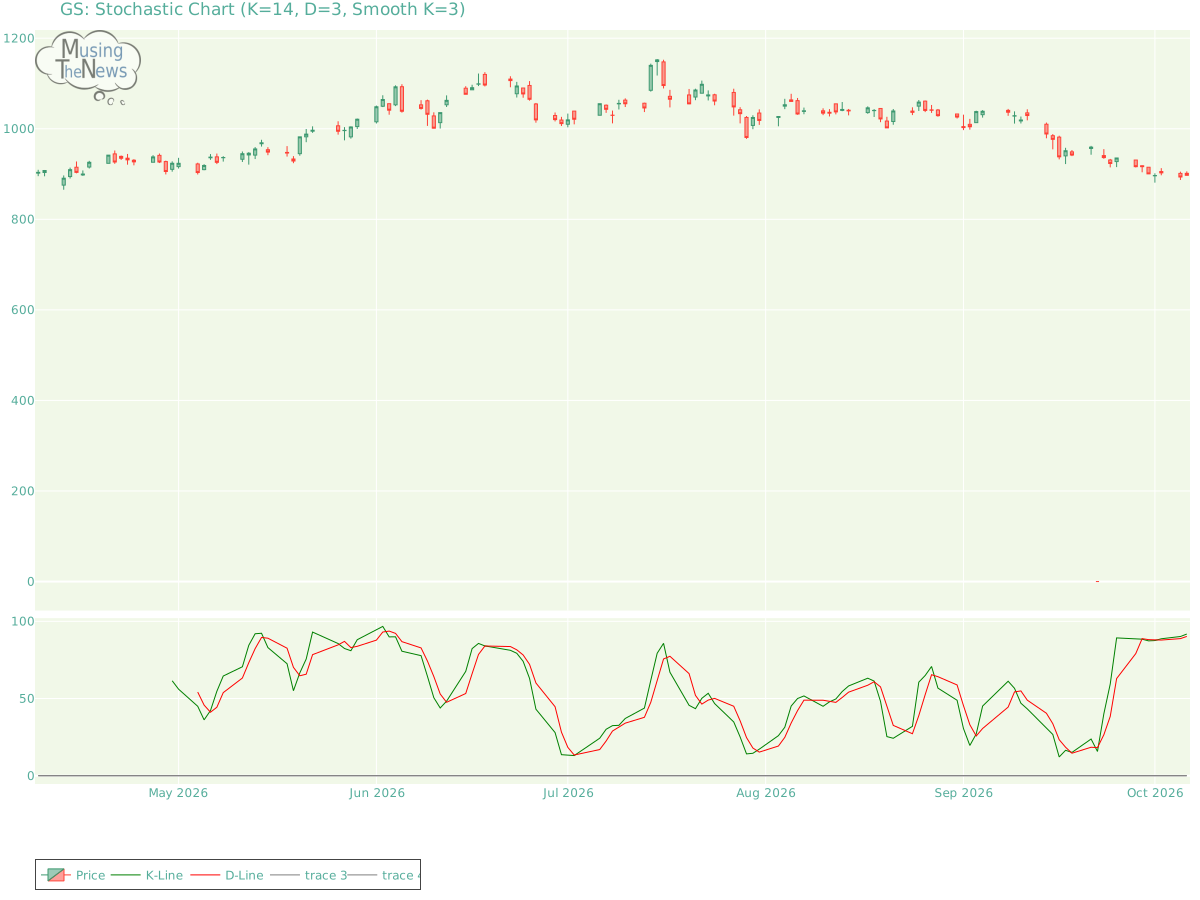
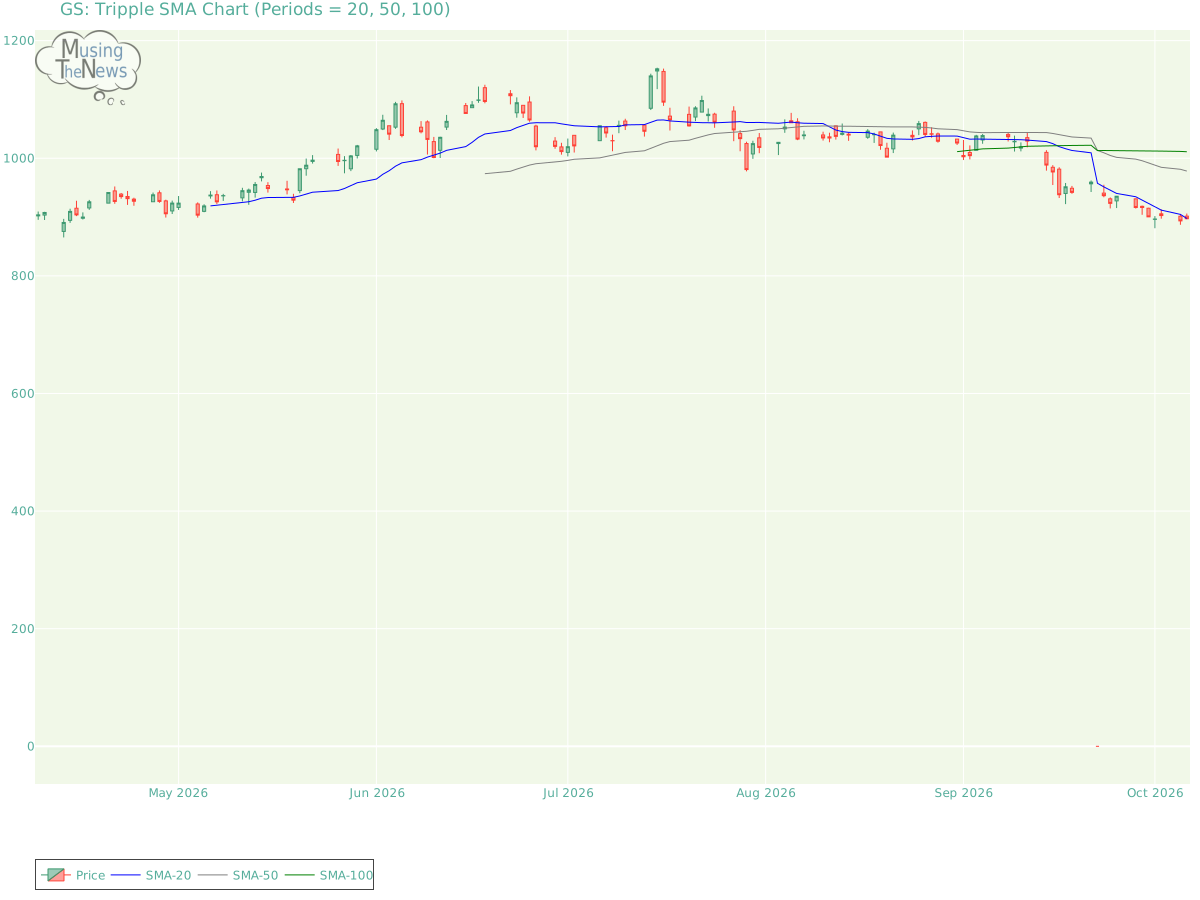
Support and Resistance: The price sits at 897.18, supported by 890.79 and resisted by 926.55. This indicates a trading range where 890.79 provides a floor, preventing declines, and 926.55 acts as a ceiling, limiting further price increases for GS.Support/Resistance for GSAroon: The AROON is neutral, showing no definitive signals of a trend either upward or downward. This neutral stance indicates a period of market indecision, where the direction is unclear.Aroon chart for The Goldman Sachs Group, Inc.Bol. Bands: The BOLL BANDS is in a neutral stance, with no clear signals for movement up or down. This neutral position indicates a potential period of consolidation or uncertainty in the market.Bolinger Bands chart for The Goldman Sachs Group, Inc.Parabolic SAR: The PSAR remains bullish, setting a critical support level that may help sustain the market's upward trend. This persistent bullish outlook suggests that the market is likely to continue climbing, with the support level offering a foundation for further growth.Parabolic Stop and Reverse chart for The Goldman Sachs Group, Inc.Stochastic: The stochastic indicator is in a bullish state, with the K-line crossing above both the D-line and the 80 mark. This alignment suggests strong upward momentum, implying that the market may continue its positive trajectory. Traders may see this as a sign of ongoing strength for The Goldman Sachs Group, Inc..Stochastic chart for The Goldman Sachs Group, Inc.Tripple Moving Agerage: A bullish trend for The Goldman Sachs Group, Inc. is reflected in the alignment of the 20-50-100 period moving averages, though the slopes of the faster averages raise concerns about a potential reversal. The weakening momentum in the shorter-term averages suggests that the current trend may not last, signaling the possibility of a shift in direction.Tripple SMA chart for The Goldman Sachs Group, Inc. Before focusing on a company's technical data, such as stock price movements, it's essential to analyze its fundamentals. These include factors like profitability, cash flow, and debt management. Additionally, considering the broader industry landscape—including market trends, competition, and regulatory changes—offers deeper insights. This comprehensive approach allows for a more meaningful interpretation of the company's technical indicators, providing a clearer picture of its financial health and future prospects.