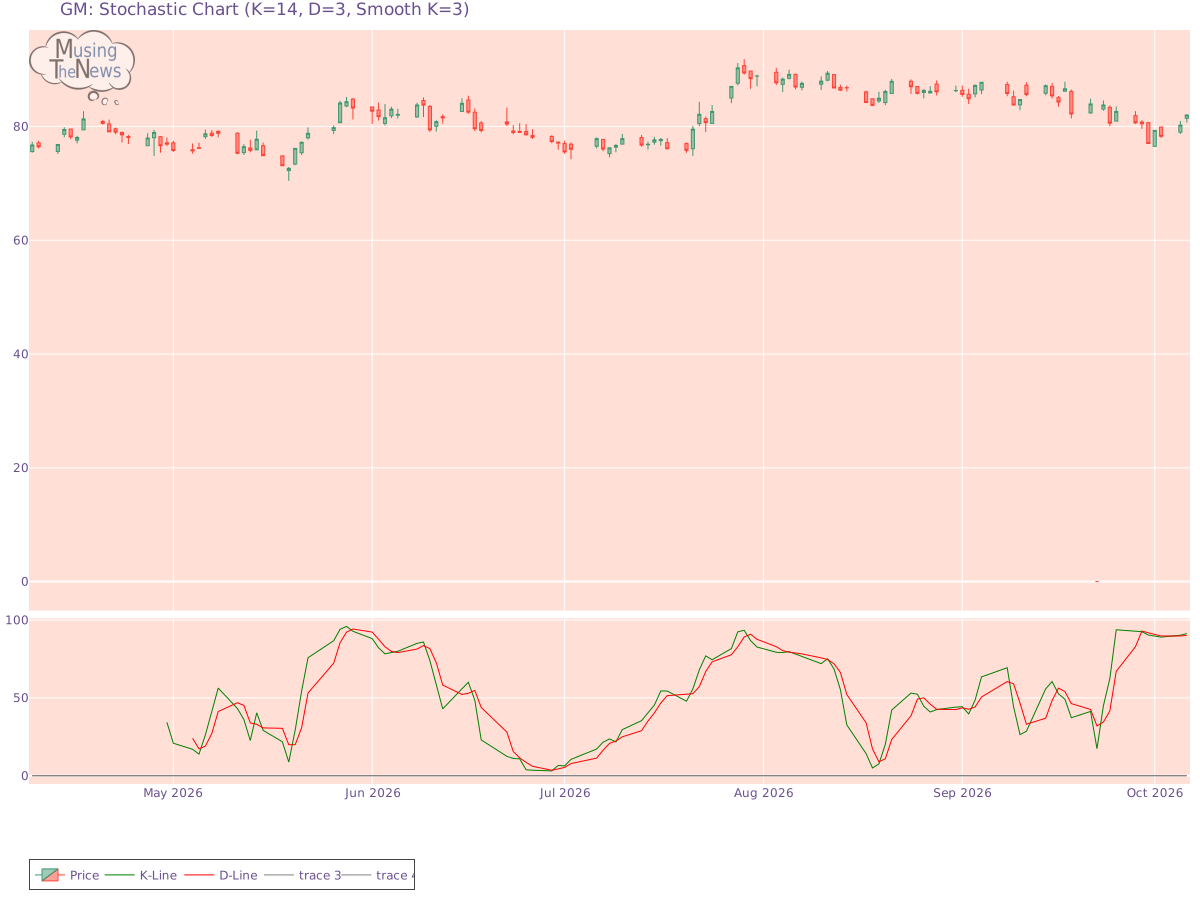
With the K-line above both the D-line and the 80 mark, the stochastic indicator signals a bullish trend. This configuration suggests that the market is experiencing strong ...
By MusingTheNews
Updated 2026-10-07 23:26:20
Overall Technical outlook
Price Summary
On 2026-10-06, GM's stock started at 81.43, reached a high of 82.15, fell to 80.69, and ended 0.71% up at 82.01, with 5209600 shares traded. During the past 52 weeks, the highest stock price was 90.3, and the lowest was 0.0.
Technicals
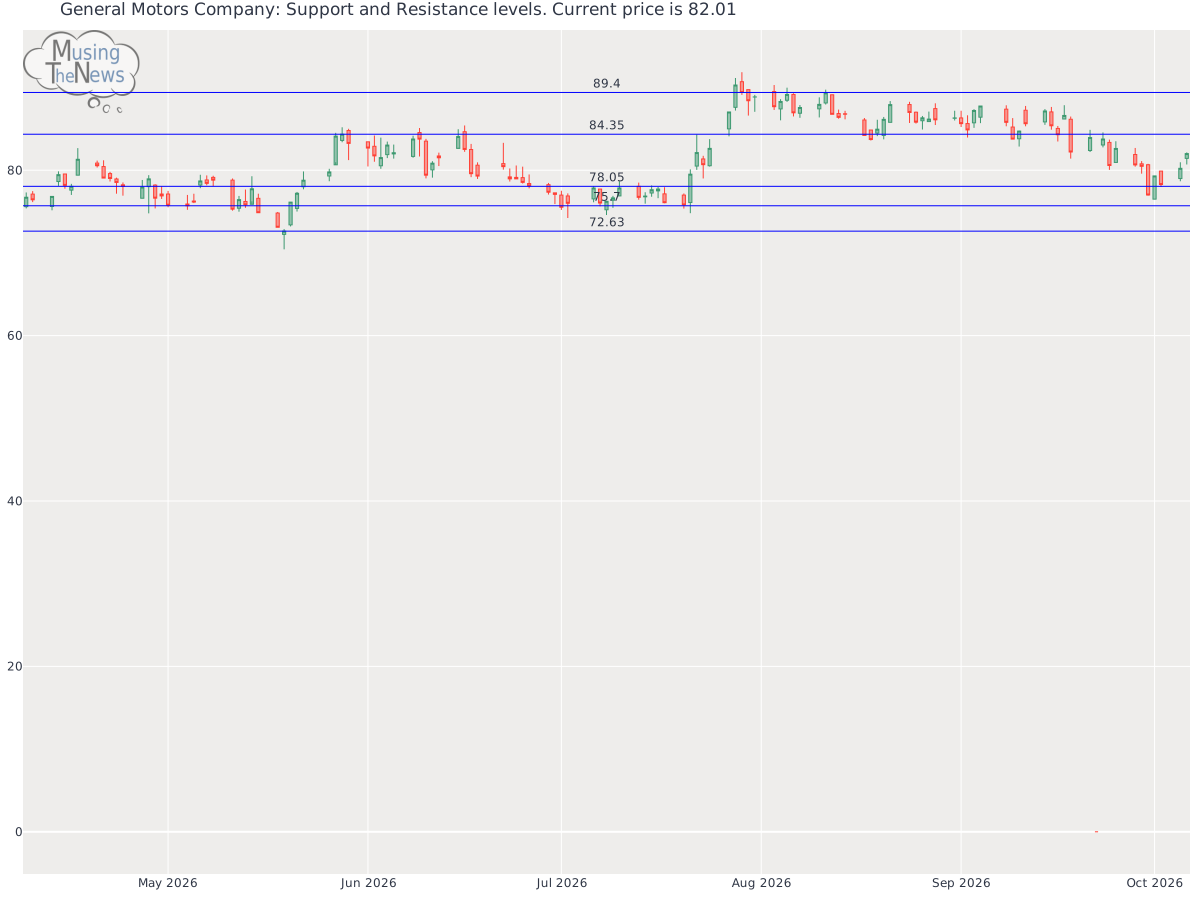
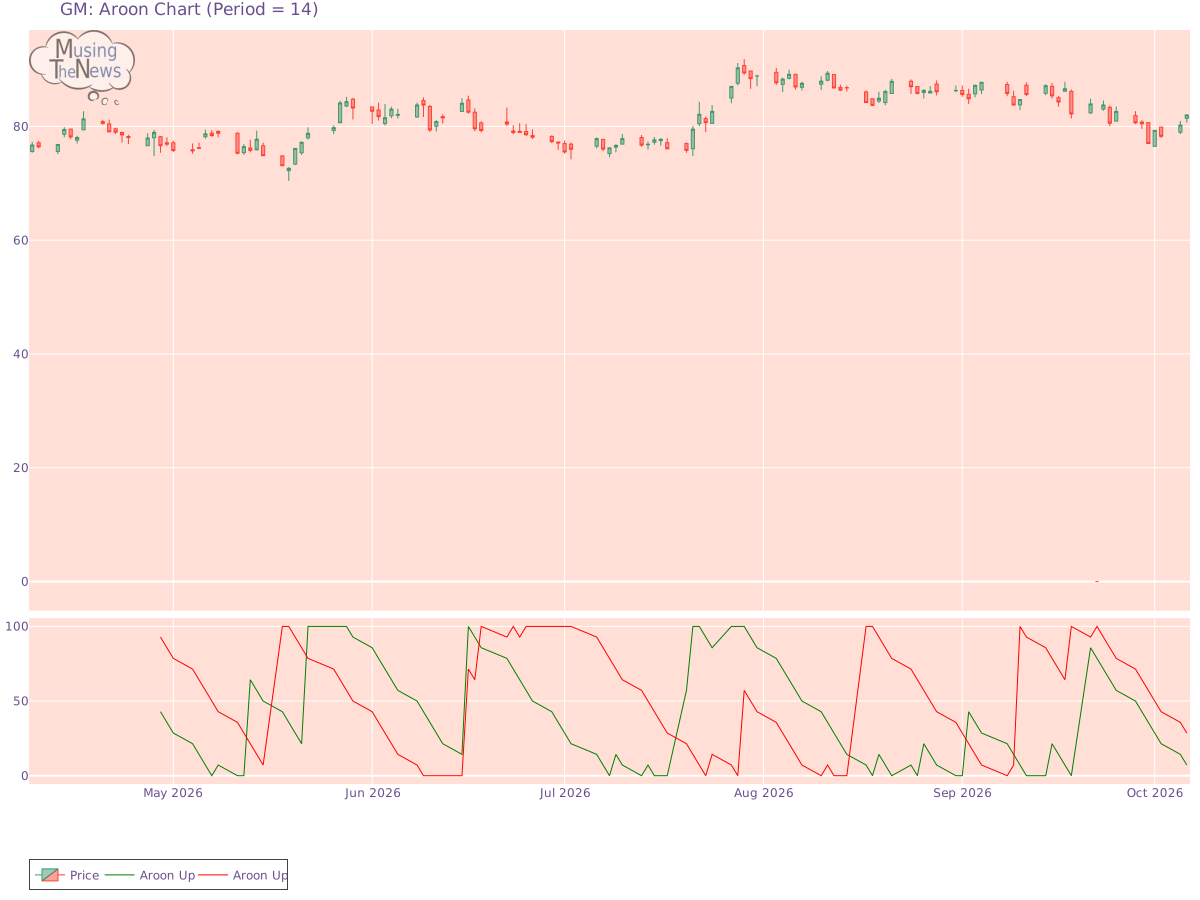
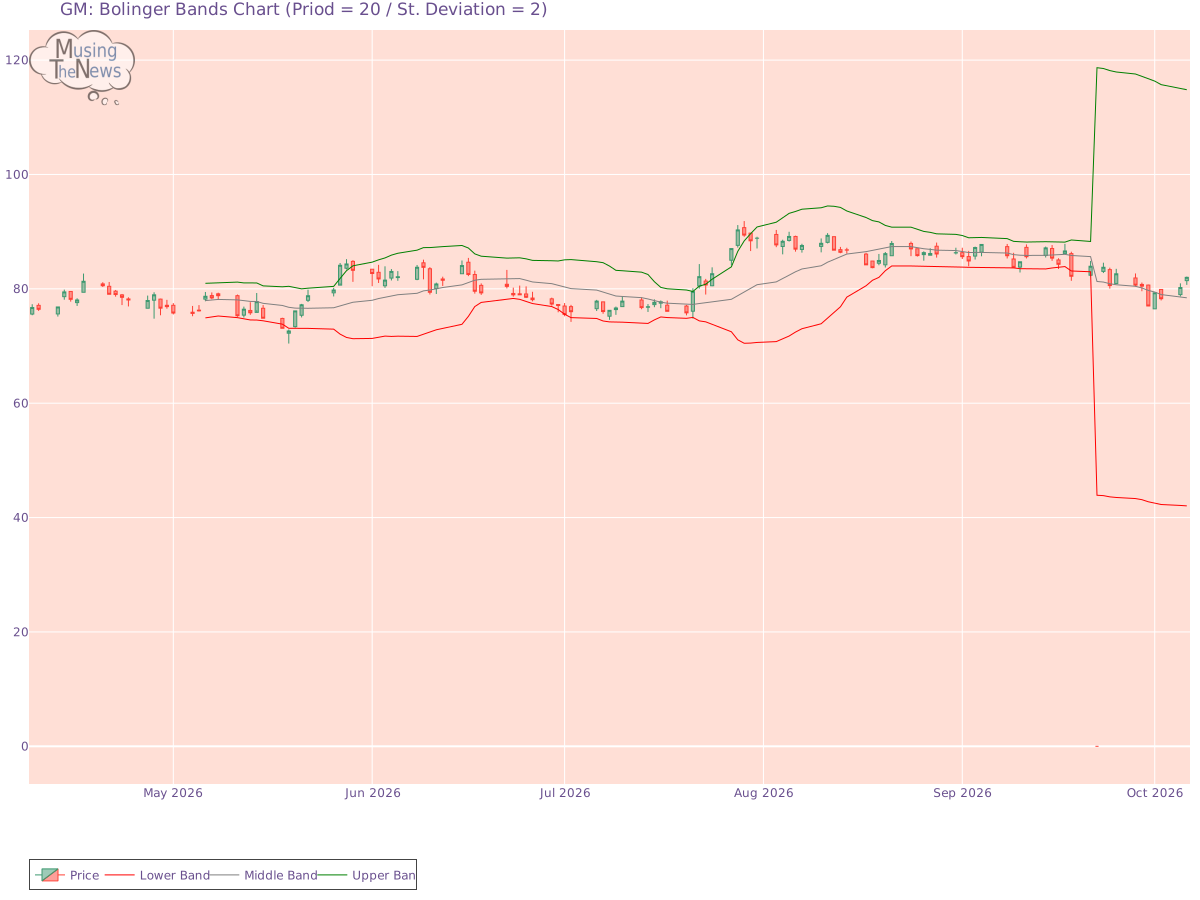
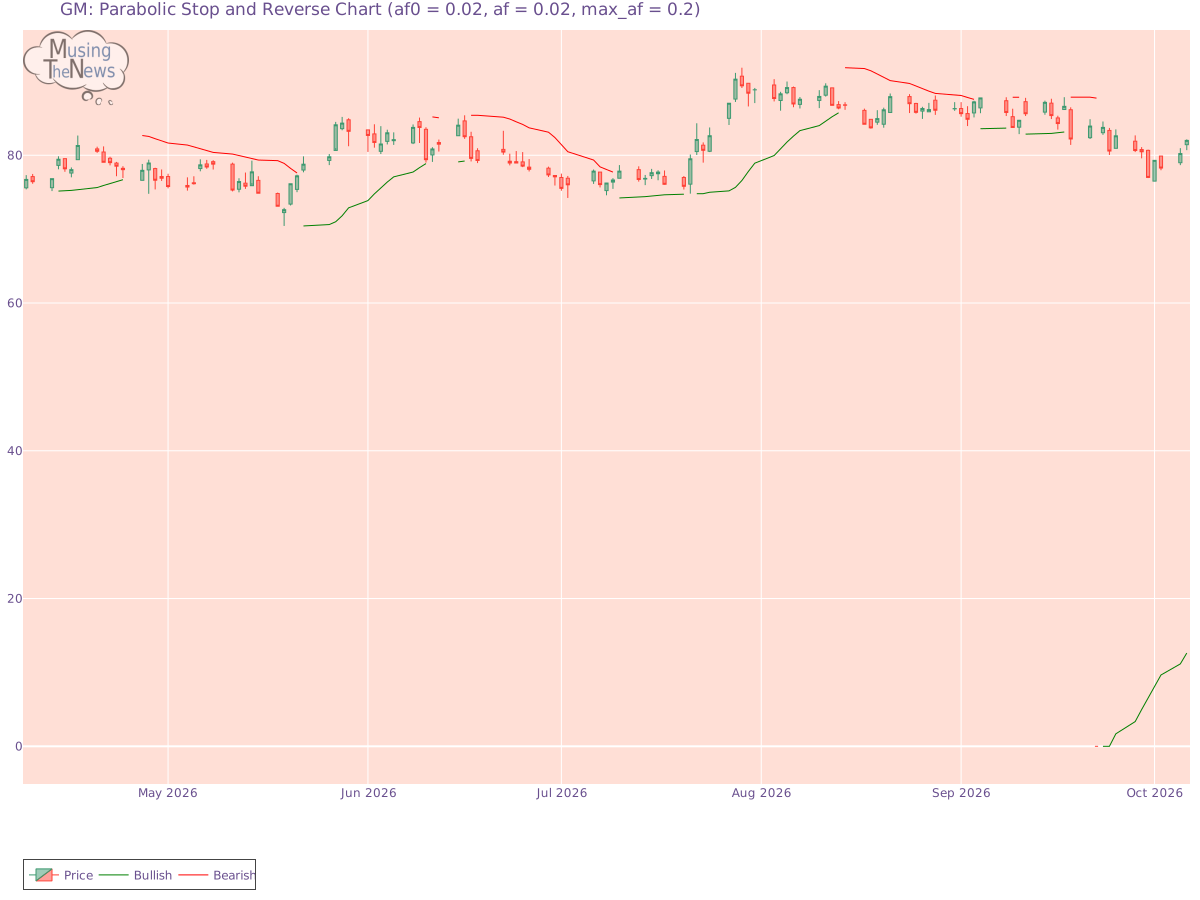
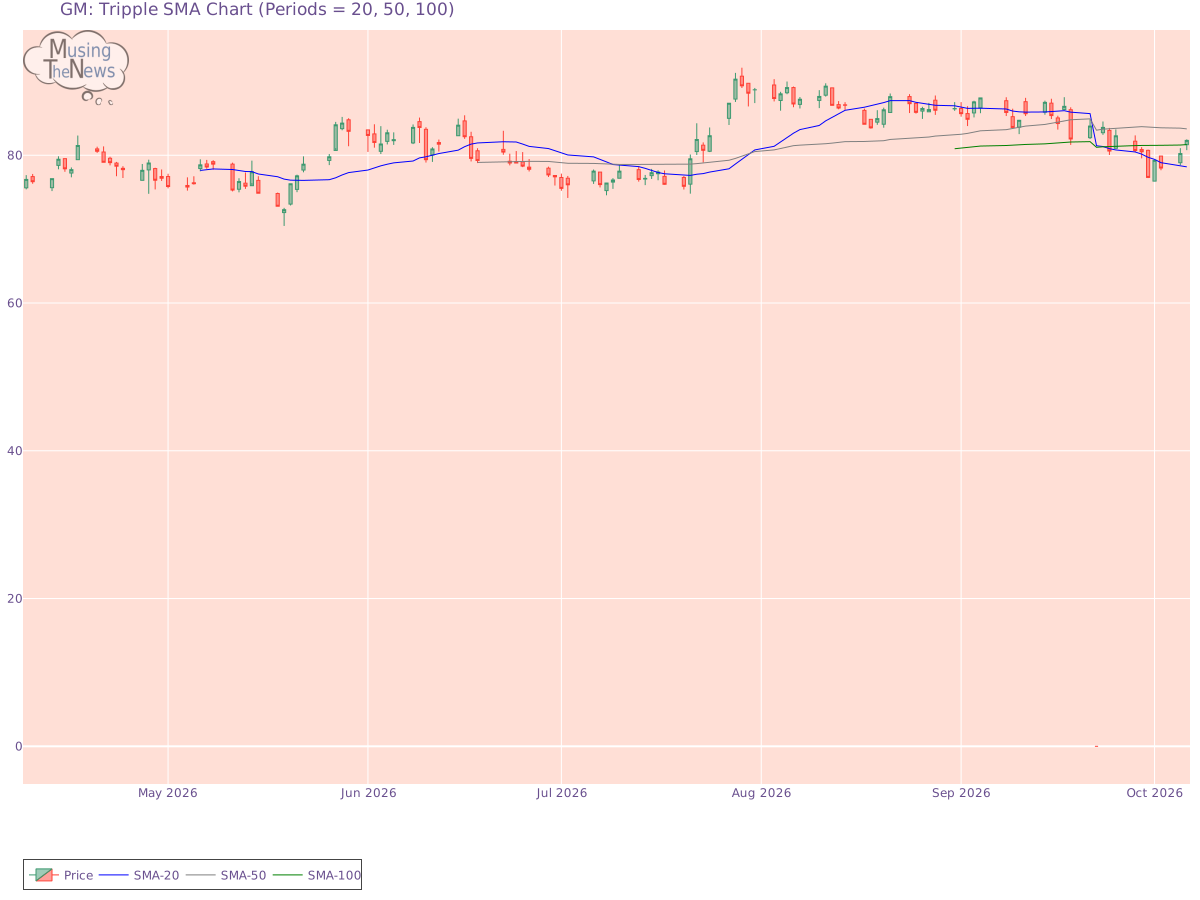
Support and Resistance: The current price sits at 82.01, supported at 78.05 and capped by resistance at 84.35. These levels define a range for GM where the price might stabilize, with 78.05 as a floor and 84.35 as a ceiling.Support/Resistance for GMAroon: The AROON is currently neutral, showing no clear bias toward an upward or downward trend. This suggests that the market may be in a phase of indecision or consolidation.Aroon chart for General Motors CompanyBol. Bands: The BOLL BANDS is currently neutral, offering no clear guidance on market direction. This suggests that the market may be in a state of pause, with no strong trend emerging.Bolinger Bands chart for General Motors CompanyParabolic SAR: The PSAR for GM maintains its bullish outlook, setting a strong support level that could underpin further gains. This suggests that the market is likely to continue its upward trajectory, with the established support providing a safety net for ongoing bullish momentum.Parabolic Stop and Reverse chart for General Motors CompanyStochastic: With the K-line above both the D-line and the 80 mark, the stochastic indicator signals a bullish trend. This configuration suggests that the market is experiencing strong upward momentum, likely leading to further gains. Investors may see this as a favorable condition for potential growth.Stochastic chart for General Motors CompanyTripple Moving Agerage: The Tripple MOVING AVG is currently in a neutral position, offering no clear indication of movement up or down. This suggests that the market may be experiencing a period of equilibrium, with no strong trend in play.Tripple SMA chart for General Motors Company A thorough analysis of a company involves looking beyond its stock price movements and trading patterns. You must also examine its fundamentals, which include profitability, growth prospects, and competitive advantages. Additionally, the industry in which the company operates provides important context, as factors like technological innovations, regulation, and market demand influence performance. By integrating this information with technical analysis, more accurate predictions about the company's future can be made.