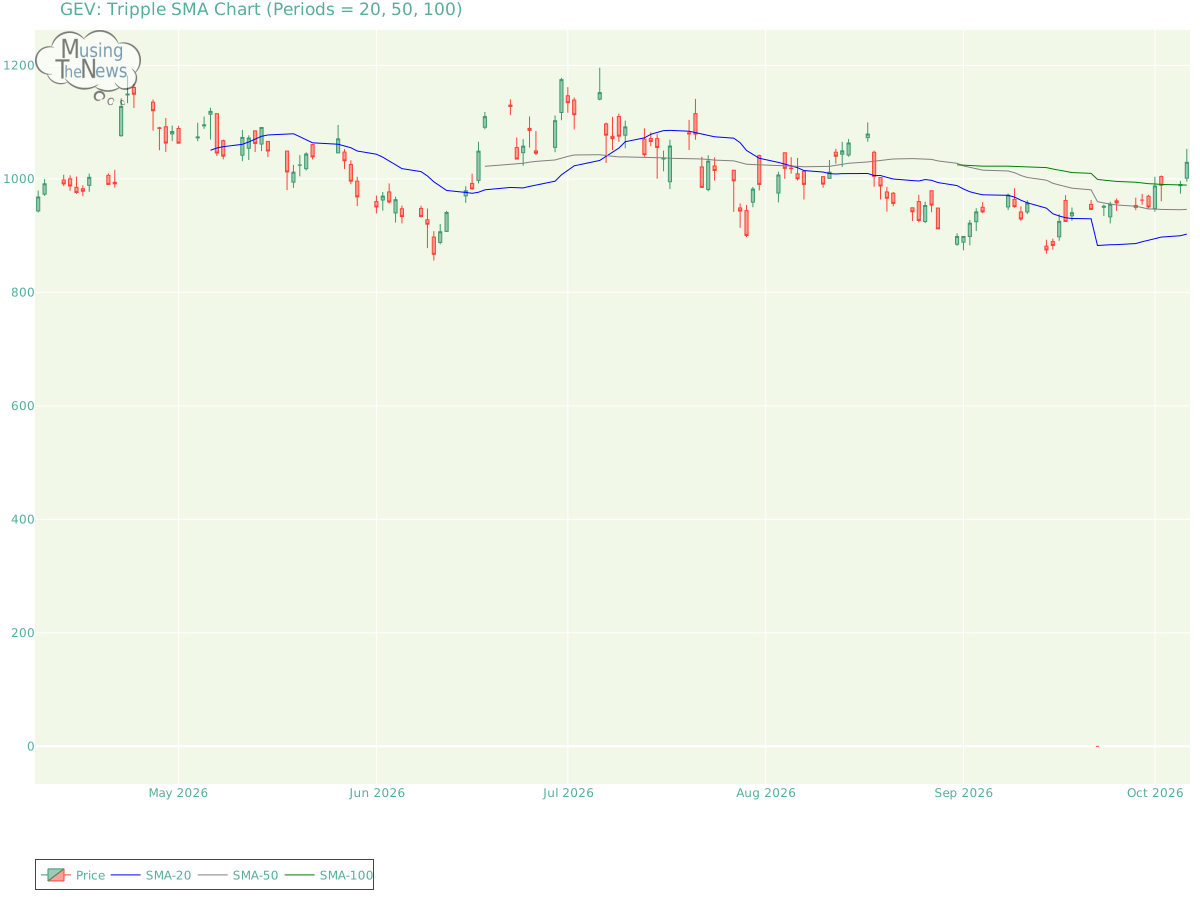
The current reading of the Tripple MOVING AVG is neutral for GEV, with no clear signals for an upward or downward trend. This indicates that the market may be in a state of...
By MusingTheNews
Updated 2026-10-07 23:26:19
Overall Technical outlook
Price Summary
The stock of GE Vernova Inc. experienced a 2.78% rise, showcasing a phenomenal market performance. On 2026-10-06, GEV's stock started at 1001.35, reached a high of 1052.78, fell to 995.05, and ended 2.78% up at 1029.21, with 2528000 shares traded. The stock reached its highest price of 1174.86 and its lowest price of 0.0 during the 52-week period.
Technicals
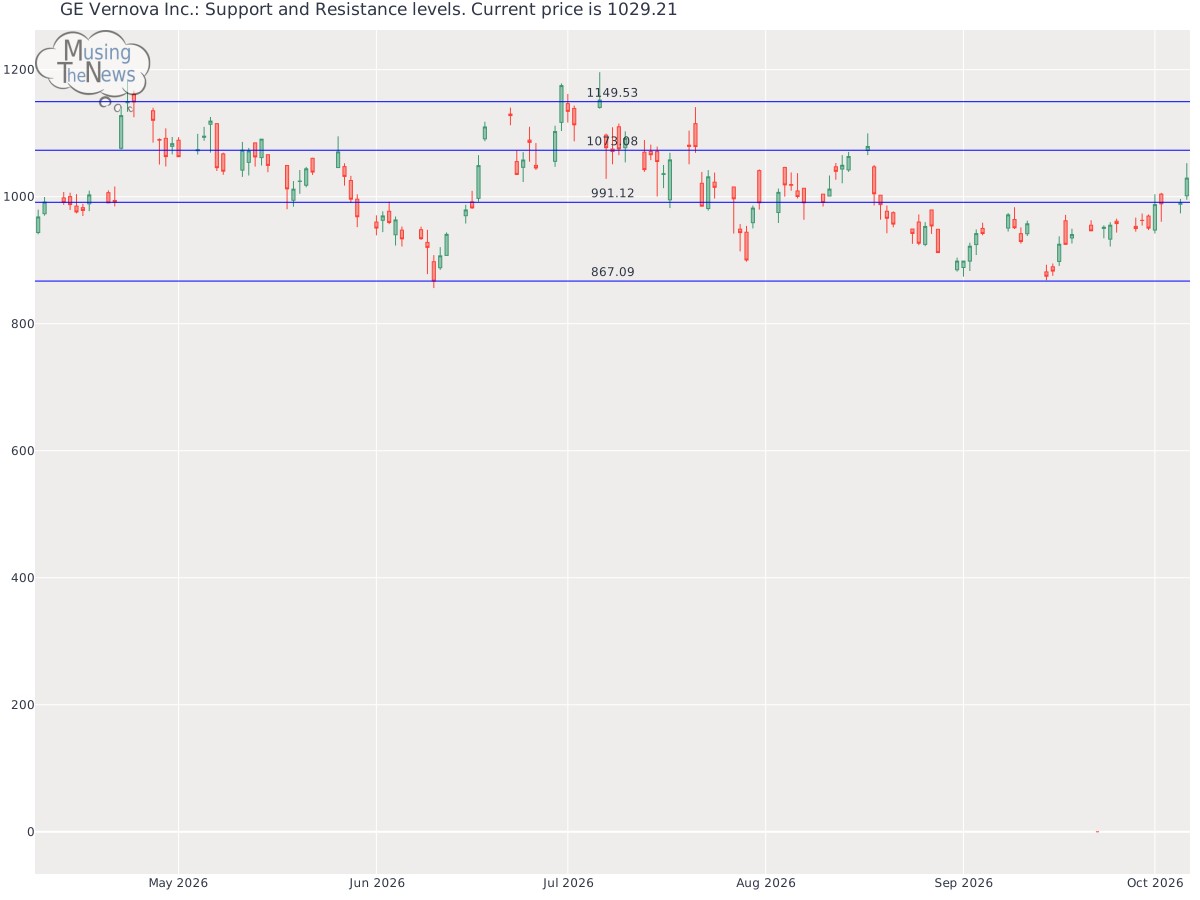
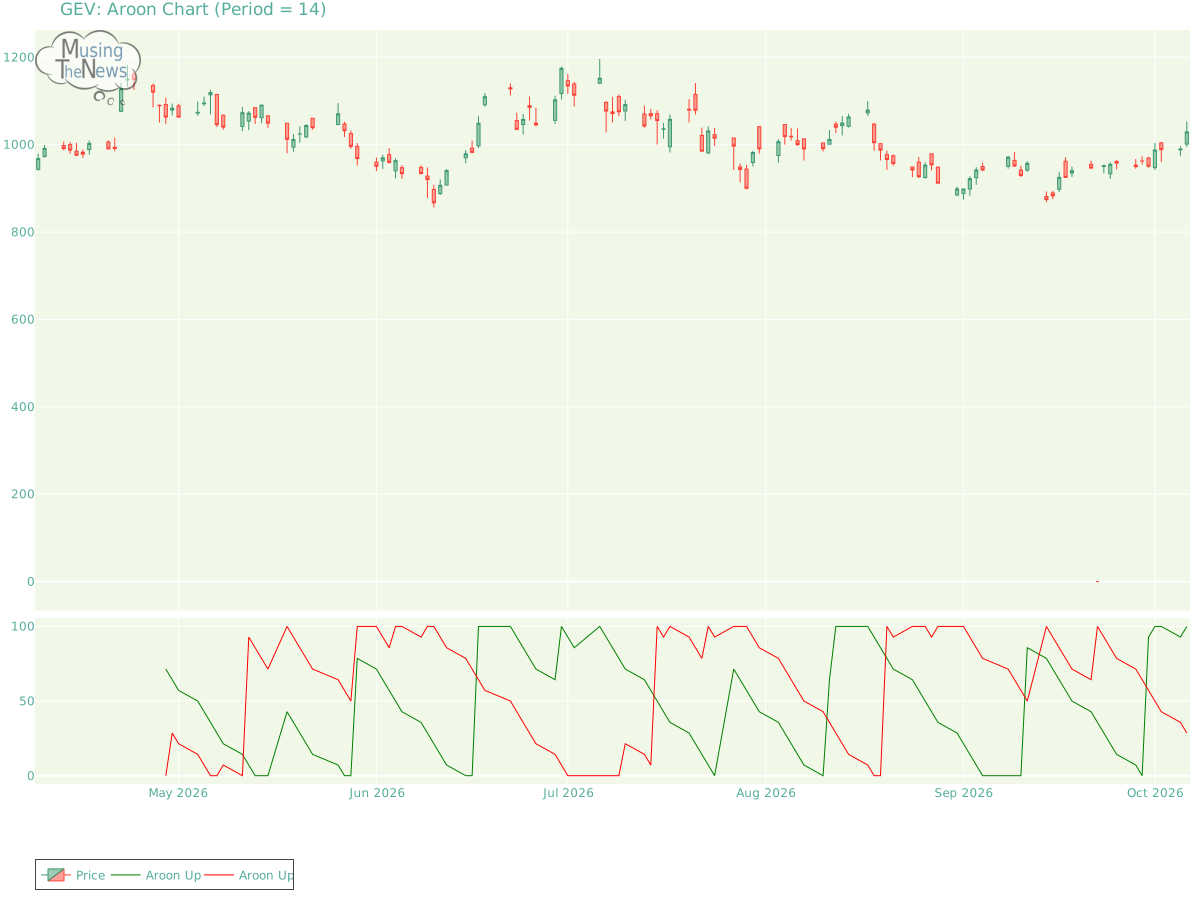
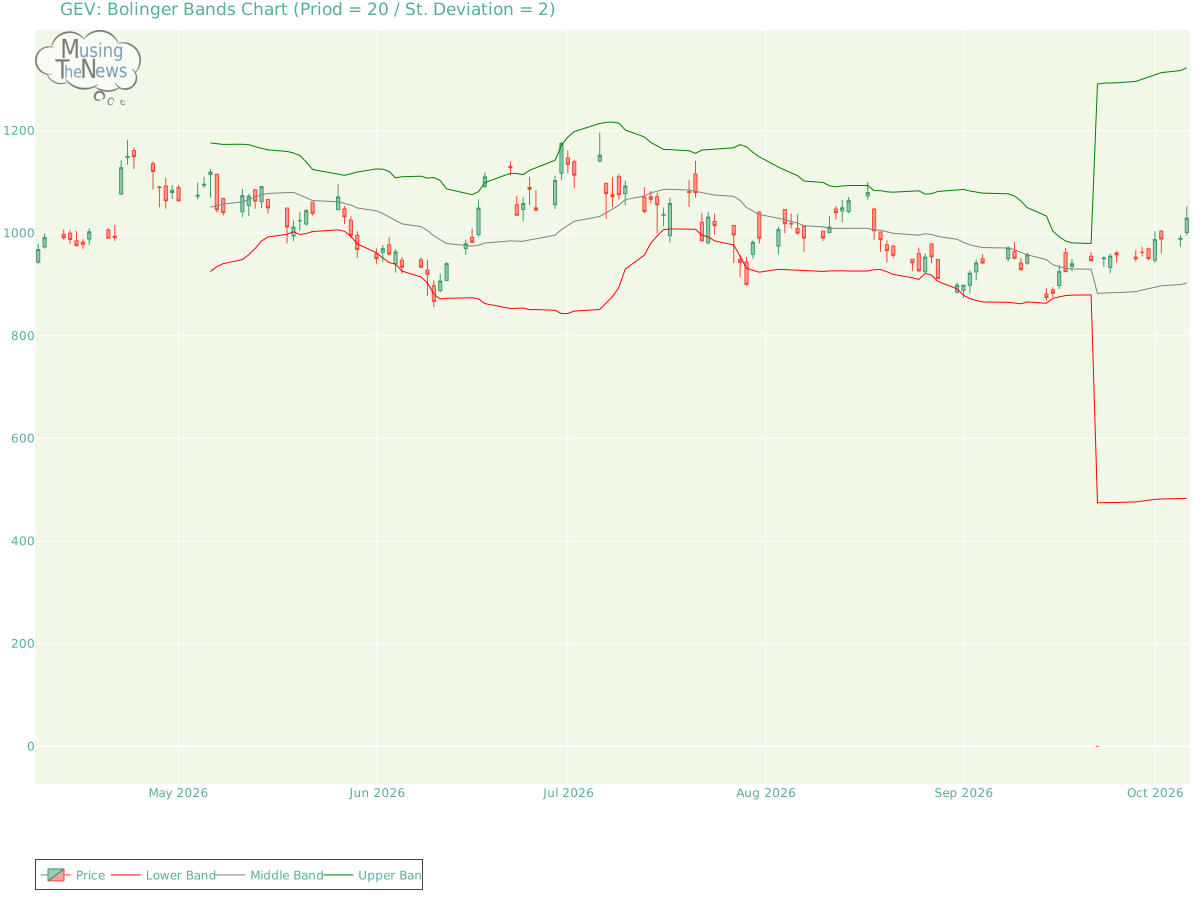
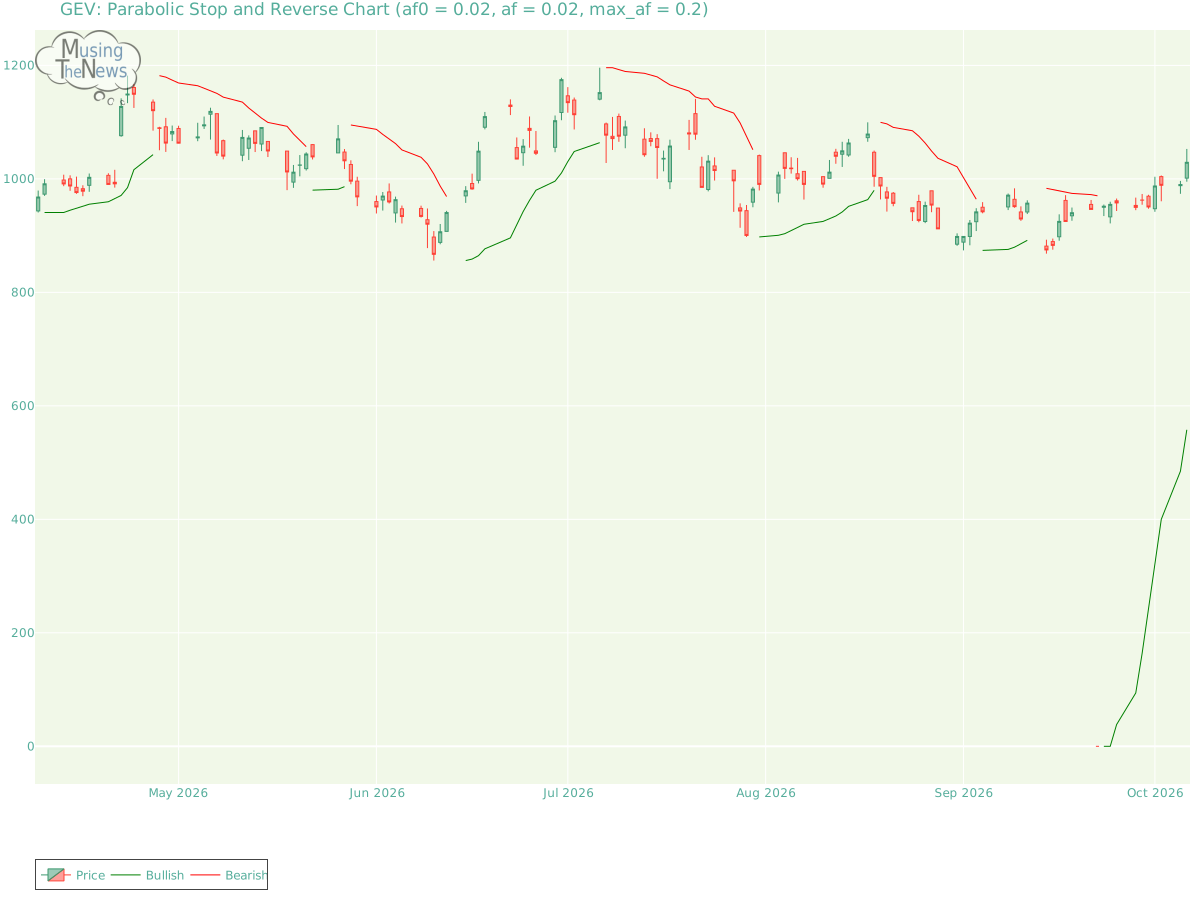
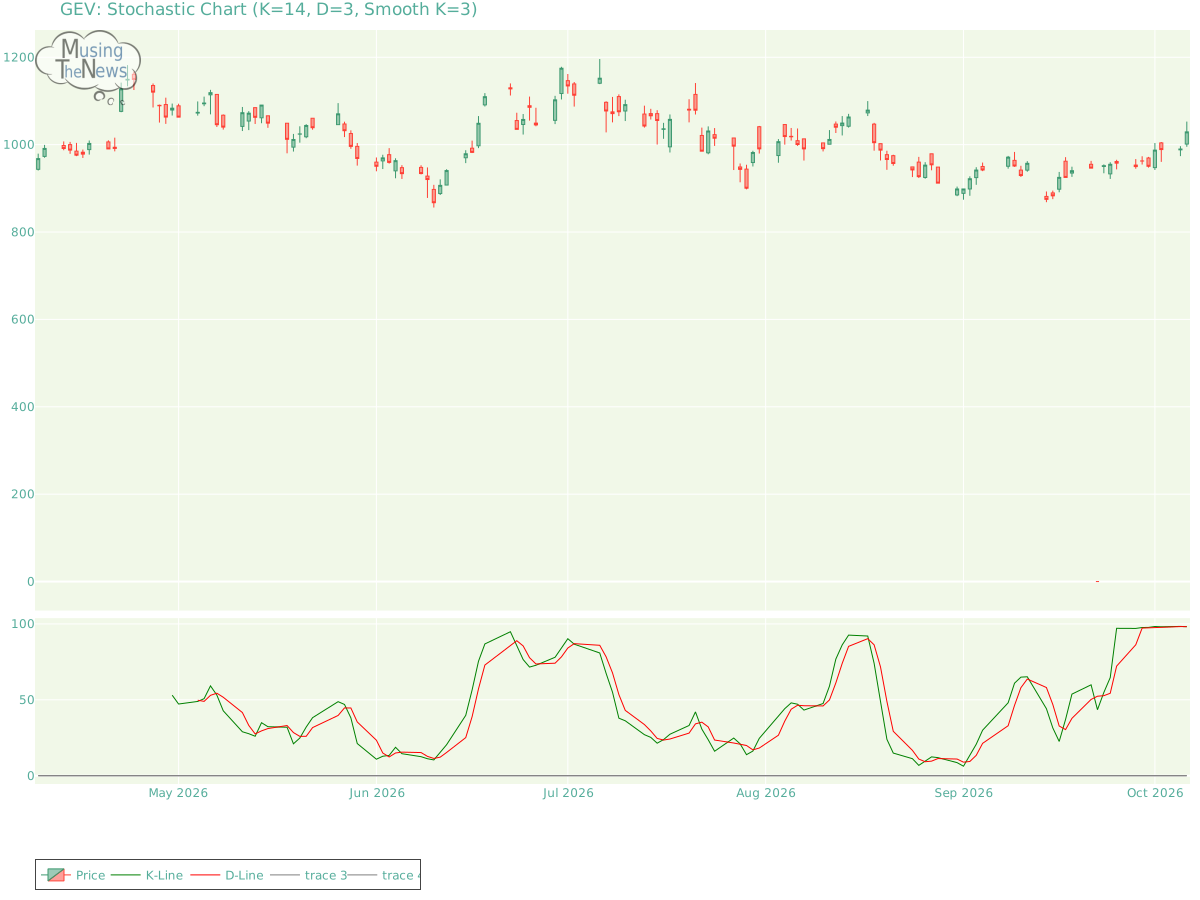
Support and Resistance: The price for GEV is 1029.21, with support at 991.12 and resistance at 1073.08. This suggests a range where 991.12 acts as a base, preventing declines, and 1073.08 caps gains, defining key trading levels.Support/Resistance for GEVAroon: The bullish trend indicated by Aroon persists, with Aroon Up holding steady at the 100 level. This shows strong market momentum, but further exploration using additional indicators is necessary to confirm the trend's strength and future potential.Aroon chart for GE Vernova Inc.Bol. Bands: The BOLL BANDS is in a neutral stance for GEV, not indicating a clear upward or downward trend. This suggests a period of market indecision, where neither bulls nor bears have the upper hand.Bolinger Bands chart for GE Vernova Inc.Parabolic SAR: The PSAR remains bullish in its outlook, establishing a key support level that could serve as a foundation for further upward movement. This persistent bullish stance suggests that the market may continue to trend higher, with the established support providing a potential safety net for investors.Parabolic Stop and Reverse chart for GE Vernova Inc.Stochastic: The K-line for GEV has dipped below the D-line on the stochastic indicator, while remaining above 80, suggesting that a bearish price move might be beginning. This pattern could indicate that the market's upward momentum is fading, possibly leading to a decline. Investors should keep an eye on this potential reversal.Stochastic chart for GE Vernova Inc.Tripple Moving Agerage: The current reading of the Tripple MOVING AVG is neutral for GEV, with no clear signals for an upward or downward trend. This indicates that the market may be in a state of uncertainty, with no dominant force driving the direction.Tripple SMA chart for GE Vernova Inc. To derive valuable insights from a company's technical performance, it is essential to first understand its fundamentals. This includes its financial health, business model, and market share. Equally important is the industry context, such as competition, consumer demand, and market trends. By examining these aspects together, investors can gain a more comprehensive view of how the company's stock behaves and whether it's aligned with its underlying value.