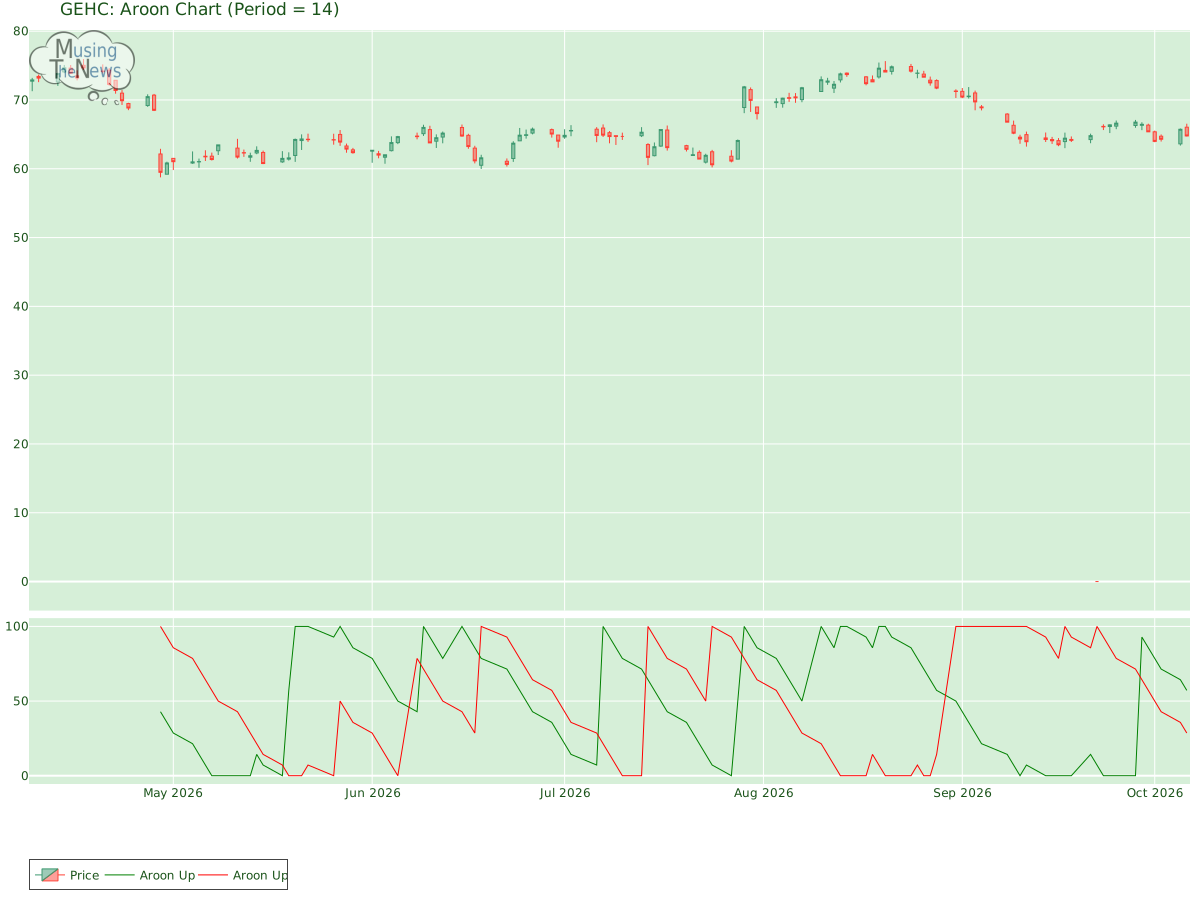
The AROON is in a neutral stance, with no clear signals for movement up or down. This neutral position indicates a potential period of consolidation or uncertainty in the m...
By MusingTheNews
Updated 2026-10-07 23:26:19
Overall Technical outlook
Price Summary
2026-10-06, saw GEHC's stock open at 66.04, hit a peak of 66.55, fall to a low of 64.67, and close down -1.92% at 64.77, with 3553200 shares changing hands. In the past year, the highest stock price was 88.16, and the lowest was 0.0.
Technicals
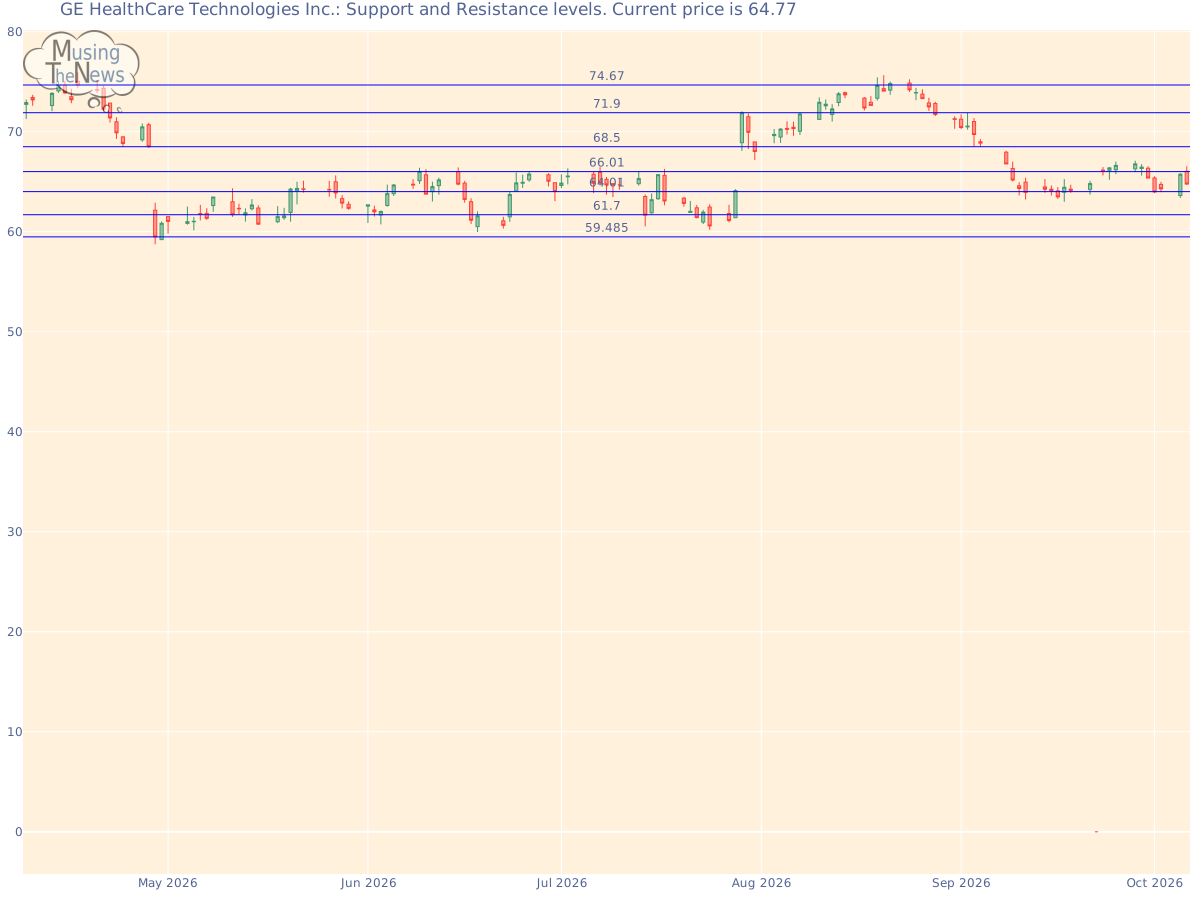
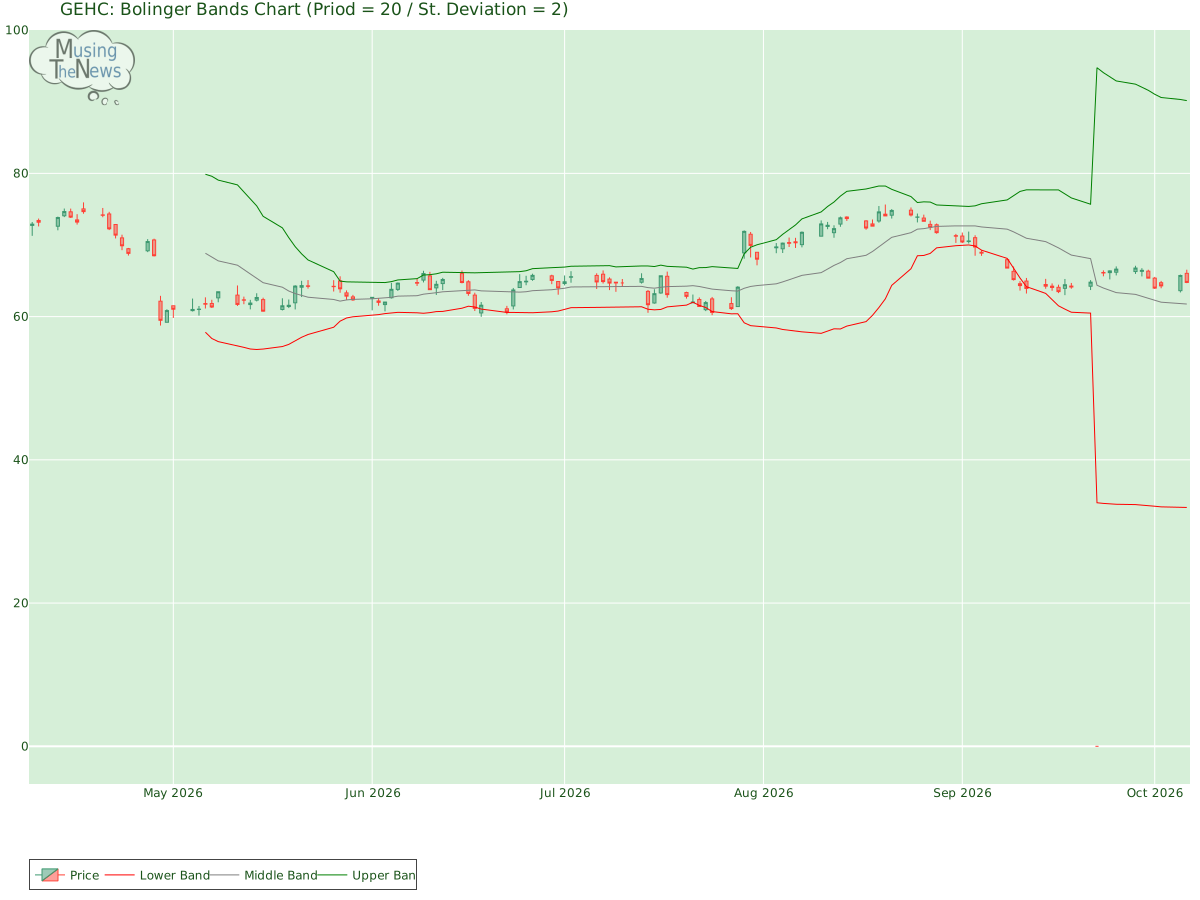
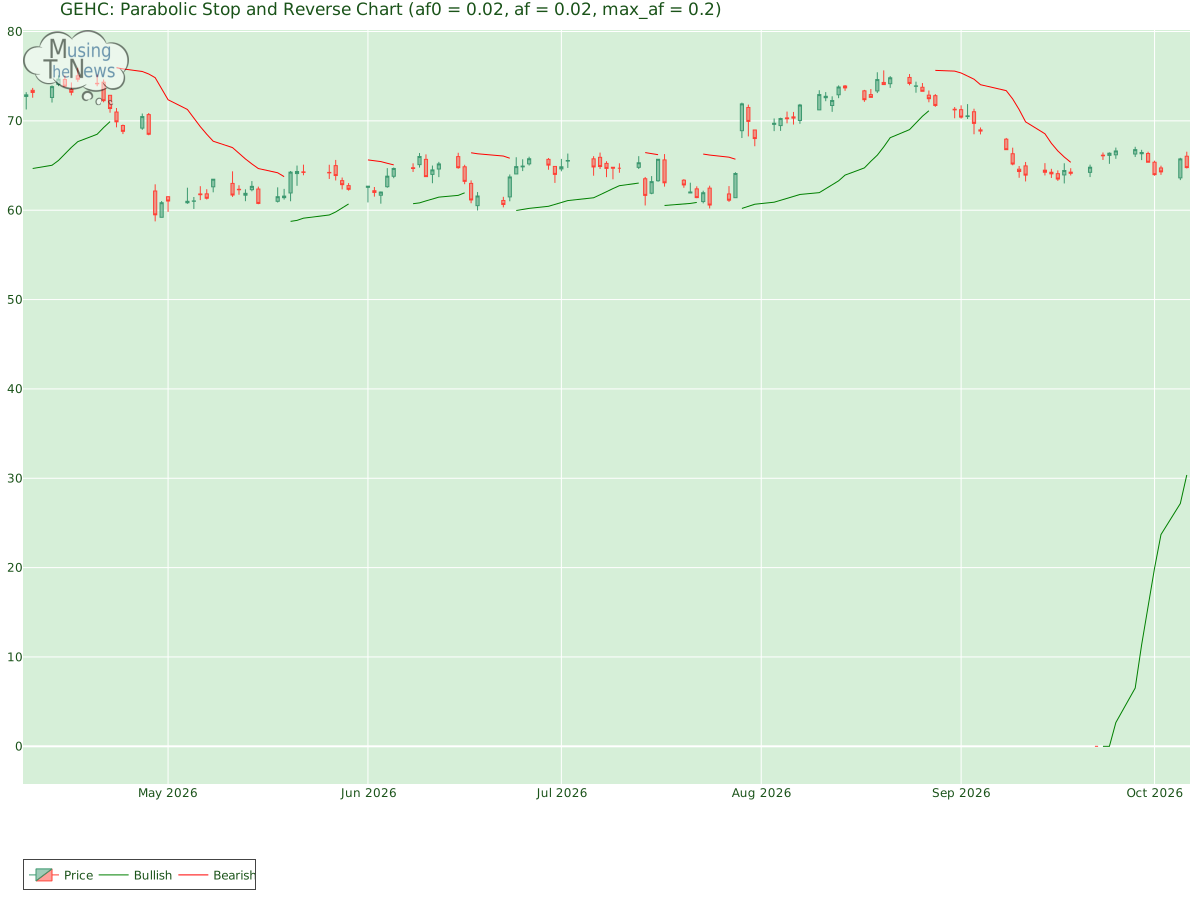
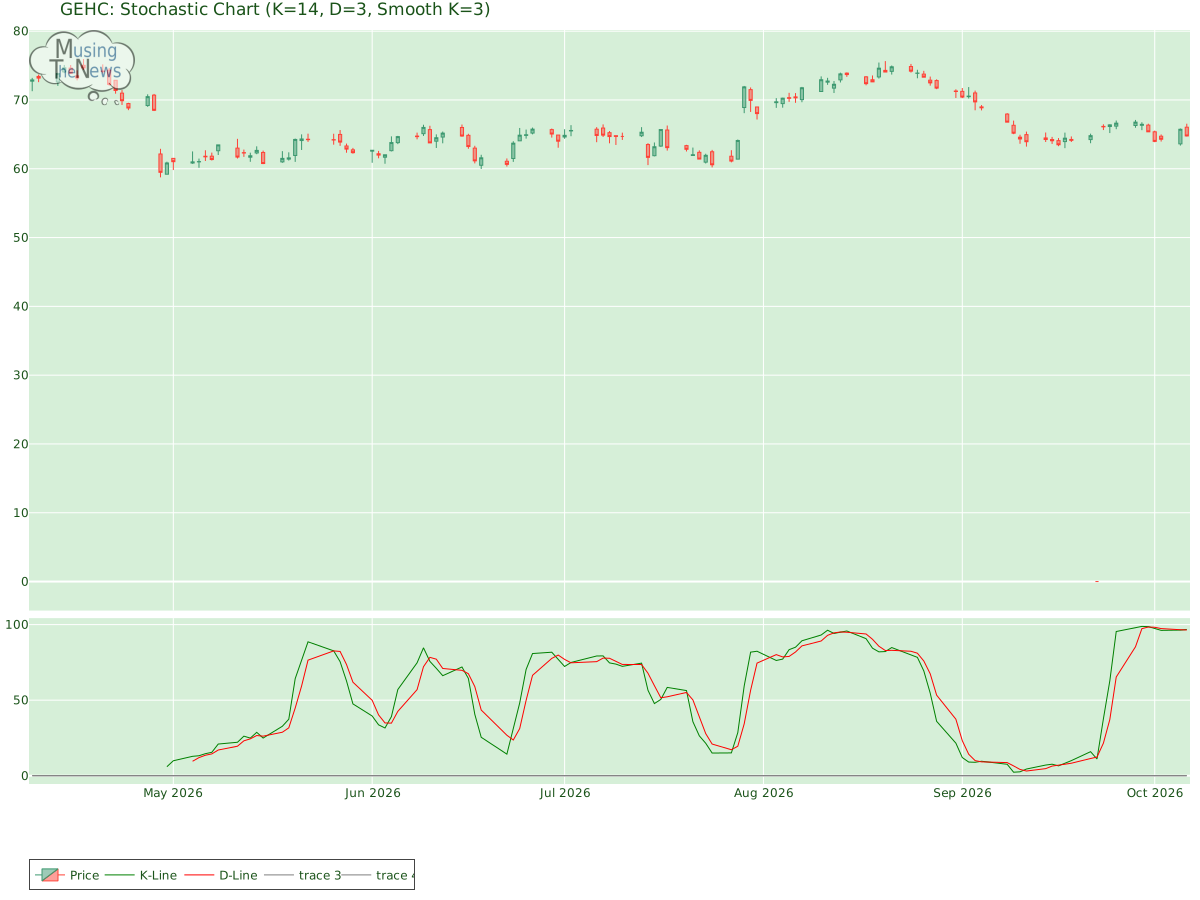
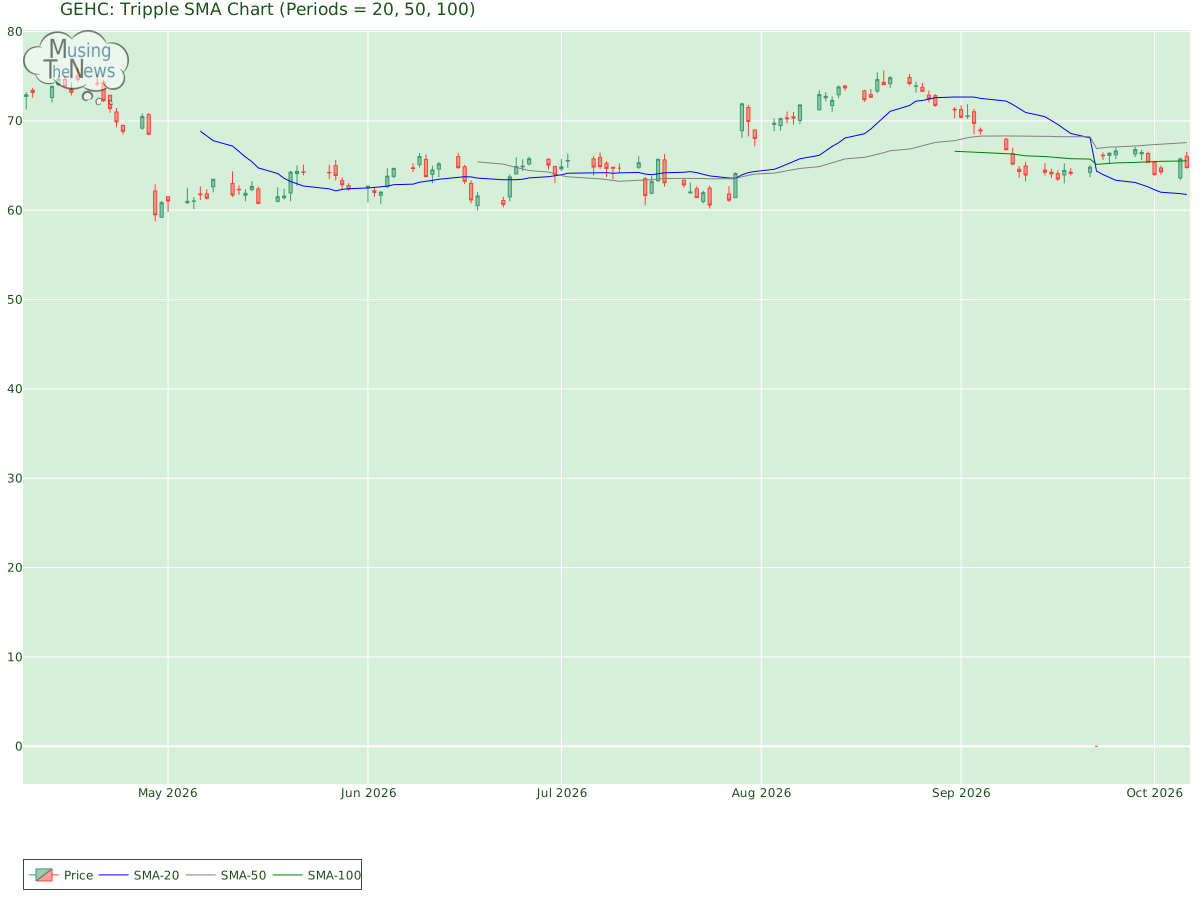
Support and Resistance: The current price of 64.77 is supported at 64.01, with resistance at 66.01. This suggests that the price for GEHC might remain between these levels, where 64.01 acts as a floor and 66.01 as a ceiling in the market.Support/Resistance for GEHCAroon: The AROON is in a neutral stance, with no clear signals for movement up or down. This neutral position indicates a potential period of consolidation or uncertainty in the market.Aroon chart for GE HealthCare Technologies Inc.Bol. Bands: The BOLL BANDS is in a neutral stance, with no clear signals for movement up or down. This neutral position indicates a potential period of consolidation or uncertainty in the market.Bolinger Bands chart for GE HealthCare Technologies Inc.Parabolic SAR: The PSAR remains bullish in its outlook, establishing a key support level that could serve as a foundation for further upward movement. This persistent bullish stance suggests that the market may continue to trend higher, with the established support providing a potential safety net for investors.Parabolic Stop and Reverse chart for GE HealthCare Technologies Inc.Stochastic: The stochastic indicator is in a bullish phase, with the K-line positioned above the D-line and the 80 threshold. This alignment suggests strong upward momentum for GEHC, indicating that the market may continue to trend higher. Traders might see this as a positive signal for sustained strength.Stochastic chart for GE HealthCare Technologies Inc.Tripple Moving Agerage: The Tripple MOVING AVG is showing a neutral stance, not indicating a clear upward or downward trend for GE HealthCare Technologies Inc.. This suggests a period of market balance, where neither side is showing dominance.Tripple SMA chart for GE HealthCare Technologies Inc. To accurately interpret a company's technical data, it is important to first examine its fundamentals. These include financial performance, management quality, and growth prospects. In addition, understanding the dynamics of the industry in which the company operates—such as competition, market trends, and regulatory factors—provides further insights. This combined analysis helps create a fuller picture, allowing for more precise conclusions to be drawn from the company's technical performance and stock behavior.