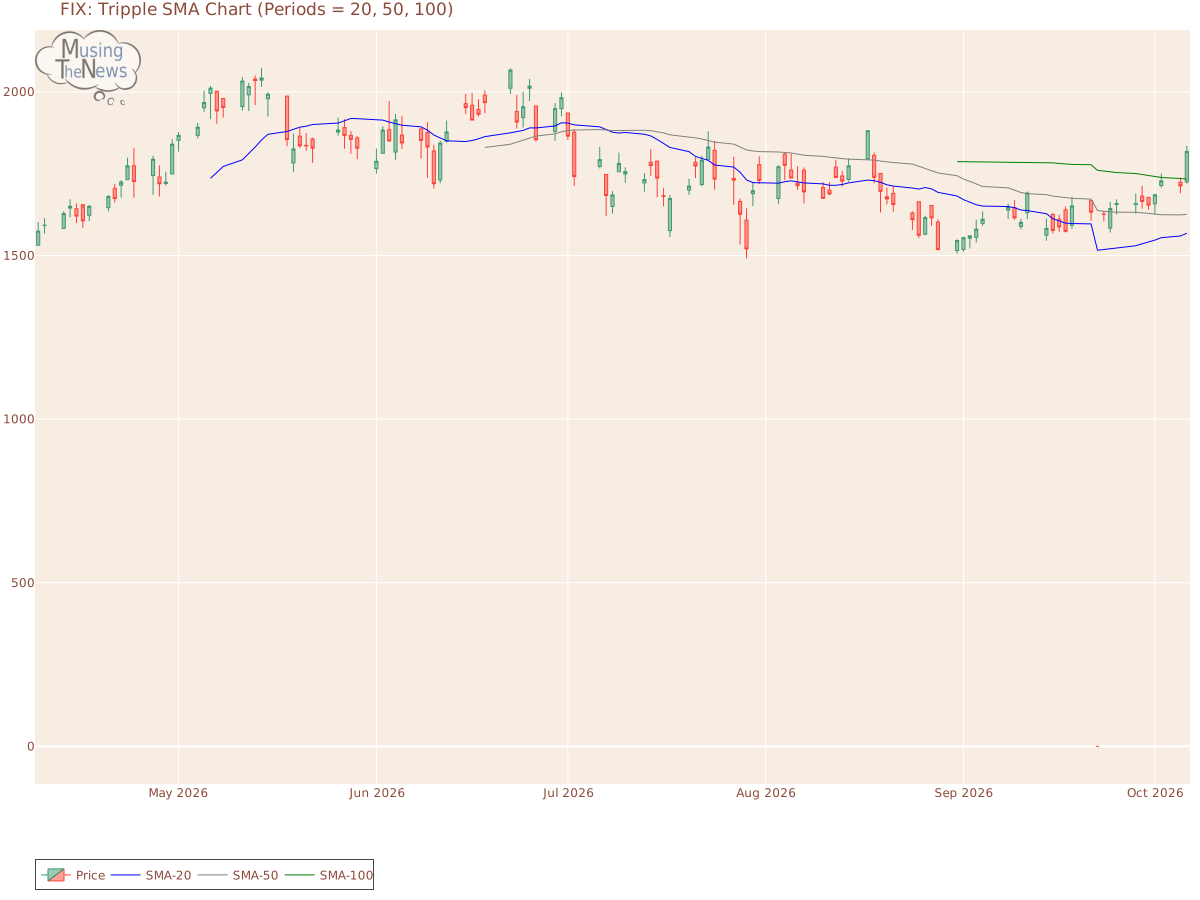
The current state of the Tripple MOVING AVG is neutral, with no clear trend direction indicated. This lack of directional bias suggests that the market may be in a phase of...
By MusingTheNews
Updated 2026-10-07 23:26:02
Overall Technical outlook
Price Summary
With a 5.39% rise, Comfort Systems USA, Inc. enjoyed a fantastic day in the stock market. Comfort Systems USA, Inc.'s stock opened at 1725.0 on 2026-10-06, surged to a high of 1835.04, hit a low of 1720.0, and closed up 5.39% at 1817.96, with 443400 shares traded. During the 52-week span, the stock hit a high of 2066.51 and a low of 0.0.
Technicals
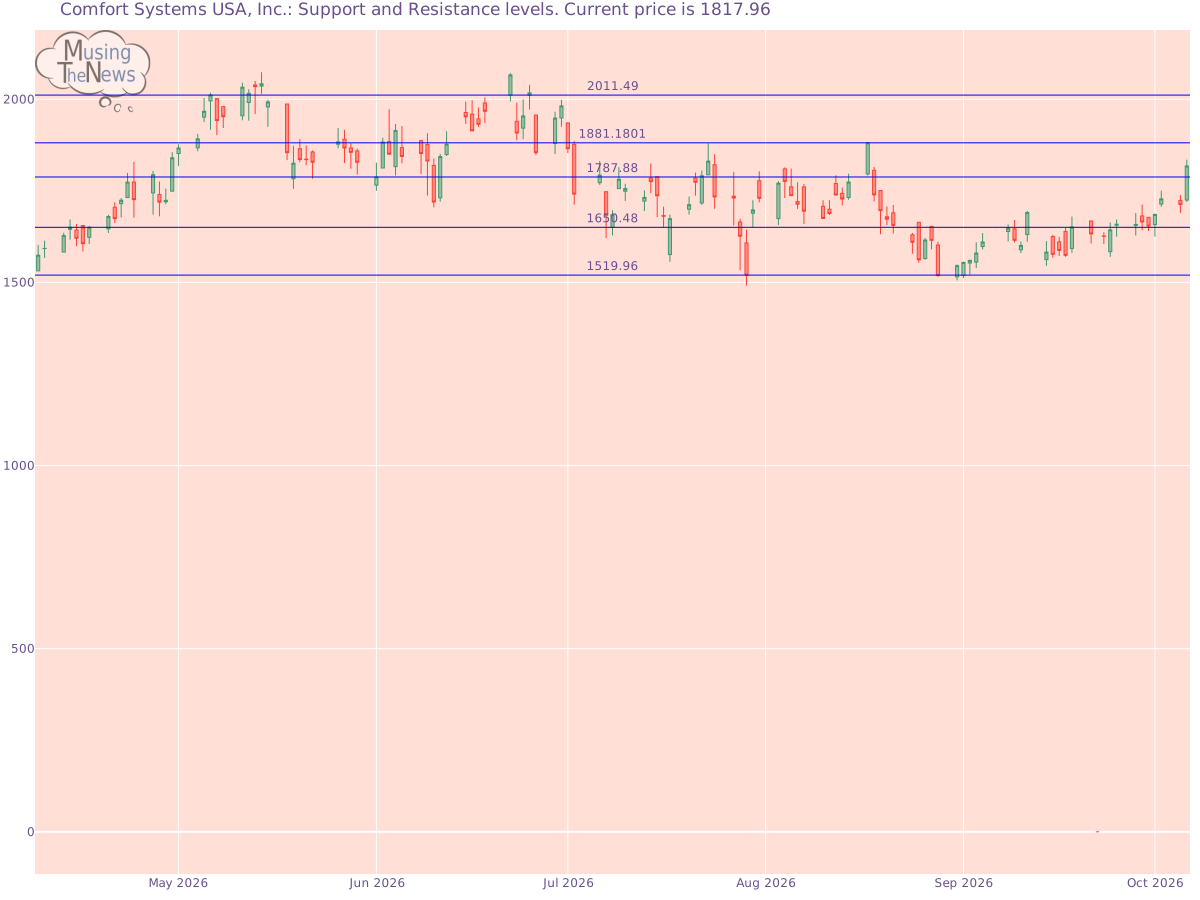
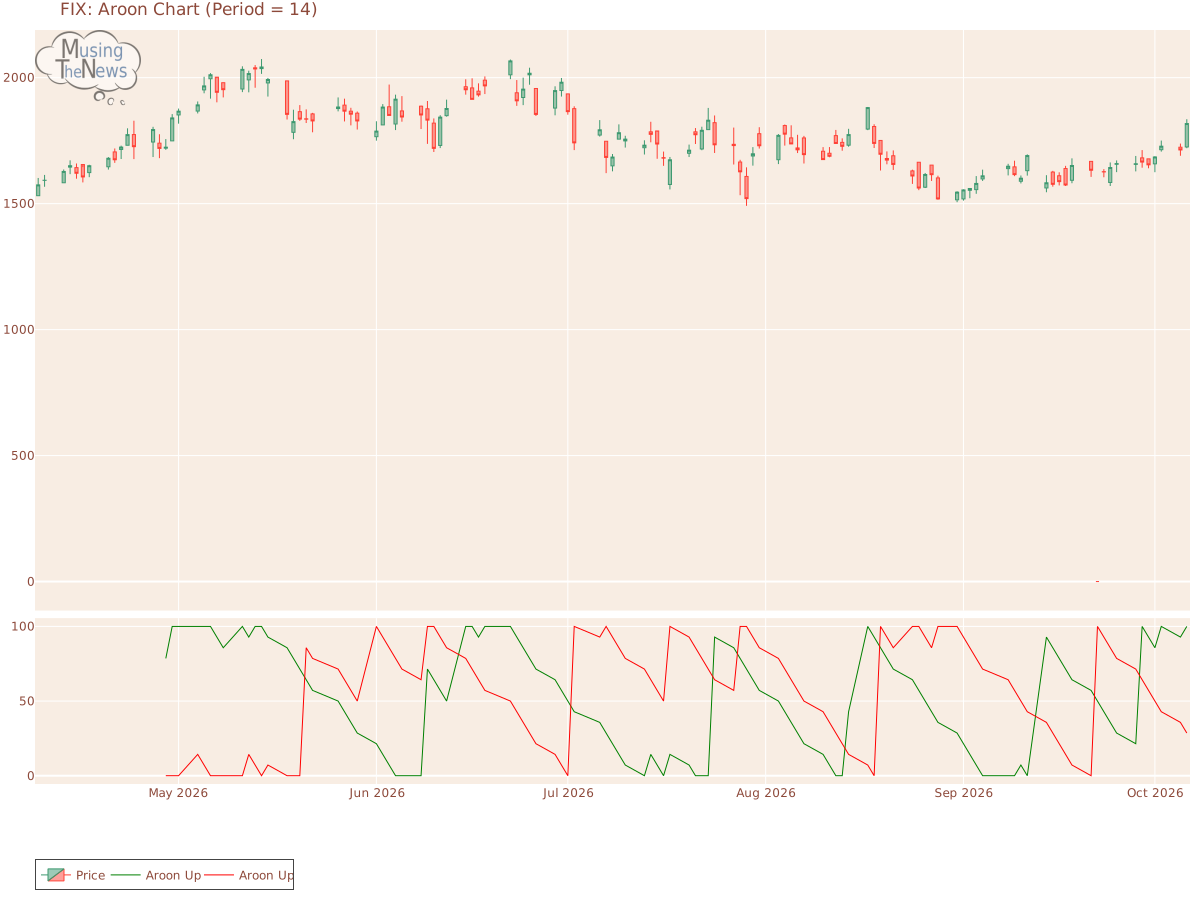
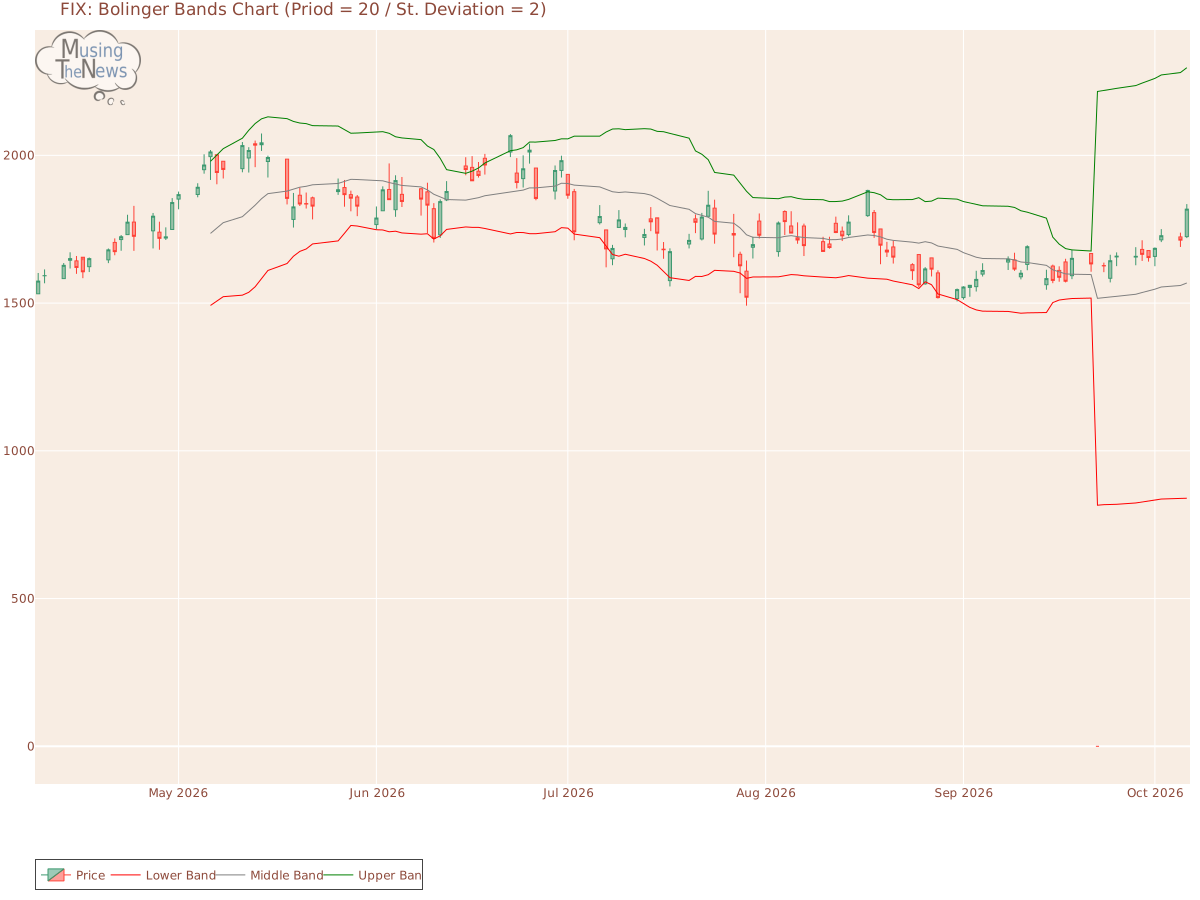
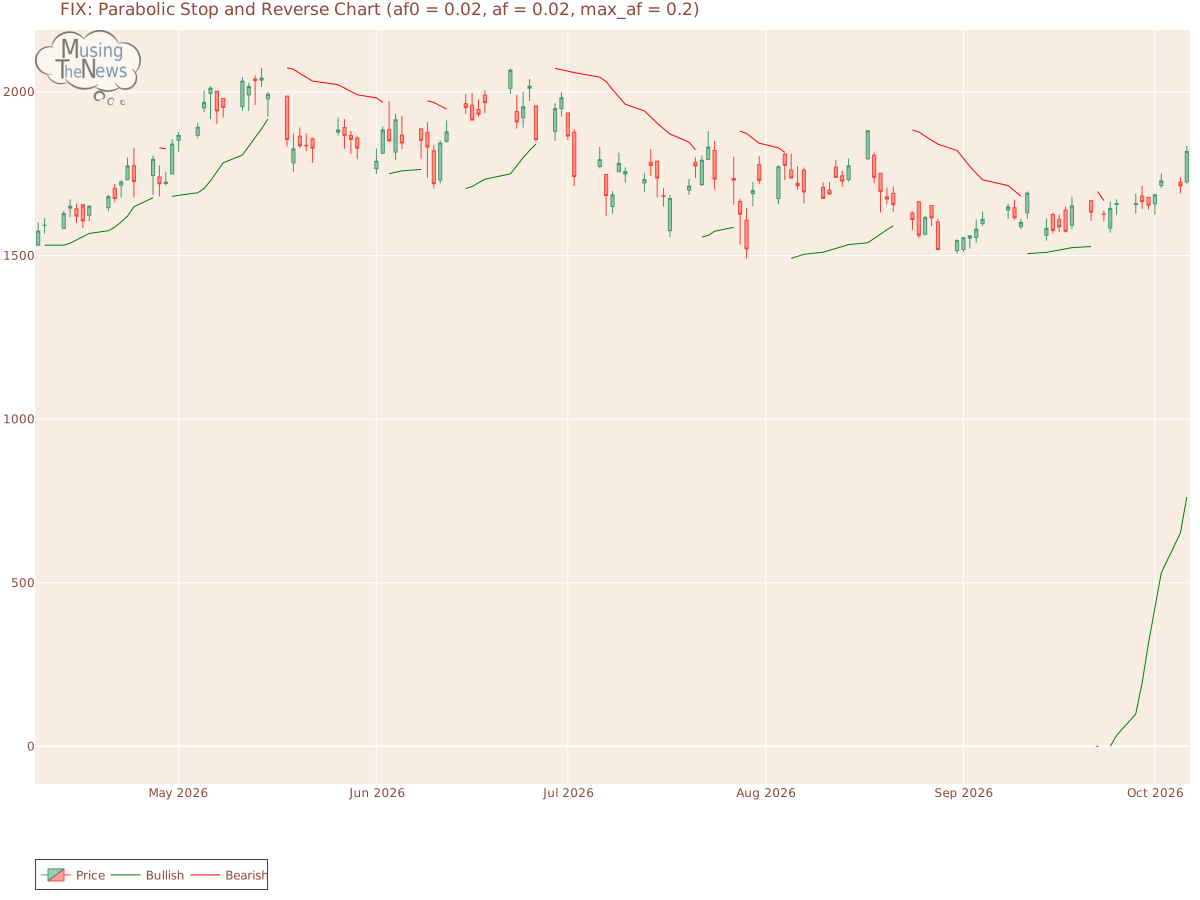
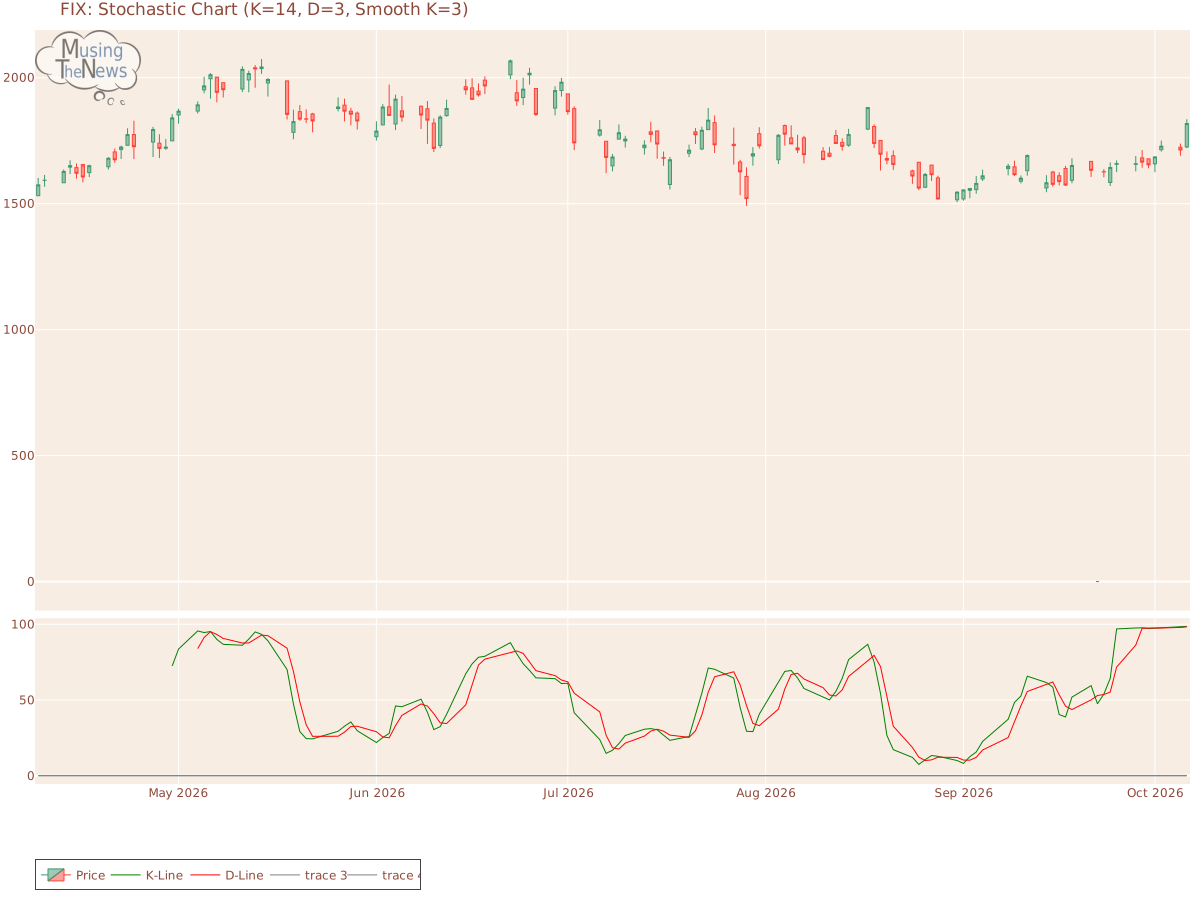
Support and Resistance: At 1817.96, the price is supported at 1787.88 and faces resistance at 1881.18. This range suggests that the price for FIX might stay between these levels, with 1787.88 acting as a floor and 1881.18 as a ceiling.Support/Resistance for FIXAroon: Aroon's bullish trend continues, with Aroon Up at the 100 level, indicating sustained market strength for FIX. This trend warrants further exploration alongside other indicators to fully understand its implications and potential future direction.Aroon chart for Comfort Systems USA, Inc.Bol. Bands: The BOLL BANDS is neutral, showing no definitive signals of a trend either upward or downward. This neutral stance indicates a period of market indecision, where the direction is unclear.Bolinger Bands chart for Comfort Systems USA, Inc.Parabolic SAR: The PSAR for FIX continues to signal a bullish outlook, establishing a crucial support level that may help sustain the current upward momentum. This level of support suggests that the market is likely to continue trending higher, providing a foundation for ongoing bullish movement.Parabolic Stop and Reverse chart for Comfort Systems USA, Inc.Stochastic: The stochastic indicator is in a bullish phase, with the K-line positioned above the D-line and the 80 threshold. This alignment suggests strong upward momentum for FIX, indicating that the market may continue to trend higher. Traders might see this as a positive signal for sustained strength.Stochastic chart for Comfort Systems USA, Inc.Tripple Moving Agerage: The current state of the Tripple MOVING AVG is neutral, with no clear trend direction indicated. This lack of directional bias suggests that the market may be in a phase of consolidation or uncertainty.Tripple SMA chart for Comfort Systems USA, Inc. When evaluating a company's technical data, such as stock price charts or volume, it is essential to first consider its fundamentals. These fundamentals include financial stability, growth potential, and competitive advantages. Additionally, understanding the broader industry in which the company operates offers context that helps to make sense of technical patterns. By examining both the company's internal strengths and external environment, one can make more accurate and meaningful conclusions about its stock performance.